
2022 has been detrimental for global equity markets. A plethora of factors ranging from inflation reaching a multi-decade high and rapidly-rising interest rates to the war in Ukraine triggered a sizable sell-off across stock markets, wiping trillions of dollars of value.
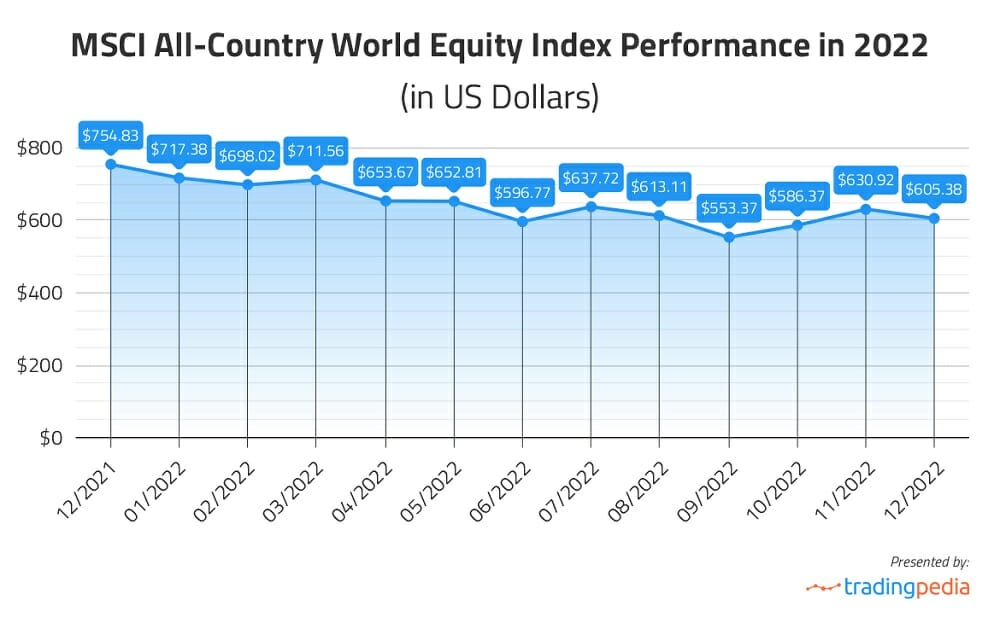
The MSCI All-Country World Equity Index, which reflects the performance of Equities across 23 developed and 24 emerging markets, registered its largest annual decline since the 2008 financial crisis, retreating 19.76% in 2022.
Q4 2022 hedge fund letters, conferences and more
According to Bloomberg data, the wealthiest 500 individuals alone lost nearly $1.4 trillion last year and our team at TradingPedia decided to dig deep into the performance of the global stock markets.
What Did Affect Stock Markets In 2022?
First, as economies reopened after months-long COVID-19-related lockdowns, consumer inflation hit multi-decade highs and remained elevated, thus, dampening hopes the surge will only be transitory. This forced central banks worldwide to initiate a cycle of aggressive monetary policy tightening to curb rising price pressures.
“The decade-long era of cheap money supply has ended, as inflation remained more persistent than originally anticipated. Central banks had to raise interest rates and some of them such as the Federal Reserve and the European Central Bank demonstrated determination to bring inflation back within the target range even at the risk of tipping the economy into recession. I think banks still have a long way to go to restore price stability.”
– comments Brian McColl, analyst at TradingPedia.
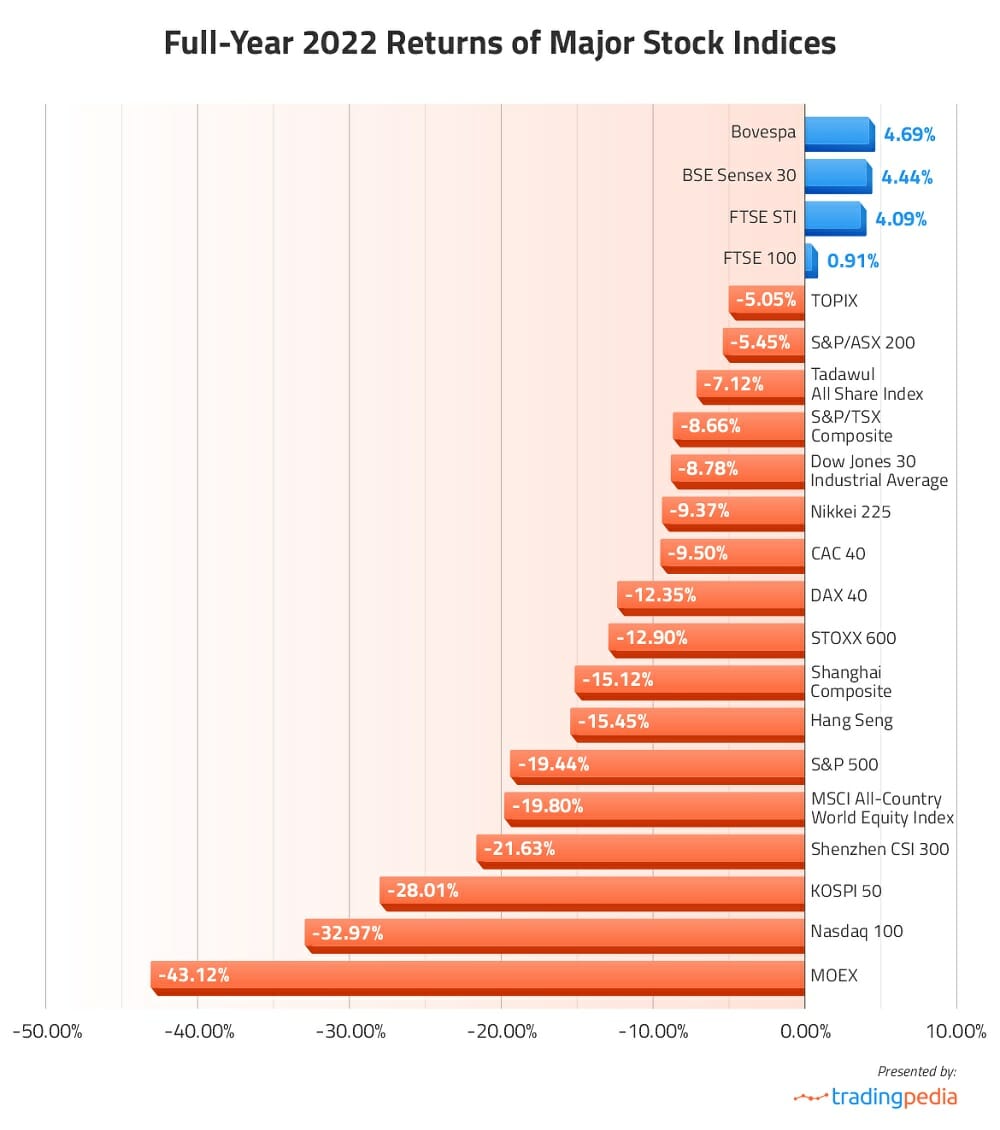
Concerns over elevated inflation, continuing aggressive monetary policy tightening and the real threat of a recession drove major stock indices worldwide deep into red territory. In the US, the benchmark S&P 500 Index retreated 19.44%, while Nasdaq 100 plunged 33% in 2022.
Another major factor behind stock market sell-off has been the economic fallout from Russia’s incursion into Ukraine. This act of aggression pushed commodity prices sky-high and as Russia weaponized European gas supplies in response to Western sanctions against it, Europe sank into a severe energy crisis.
Europe’s STOXX 600 Index plummeted 12.90% last year, its biggest annual drop since 2018, German DAX 40 lost 12.35% of its value and French CAC 40 retreated 9.50%.
Unfortunately, the long-term global impact from the war in Ukraine is still an open question, as it depends on how long the conflict continues and if military operations spread to other countries.
Third, the continued uncertainty that stems from the still-present COVID-19. Frequent lockdown of cities across China as part of the government’s “zero COVID” policy disrupted overall economic activity there and triggered a 21.63% drop in the Shanghai Shenzhen CSI 300 Index and a 15.12% loss in the Shanghai Composite last year.
World’s No.1 Asset Manager BlackRock posts 14% drop in total AUM in Fourth Quarter as Equity Assets shrink 17%
Against this backdrop, major publicly-traded asset management companies have been grappling with a decline in revenue and assets under management (AUM) along with rising expenses throughout 2022.
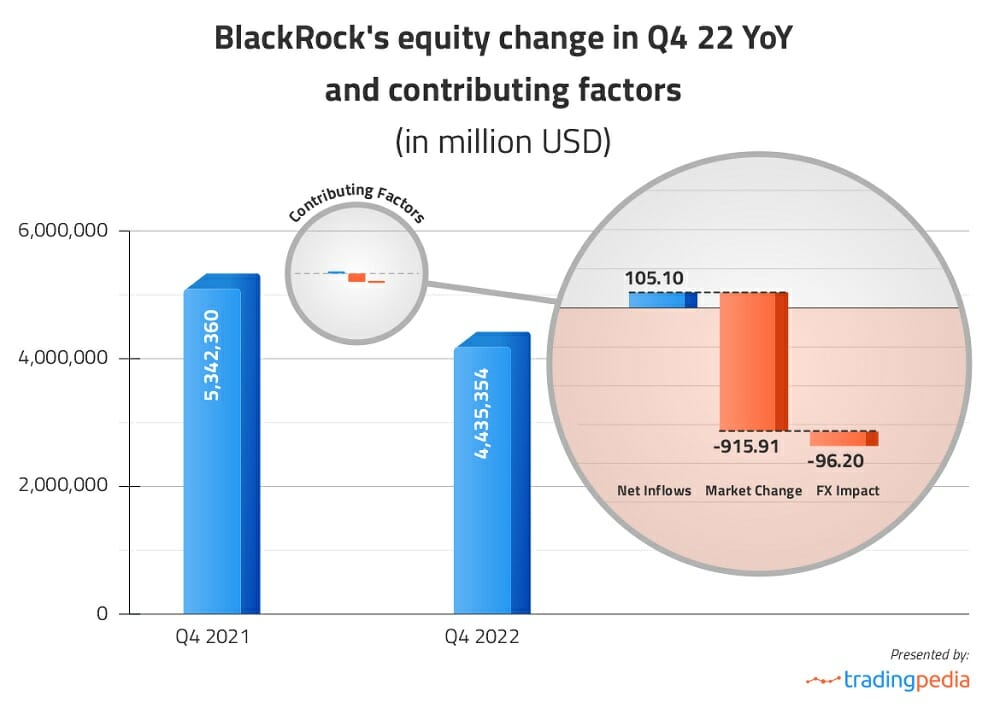
BlackRock, the largest asset manager by total AUM globally, reported a 14.1% YoY drop in AUM during Q4 of 2022, driven by a 17% YoY decline in Equity AUM, a 16.1% slump in Multi-Asset AUM and a 10.1% YoY decrease in Fixed Income AUM.
In Q4 of 2022, Equity assets ($4.435 trillion) accounted for 51.61% of BlackRock’s total AUM, compared with 53.37% in Q4 of 2021.
| BlackRock’s AUM by Investment Product Type (in millions $) | ||||
| Product | Q4 2021 | Q4 2022 | % of Total AUM – Q4 2021 | % of Total AUM – Q4 2022 |
| Equity | 5,342,360 | 4,435,354 | 53.37% | 51.61% |
| Fixed Income | 2,822,041 | 2,536,823 | 28.19% | 29.52% |
| Multi-Asset | 816.494 | 684.904 | 8.16% | 7.97% |
| Alternatives (incl. Currencies and Commodities) | 264.881 | 266.210 | 2.65% | 3.10% |
| Cash Management | 755.057 | 671.194 | 7.54% | 7.80% |
| Advisory | 9.310 | – | 0.09% | – |
| Total AUM | 10,010,143 | 8,594,485 | 100% | 100% |
What did contribute to the change in Equity AUM in 2022?
The largest part of the decline in Equity AUM was attributed to stock market sell-off. According to BlackRock data, the negative impact from stock market movement on the company’s Equity AUM last year was estimated at about $0.916 trillion.
Another factor that adversely affected Equity AUM was Foreign Exchange-related. Non-US Dollar denominated assets under management were translated into US Dollars for reporting purposes. Last year, the USD appreciated 8% against a basket of six major currencies. The FX impact on BlackRock’s Equity AUM was estimated at about $0.096 trillion.
And third, net inflows had a positive impact of about $0.105 trillion.
AUM distribution by Client TypeM
According to BlackRock data, institutional clients held 56% of the company’s total AUM in Q4, retail clients held 10% and ETFs accounted for the remaining 34% of total assets.
With regard to Equity AUM, institutional clients held 44.7% of assets in Q4 of 2022, retail clients held 8.3% and ETFs accounted for the remaining 47.0%. ETFs’ share in Equity AUM increased by 1.2% compared to Q4 of 2021, while the AUM shares of retail and institutional clients both decreased.
| Equity AUM distribution by Client Type (in millions $) | ||
| Client Type | Q4 2021 | Q4 2022 |
| Institutional Clientele | 2,423,175 | 1,983,000 |
| Retail Clientele | 471.937 | 370.612 |
| ETFs | 2,447,248 | 2,081,742 |
| Total Equity AUM | 5,342,360 | 4,435,354 |
Revenue distribution by Investment Product Type
The company’s total revenue came in at $4.337 billion in Q4, while marking a 15.1% YoY drop.
BlackRock’s Base Fees, which accounted for 78.4% of its total revenue, decreased 14.3% year-on-year to $3.399 billion in Q4 of 2022, reflecting sizeable declines in revenue from Equity and Fixed Income segments.
Equity revenue, which accounted for 48.8% of total Base Fees, dropped 20.7% YoY to $1.658 billion in Q4, mostly due to the negative impact of market beta and USD appreciation on the company’s AUM.
| BlackRock’s Base Fees* by Investment Product Type (in millions $) | ||||
| Product | Q4 2021 | Q4 2022 | % of Total Base Fees – Q4 2021 | % of Total Base Fees – Q4 2022 |
| Equity | 2.092 | 1.658 | 52.72% | 48.78% |
| Fixed Income | 989 | 830 | 24.92% | 24.42% |
| Multi-Asset | 373 | 293 | 9.40% | 8.62% |
| Alternatives | 389 | 391 | 9.80% | 11.50% |
| Cash management | 125 | 227 | 3.16% | 6.68% |
| Total Base Fees | 3.968 | 3.399 | 100% | 100% |
* Base Fees include investment advisory, administration fees and securities lending revenue
Performance fees, another closely watched revenue component, decreased 30.7% YoY to $228 million in Q4, mostly due to a 56.6% slump in Equity revenue and an 18.2% drop in revenue from Alternatives. The overall decrease was partially offset by higher revenue (up 88.5% YoY) from illiquid alternative products.
| BlackRock’s Performance Fees by Investment Product Type (in millions $) | ||||
| Product | Q4 2021 | Q4 2022 | % of Total Pref. Fees – Q4 2021 | % of Total Pref. Fees – Q4 2022 |
| Equity | 83 | 36 | 25.23% | 15.79% |
| Fixed Income | 17 | 6 | 5.17% | 2.63% |
| Multi-Asset | 15 | 11 | 4.56% | 4.82% |
| Alternatives | 214 | 175 | 65.04% | 76.76% |
| Total Performance Fees | 329 | 228 | 100% | 100% |
BlackRock’s adjusted operating income shrank 25.1% YoY to $1.577 billion in Q4 of 2022, while adjusted operating margin decreased 5.4% to 41.2%.
Net income attributable to BlackRock shareholders, adjusted for special items, dropped 17.8% YoY to $1.356 billion in Q4, while adjusted diluted earnings per common share decreased 16.4% YoY to $8.93.
Full-year results also registered declines compared to 2021.
BlackRock’s Stock Return
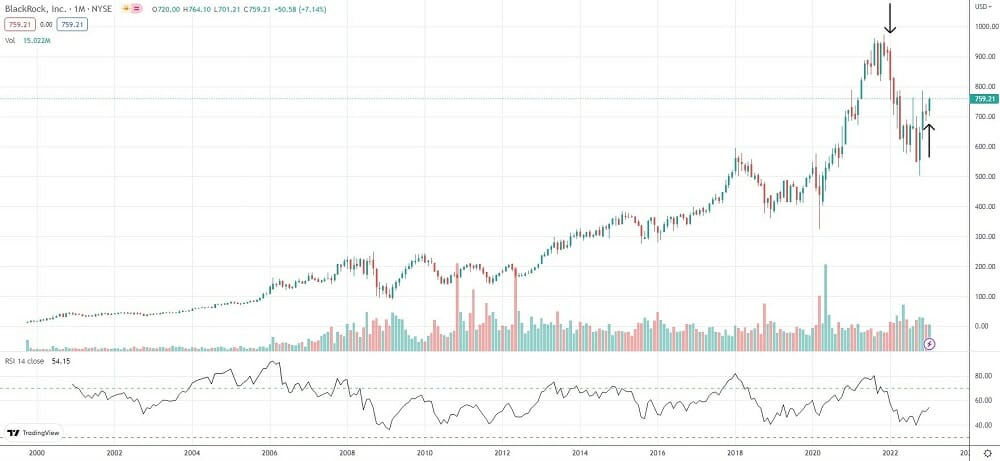
BlackRock (NYSE:BLK) has generated a total return of 7,700% to its shareholders since its IPO in October 1999. The company claims this has been the most formidable return achieved by any financial services firm within the S&P 500 Index over the same period.
In 2022, BlackRock’s stock retreated 22.6%, slightly underperforming the S&P 500 benchmark.
The Top 10 Asset Managers by Total AUM in Q4 2022
| The 10 Largest Asset Managers by Total AUM | ||
| Asset Management Company | Total Assets under Management | Region |
| BlackRock | $8,594,485,000,000 | North America |
| Vanguard | $8,100,000,000,000 | North America |
| Fidelity Management & Research | $3,688,587,311,060 | North America |
| The Capital Group Cos. Inc. | $3,099,186,116,994 | North America |
| Amundi | $2,011,000,000,000 | Europe |
| Pacific Investment Management Company LLC | $1,690,000,000,000 | North America |
| Wellington Management Company | $1,400,000,000,000 | North America |
| Invesco | $1,390,400,000,000 | North America |
| Franklin Resources Inc. | $1,300,000,000,000 | North America |
| T. Rowe Price Group Inc. | $1,230,000,000,000 | North America |
Source: Sovereign Wealth Fund Institute
As of the end of Q4 2022, BlackRock Inc has retaken the leading position among major asset managers with total AUM globally of $8.594 trillion, followed by The Vanguard Group Inc with $8.100 trillion and Fidelity Management & Research LLC with $3.688 trillion.
Q1 2023 Revenue, EPS Forecasts
With regard to the first quarter of 2023, BlackRock’s AUM, revenue and earnings are expected to remain under pressure, as unfavorable macroeconomic conditions will probably continue to persist.
A consensus of analyst estimates points to first-quarter revenue of $4.22 billion and diluted earnings per share of $7.96.
Article by Michael Fisher, TradingPedia
About Michael Fisher
Michael is an active trader and market analyst. He has participated in surveys regarding trend-following trading systems.
About TradingPedia.com
TradingPedia.com is a financial media specialized in providing daily news and education covering Forex, equities and commodities. Our academies for traders cover Forex, Price Action and Social Trading.


