Barac Capital Management letter to investors for the fourth quarter ended December 31, 2019.
Q4 2019 hedge fund letters, conferences and more
Dear All,
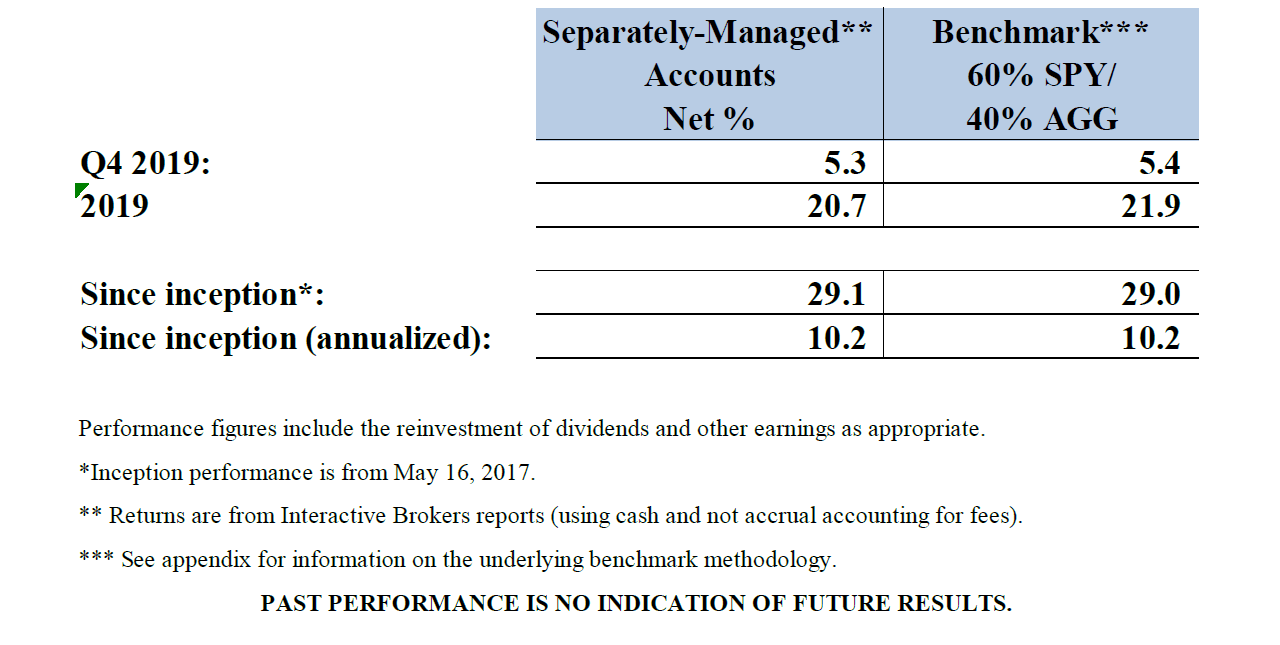
The aggregate performance of Barac Capital Management’s (“BCM”) separately-managed-accounts (“SMAs”)12 for the fourth-quarter ending December 31, 2019 was 5.3% relative to a 5.4% return for BCM’s benchmark.
Individual account performance may vary, depending on timing factors, fee levels, and customized asset allocations. Please check your brokerage statements for the actual returns of your individual accounts.

Second Quarter Performance
Fourth quarter returns amounted to 5.3% on a net basis (5.4% for the benchmark), bringing year-to-date returns to 20.7%. Cumulative returns since inception on May 16, 2017 amounted to 29.1% (10.2% annualized).
Top individual contributors for the quarter included Ralph Lauren (+24%), Target (+21%), and Goldman Sachs (+12%). There were no substantial detractors for the period.
As always, it is important to re-state that returns were generated without leverage (either direct or effective leverage, through options), without taking highly concentrated positions, and while conservatively holding substantial cash and/or Treasury bond positions.
Performance Commentary
The fourth quarter wasn’t a particularly remarkable quarter – with returns broadly in-line with the benchmark. The conservative asset allocation of SMAs constrained the magnitude of positive returns for the quarter and year; however, that same positioning has been of benefit during the current quarter.
In light of recent market volatility, I’ll spend most of this letter writing about this current quarter and how I’m positioned and reacting to the recent market sell-off. Going forward, I expect to comment provide more commentary on individual positions in subsequent letters.
At one point today, the S&P 500 index reached levels that were more than 10% below the recent market highs. While a dramatic fall over such a short period of time, it’s really a modest pullback in the broader context of the 31% total returns that were realized by the index in 2019. Furthermore, the pullback was the result of developments that I believe are of very legitimate concern and should rationally result in a discount in overall market valuations.
That said, I do believe that the sell-off presented some long-term opportunities and I have added some limited exposure in selective stocks. While I believe there is considerable potential for further pain for the broader stock market, I also expect to add more stock exposure if/when prices decline (such that additional opportunities result). That said, I will continue to limit concentration in any one stock and will be prudent and gradual with any incremental allocations.
Overall, I believe that caution is still warranted. Both, as a result of the substantial coronavirus risks and for the other reasons that I have given before and will repeat again:
Not only are price-to-earnings levels high by historical standards, but the earnings part of that equation continues to reflect very favorable dynamics that are cyclical and/or otherwise subject to potential adverse change: low interest rates (and low credit spreads), the positive wealth effect of 10 years of rising stock prices and home values, high levels of deficit spending, and record low unemployment levels.
Furthermore, current valuations still appear to incorporate too little with respect to geo-political risks at a time when there is much political change and uncertainty. It also warrants keeping in mind that if/when the business cycle does turn (and assets prices fall), a resulting “reverse wealth effect” could exacerbate the impact of a cyclical downturn. Finally, it’s worth noting that low interest rates and high deficits reduce the weapons that the government has to mitigate any substantial market downturn.
SMAs Reflects A Conservative Asset Allocation
For all of these reasons, SMA accounts remain more defensively positioned than the benchmark (which, itself, reflects a conservative asset allocation). This is reflected in the fact that 46% of the SMA assets are currently either in cash or U.S. Treasuries with maturities less than 5 years (to mitigate against interest rate risks).
Furthermore, I continue to believe that the equity holdings include idiosyncratic value opportunities (for specific stocks) that are superior to those of the equity markets as a whole.
Accounts also remain well diversified, with no single-stock position accounting for more than 5.0% of BCM’s assets-under-management. As always, risk management and capital preservation remain paramount to the investment strategy.
Thank you to everyone for your interest and support and please let me know if there are any questions you may have that I haven’t answered.
Sincerely,
Ted Barac
Managing Member of Barac Capital Management, LLC
Appendix: About the Benchmark
As multi-asset accounts whose objective is to seek investment opportunities across different asset classes (e.g. stocks, bonds, etc.), the benchmark used for the SMAs is a mix of 60% attributed to an S&P 500 index fund (SPY) including dividends paid, and 40% attributed to the Barclays aggregate bond index fund (AGG). The S&P 500 is a commonly used index of 500 U.S. large capitalization stocks while the Barclays aggregate index is a commonly used index of U.S. high-grade bonds.
The reason for using this specific benchmark is because it is comprised of two very commonly followed indexes for the two major investment classes (stocks and bonds) in the 60%/40% ratio mix, which has been a common allocation ratio recommended for long-term investors. In addition, both of these indexes can be easily purchased through low-fee and highly-liquid index funds, providing an easy alternative for investors. Long-term outperformance versus these indexes is necessary to justify an investment with Barac Capital and, therefore, this is the yardstick to which accounts will be compared.
To be clear, the benchmark is chosen only to provide an easy and simplistic comparison to how one’s investments might have performed if invested in low-fee index funds allocated in the commonly prescribed mix of 60%/40% (equities/bonds). Barac Capital does not endorse or make any attempt to follow such an allocation and in periods when I view equities as substantially over-valued, the equity allocation may be much less than 60% and vice-versa. In addition, accounts will also hold other asset classes, outside the scope of the benchmark, which may include cash, small-cap. equities, foreign equities, and high-yield bonds, among others. Overall, the investment strategy is about finding the best value across different asset classes and geographies while sizing positions to best optimize risk/reward.
As noted, the SMA benchmark methodology is linked to low-fee index funds that track the respective indexes (as supposed to using the actual indexes themselves). I believe that using passive-index funds (instead of the actual indexes) for the benchmark more accurately reflects the actual costs of investing in a passive strategy (where there are some fees, albeit very low: 10 bps/year for SPY and 5bps for AGG).
Fund Dissolution in October of 2018
In April of 2017, Barac Capital began offering separately-managed-accounts (S.M.A.) and the offering has been very successful (with assets in these accounts growing to substantially exceed those of the Barac Value Fund, L.P.; the “Fund” or “Partnership”). I started offering the S.M.A.s in order to address some of the inherent disadvantages of a hedge fund structure. While I continue to believe that the Fund’s terms were very attractive (within the confines of a hedge fund structure), there were still a number of inherent drawbacks for many investors, including:
- Limited control (e.g. ownership of a percentage of the Fund rather than complete ownership/control of your own brokerage account);
- A lack of individual customization;
- A regulatory requirement to be an “accredited investor”;
- Contributions required in cash (potentially requiring other investment liquidations and a crystallization of capital gains);
- Limited liquidity (monthly only); and
- Partnership “K1s” for tax preparation.
Because the S.M.A. offering addressed these issues and is inherently advantageous (for investors), relative to an investment partnership, I saw little on-going incentive for an investor to choose the Fund over this alternative relationship. As such, on October 16th 2018 the dissolution of the Fund was completed and the assets of the Partnership were distributed into the S.M.A.s of the limited partners.
Importantly, the Fund was dissolved in a tax efficient manner that didn’t crystallize the unrealized gains of the Partnership (via a dissolution in-kind). The time and administrative tasks required to complete this in-kind distribution was substantial (relative to what would have been required for a liquidation), but the relative tax benefits it provided to the limited partners was well worth the effort.
The aggregate net returns (after the deduction of fees and expenses) for the Fund since inception (on July 14, 2011) to the last business day prior to dissolution (October 15, 2018) amounted to 90% on a net basis (after management fees), compared to 84% for the Partnership’s benchmark3.


