Absorbing Data And Decision Making (part 2) Here is Part 2. Part 1 was yesterday
“Davidson” submits:
Part 2:
When information is coming at investors at the pace of a fire hose it requires filtering out the wheat from the chaff. I find that employment trends and other correlated economic indicators are effective in doing this. The history of employment trends makes them reliable indicators of economic activity as does their correlationto equity prices over the long term. Employment’s non-correlation to short term market tends makes them not terribly useful for traders. It is traders who always have some action to promote on CNBC and single employment reports do not provide much that is useful.
This morning the monthly employment reports were released for April 2015. The Household Survey reported 148,523,000 employed which was 192,000 higher than March 2015-see Chart 2: Light Vehicle Sales vs. Household Survey(Employment). The acceleration in the employment trend which began early 2014(see the LIGHT BLUE ARROW) continues. Vehicle sales reported last week are holding near record levels. All is good!
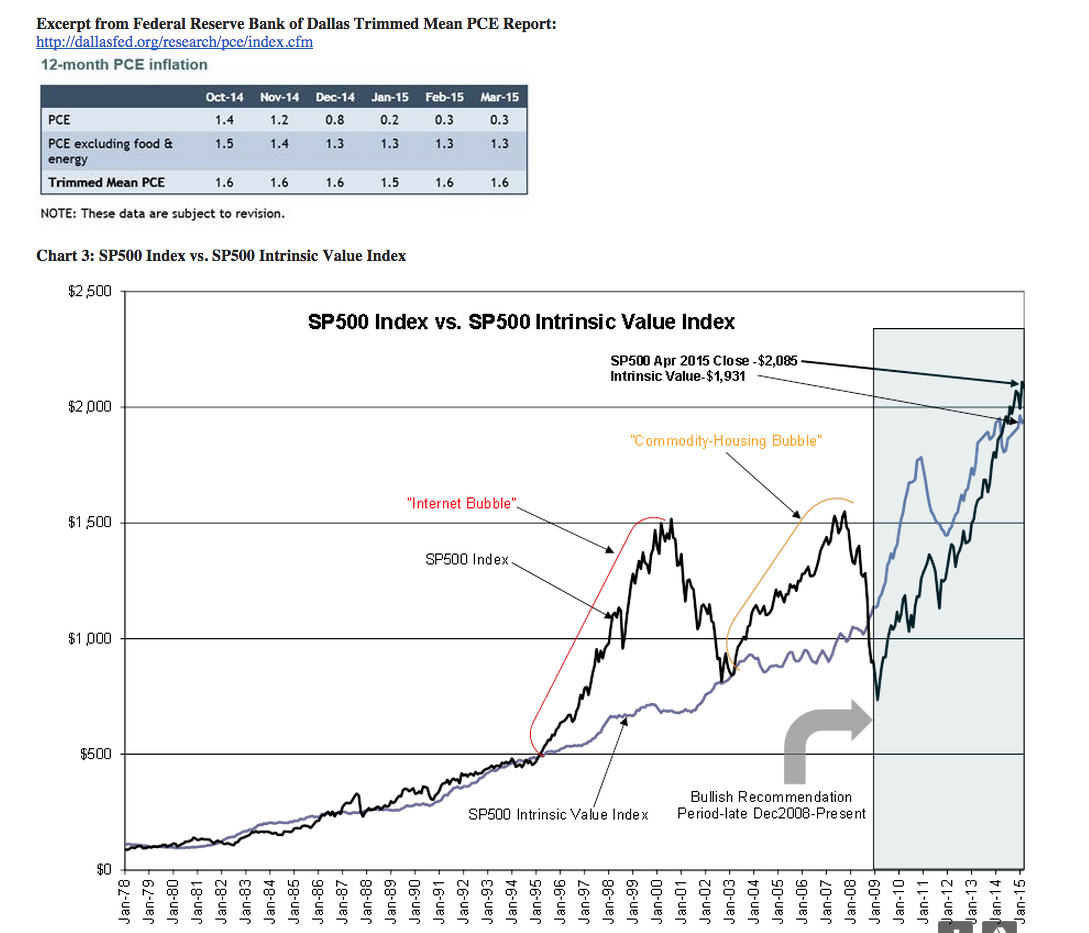
The 12mo Inflation as measured by the Federal Reserve of Dallas’s Trimmed Mean PCE was reported at 1.6%. This measure has been between 1%-2% since early 2009 and shows no sign of accelerating at this point in the business cycle-see the excerpted table below from the Dallas Fed report. It is my opinion that it was the continued low inflation coupled with Vladimir Putin’s invasion of Ukraine which sent significant foreign capital into US Treasuries which triggered a reversal of the prominently discussed ‘Hyperinflation Trade’. This resulted in a rapid decline in oil prices and a rapid rise in US$ vs. global currencies and a sharp rise in the 10yr Treasury. A shift which is likely to be temporary and one of which investors should take advantage.
The SP00 Intrinsic Value Index-see Chart 3: SP500 Index vs. SP500 ($SPY) Intrinsic Value Index, is at $1,931 vs. SP500 at ~$2,100. Even though there are numerous examples of excess pricing in stocks, the SP500 itself remains close to levels historically attractive to Value Investors. This equates to a low level of general speculation in equities. More important is the ‘Prevailing Rate” used in the calculation of the SP500 Intrinsic Value Index which remains at 4.6%. 10yr Treasuries near 2.2% remain in ‘Bubble’ territory. Over the long term, the 10yr Treasury rate has tracked the ‘Prevailing Rate’. With the current 10yr Treasury rate in the 2.2% range, investors should expect a substantial rise in long term rates which should prove very stimulating to mortgage lending. When rates rise, bond holders will suffer losses and they may exit quickly for equities which should prove to be the best alternative for positive returns. This is not likely to be a simple process. It is likely we will experience volatility along the way. But, what else is new?
Lastly, at the bottom of this note is an excerpt from the May 2015 Conference Board Help Wanted On Line report. Demand for employees continues at a strong pace. Other predictors of employment, the Gallup Job Creation Index, the ASA Staffing Index and the BLS Job Opening and Temp Help Indices, all point to higher employment the next 12mos.
Bottom Line:
When one goes through all the conflicting opinion and counter trends apparent in the ‘FOG’ of too much information, it becomes simple to see that over the long term employment trumps all indicators. If employment continues higher, so does economic activity regardless of price trends elsewhere.
Higher employment = higher equity prices
Investors should continue to focus on LgCap Domestic and Intl Equity assets and Natural Resources as offering the better Return/Risk profile in my opinion. Contact me for additional details or to discuss investments of specific interest.