
I recently saw a chart from AEI, which broke down inflation into a few components between 1997 and 2017.
Q1 2021 hedge fund letters, conferences and more
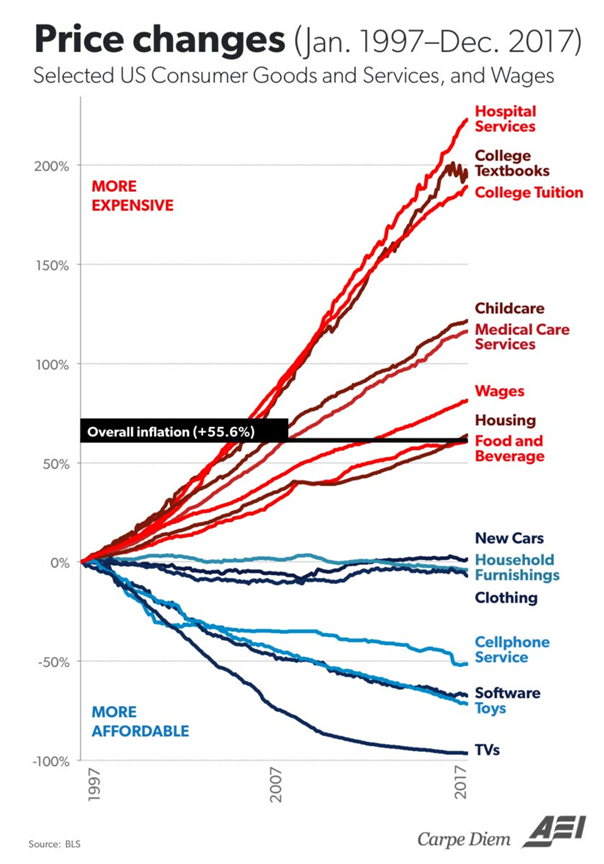
Price Changes Between 1997 And 2017
You can see that prices increased on average by 55.60% between 1997 and 2017.
Source: AEI
This picture provides an interesting perspective, because not every item you would buy actually increased at the pace of inflation that is widely quoted.
Certain items that are more labor intensive, which cannot be easily automated ended up increasing much faster than the pace of inflation. Those include healthcare, education and childcare – all very labor intensive occupations, which require some skill and are difficult to automate well. There are other issues around healthcare and education, notably the persistent demand for these services, as well as the opaque nature of the industry ( eyeing healthcare, and the way it is “broken” in the US essentially).
On the other hand, items like TV have declined in price. That’s because it is easier to automate TV production.
This is a fascinating chart to look at, because it explains to a certain degree why some folks “feel’ that inflation is higher than reported. It is very likely that the composition of your annual expenses will determine whether you experience high inflation or a low inflation. If all you spend money on is TV’s, your cost of living has declined substantially over the past 20 years. However, if you are like one of the millions who need quality healthcare, you have likely seen a large spike in your costs over the past 20 years.
It’s fascinating to think that your personal basket of goods and services will definitely impact your lifestyle cost over time. For example, for most Americans the cost of daycare and college is high, but covers only a few years ( around 4 in each, give or take). There is a clear end in sight to when your child would graduate college for example ( in most cases). It also makes planning for retirement that much more challenging, because it entails forecasting expenses that are not a major component of your inflation basket today.
A Good Inflation Hedge
Owning productive assets such as equities provided a very good inflation hedge over the past 20 years. I used S&P 500 as a proxy for a diversified dividend growth portfolio, since data on S&P 500 is readily available.
| Year | Earnings Per Share | Dividends Per Share | Price |
| 1995 | 33.96 | 13.79 | 615.93 |
| 1996 | 38.73 | 14.90 | 740.74 |
| 1997 | 39.72 | 15.49 | 970.43 |
| 1998 | 37.71 | 16.20 | 1229.23 |
| 1999 | 48.17 | 16.69 | 1469.25 |
| 2000 | 50.00 | 16.27 | 1320.28 |
| 2001 | 24.69 | 15.74 | 1148.08 |
| 2002 | 27.59 | 16.08 | 879.82 |
| 2003 | 48.86 | 17.39 | 1111.92 |
| 2004 | 58.50 | 19.44 | 1211.92 |
| 2005 | 69.93 | 22.22 | 1248.29 |
| 2006 | 81.51 | 24.88 | 1418.30 |
| 2007 | 66.18 | 27.73 | 1468.36 |
| 2008 | 14.88 | 28.39 | 903.25 |
| 2009 | 50.97 | 22.41 | 1115.10 |
| 2010 | 77.35 | 22.73 | 1257.64 |
| 2011 | 86.95 | 26.43 | 1257.60 |
| 2012 | 86.51 | 31.25 | 1426.19 |
| 2013 | 100.20 | 34.99 | 1848.36 |
| 2014 | 102.40 | 39.44 | 2058.90 |
| 2015 | 86.53 | 43.39 | 2043.94 |
| 2016 | 94.55 | 45.70 | 2238.83 |
| 2017 | 109.88 | 48.93 | 2673.61 |
| 2018 | 132.39 | 53.75 | 2506.85 |
| 2019 | 139.47 | 58.24 | 3230.78 |
| 2020 | 94.13 | 58.28 | 3756.07 |
Dividends did a pretty decent job in providing a good inflation hedge.
The S&P 500 paid $14.90 in dividends in 1996 and $15.49 in 1997. The annual dividends kept growing to $48.93 in 2017, for an over 228% increase.
The index earned $38.73 in 1996 and $39.72 in 1997. S&P 500 grew earnings to $109.88 in 2017 for a 183% increase.
The S&P 500 index closed at 740.74 at the very end of 1996, and went all the way up to 2673 by the end of 2017, for a 260% increase.
I could have used a combination from any of the large cap dividend growth stocks like PepsiCo, Johnson & Johnson, Procter & Gamble etc, and reached similar conclusions that dividends generated from diversified portfolios tend to grow above the rate of inflation over time.
Relevant Articles:
- Inflation Proof your income in retirement with Dividend Stocks
- Dividend Stocks for Inflation Adjusted Income Stream
- Dividend Growth Stocks Protect Investors from Inflation
Article by Dividend Growth Investor


