
2017 saw investors once again leaving traditional active managers and turning to passive investments, mostly ETFs. Not just any ETFs, either. Investors piled cash into the cheapest, simplest, broadest ETFs, suggesting that the era of the 10 basis point portfolio has arrived.
[REITs]A few headline statistics tell the story:
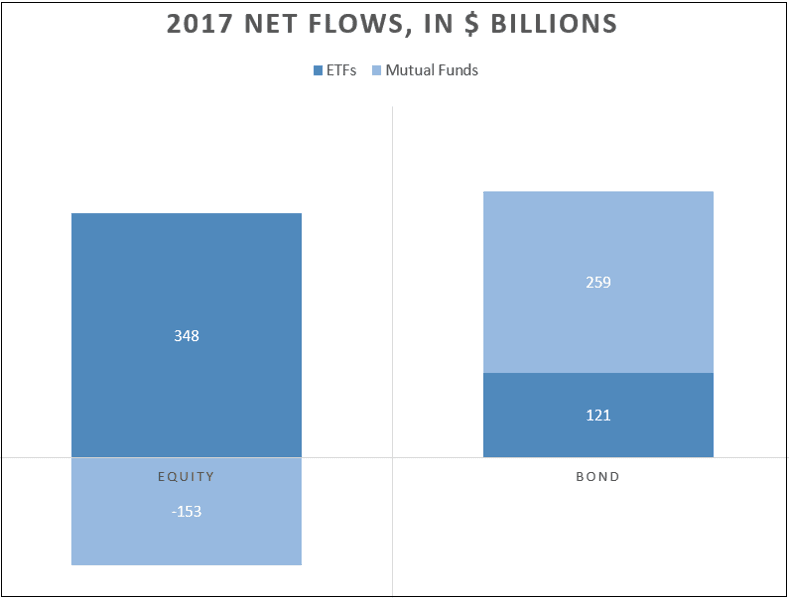
- Passive: Equity mutual funds lost $153 billion in outflows in 2017, while equity ETFs picked up $348 billion.
- Cheap: ETFs that gained market share cost 0.19% per year, on an asset-weighted basis, while losers cost 0.26%.
- Simple: Vanilla funds—funds that select every fund in a market segment, and cap-weight them—increased market share by 1.2%, or $373 billion.
- Broad: Core building blocks—vanilla funds in broad segments—captured 54% of flows, on a base of 40% of the AUM.
The 2017 trend is clear: U.S. investors in publicly available funds are voting with their dollars, prizing passively managed, cheap, simple, and broad exposure in their ETF selections. This lends itself to building portfolios with just a handful of ETFs. Therefore, investors were the big winners in 2017, as they reduced costs and complexity in their portfolios, while increasing transparency and tax efficiency. It’s as if investors collectively said, “Portfolio construction solved!”
The picture isn’t uniformly grim for asset managers who offer complex or tactical strategies. There are pockets of investor interest, especially for active management in the ETF space. Even among the market share disaster that befell smart beta funds, a few strategies increased their footprint. In addition, many funds that lost market share nonetheless enjoyed positive flows.
Data Backs Up ETF Headlines
The Investment Company Institute’s 2017 data tells a clear tale: disinvestment in equity mutual funds in favor of ETFs, gain of market share for bond ETFs. The first chart shows net 2017 flows in dollars; the second shows them as a share of AUM at the start of the year.

To compound the trouble for mutual funds (or at least for active management) there is increasing evidence that more than half of the bond mutual fund inflows went to Vanguard’s passively-managed funds. Despite inflows to bond funds, ICI’s count dropped from 2,183 bond mutual funds to 2,149 from November 2016 to November 2017, a 1.5% reduction. In contrast, the number of fixed income ETFs increased by 10.7% in 2017.
As the charts above make clear, ETFs (99% of which are passive by AUM) are taking in money far faster than mutual funds are losing it. Cost may well be the driving factor, especially in the shadow of the Department of Labor’s Fiduciary Rule.
ETFs are famously cheap. As of the end of 2017, the asset-weighted expense ratio for all U.S.-domiciled ETFs was 0.23%. Actively managed mutual funds cost 0.80% on an asset-weighted basis as of the end of 2016, according to the ICI.
The cost comparison becomes even clearer when broken down by asset class. Equity ETFs are nearly one-fourth the cost of actively managed mutual funds; bond funds nearly one-third.
| Asset Class | ETF (2017) | Actively-managed Mutual Fund (2016) |
| Equity | 0.21% | 0.82% |
| Fixed Income | 0.21% | 0.58% |
| Commodities | 0.48% | |
| Geared | 1.11% | |
| Alternatives | 0.90% | |
| Asset Allocation | 0.67% | |
| Currency | 0.42% | |
| Total | 0.23% |
Once year-end 2017 ICI data becomes available, we might see mutual fund costs drop a bit, as they have done every year since 2003. Recent annual drops have been between 0.01% and 0.02%. That’s nowhere near enough to achieve cost-competitiveness.
Cheap, Vanilla Funds Won in 2017
Within the ETF world, costs continue to fall, as this year’s revived price wars attest. Last year, ETF investors flocked to low-cost funds and spurned higher-cost funds. Funds that could not compete closed, leaving higher costs in the ETF dustbin. ETF investors are now demanding price tags of 20 basis points or less. In some cases, much less.
Here’s how fee compression worked in the ETF landscape in 2017, by asset class. The table below shows asset-weighted average expense ratios by asset class, using fees and AUM as of December 29, 2017, except for funds that closed during 2017, for which data is as of the end of 2016.
| Asset Class | Gainers | Losers | No Competition | Closed |
| Equity | 0.17% | 0.24% | 0.45% | 0.51% |
| Fixed Income | 0.15% | 0.24% | 0.24% | 0.32% |
| Commodities | 0.47% | 0.47% | 1.24% | 0.67% |
| Geared | 1.12% | 1.08% | 1.28% | 0.77% |
| Alternatives | 0.86% | 0.92% | 0.47% | |
| Asset Allocation | 0.55% | 0.80% | 1.00% | |
| Currency | 0.42% | 0.41% | 0.43% | |
| Total | 0.19% | 0.26% | 0.34% | 0.42% |
The data above suggests that asset managers who wish to attract share in the ETF marketplace can take one of two paths: find a segment without competition or prepare to compete hard on price. Right now, the magic number is 15 basis points in equity and fixed income—that’s 99% of the ETF market, by assets. In some segments, the magic number is lower still.
In 2017, just 26 funds (1%) captured 50% of the inflows. By year-end, the median expense ratio for that elite set was just seven basis points.
In the 10 segments that garnered the highest flows, funds that gained market share cost 10 basis points on average, while losers cost 19. These segments hold 65% of all U.S. ETF assets.
| Segment | Gainers | Losers |
| Equity: U.S. – Total Market | 0.16% | 0.14% |
| Equity: U.S. – Large Cap | 0.07% | 0.15% |
| Equity: U.S. – Mid Cap | 0.12% | 0.24% |
| Equity: U.S. – Small Cap | 0.09% | 0.21% |
| Equity: Developed Markets Ex-U.S. – Total Market | 0.09% | 0.33% |
| Equity: Emerging Markets – Total Market | 0.18% | 0.35% |
| Equity: Global Ex-U.S. – Total Market | 0.26% | 0.17% |
| Fixed Income: U.S. – Corporate Investment Grade | 0.19% | 0.15% |
| Fixed Income: U.S. – Corporate Investment Grade Intermediate | 0.09% | 0.17% |
| Fixed Income: U.S. – Broad Market Investment Grade | 0.05% | 0.05% |
Within market segments, ETFs compete on strategy. FactSet recognized four major strategy groups: vanilla, strategic, idiosyncratic, and active. Vanilla funds are the simplest, selecting all securities within the opportunity set and weighting them by market cap. Strategic funds, sometimes called smart beta, select and weight securities using academically-researched economic criteria. Idiosyncratic funds use non-economic criteria to build an index. Finally, active funds have humans at the helm.
In 2017, vanilla ETF’s market share increased, while strategic funds lost the most ground. In segments where strategies go head-to-head for investor dollars, vanilla funds took in $15.8 billion more than their starting market share would have projected; strategic funds lost $19.3 billion of flow opportunity.

While overall flows to all strategies were positive, growth rates were uneven. Actively managed funds posted the highest growth rate, increasing assets by $3.8 billion more than their starting 1.1% market share would have predicted.
Active management’s fast growth in the ETF space owes much to the strategy’s small overall footprint. By the end of 2017, active ETF AUM was at $44.7 billion, or 1.3% of ETF AUM. Rapid growth, with flows of $15.5 billion, gained actives an overall .2% of market share. Active funds picked up the most speed in commodities and alternatives, but the dollar gap was largest in equity, especially in the master limited partnership space.
By contrast, vanilla funds added $373.2 billion, to a year-end market share of 72.4% of assets, which fed a 1.2% market share gain. Even with the extraordinary growth rate for active funds, vanilla saw the largest increase in market share.
As investors left more expensive and complex passive strategies behind, the worst hit were currency-hedged strategic beta funds, which suffered $2.46 billion in outflows. Their vanilla competitors fared better, with $2.9 billion of inflows—positive results, but far short of the $9.3 billion they would pull in if every fund grew evenly. Currency hedging was simply out of fashion in 2017. Optimized commodity funds fared no better, shedding $918 million of assets over 2017.
In contrast, some of the newer strategies gained market share. On a dollar basis, multi-factor and momentum funds increased their market shares by $2.8 and $2.5 billion, respectively. Momentum funds also showed a high rate of market share increase. Various types of hedging (buy-writes, duration-hedging, and volatility-hedging) also kicked up their market shares, an oddity in a year of increasing and calm equity and bond markets. These pockets of successes in smart beta, along with active management, offered hope to those rooting for complex strategies in the ETF space in an environment that favors simplicity.
Simplicity was in style at the portfolio level, too. In 2017, ETF investors favored basic portfolio building blocks—stock or bond ETFs with a wide geographic mandate, that cover the majority of the investible landscape. In other words, broad vanilla exposures like U.S., developed, emerging markets equity, or U.S. investment grade bonds gained ground over tactical exposures like sector funds, commodities, or high-yield bond ETFs. Cash-equivalents also increased their market share—capturing 2.1% of net flows, despite starting the year at only 0.5% of ETF AUM.
The table below shows the ratio of the percent of net 2017 flows captured to market share as of December 31, 2016, along with the asset-weighted expense ratio (as of December 29, 2017).
| Net Flows ($ Billions) | Flows / 2016 AUM | Expense Ratio | |
| Core | 259.4 | 1.4 | 0.12% |
| Tactical | 155.2 | 0.8 | 0.39% |
| Style Box | 52.8 | 0.6 | 0.16% |
| Cash | 10.1 | 4.1 | 0.23% |
The logical conclusion is that U.S. investors are building portfolios with a handful of cheap, broad, vanilla ETFs. Pretty much everything else is losing market share, except for cash equivalents.
New Year Celebration
U.S. investors have plenty to celebrate, as do top-asset-gatherer issuers BlackRock, Vanguard, SSGA, and Charles Schwab, who jointly took in 87% of 2017 ETF net flows. This symbiotic relationship serves both well —investors get cheap, easy-to-understand, manageable portfolios, while the asset managers run a volume business that can scale, supporting low margins.
One wonders what will become of the mutual fund managers and purveyors of complex, expensive ETF strategies. Will they continue to launch new ETFs, buoyed by one-off success stories of tactical funds like VanEck Vectors J.P. Morgan EM Local Currency Bond ETF (EMLC-US), and ROBO Global Robotics and Automation Index ETF (ROBO-US)? Will the sizable inflows to actively managed equity ETFs like First Trust North American Energy Infrastructure Fund (EMLP-US) encourage more the old-line active mutual fund providers to give the ETF space a try? Will the dollars flowing to iShares Edge MSCI USA Momentum Factor ETF (MTUM-US) and Goldman Sachs ActiveBeta U.S. Large Cap Equity ETF (GSLC-US) convince asset managers to continue to support strategic beta strategies?
Perhaps some will make the leap, hoping to beat the odds laid down by the cheap, simple, core strategies that dominated 2017. Others might decide that a small ETF footprint is better than none, and take the plunge. But sooner or later, all must compete against the simple, core, passive strategies that cost practically nothing, or move on to solve different kinds of financial problems. Anyone want to take on the savings rate?
Article by Elisabeth Kashner, FactSet


