The inflationary cauldron continues to boil. However, the USDX and Treasuries are undervalued relative to U.S. GDP growth prospects. What’s going on?
Q1 2021 hedge fund letters, conferences and more
The Rising Tide of Inflation
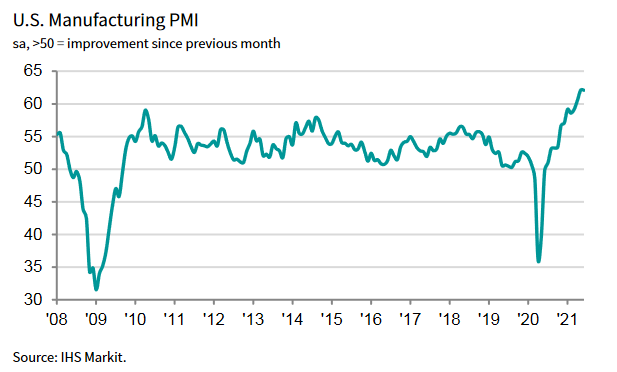
While investors are all-in on the U.S. Federal Reserve’s (FED) “transitory” narrative, the inflationary cauldron continues to boil. Case in point: the IHS Markit released its manufacturing PMI on Jul. 1 and the report read that “June PMI data from IHS Markit signaled the joint-fastest improvement in the health of the U.S. manufacturing sector on record.”
Please see below:
Moreover, demand remained resilient:
“New orders growth remained substantial in June, despite the rate of expansion easing from May’s historic high. The pace of increase was the second-fastest on record, with firms continuing to note marked upturns in demand from both new and existing clients.”
More importantly, though:
“Suppliers’ delivery times lengthened to the greatest extent on record in June, as component shortages and transportation issues exacerbated supply-chain woes. Subsequently, vendors hiked their charges. Input costs rose at the fastest pace since data collection for the series began in May 2007 , as greater global demand for inputs put pressure on material shortages. Manufacturers were able to partially pass on higher costs to clients, however, as the rate of charge inflation matched May’s historic peak .”
Please see below:
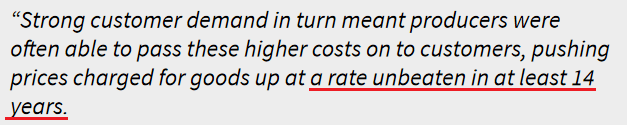
Source: IHS Markit
On top of that, the J.P.Morgan Global Manufacturing PMI (also released on Ju1. 1) had a similar message:
Source: IHS Markit, J.P. Morgan
Thus, while FED Chair Jerome Powell told Congress on Jun. 22 that the U.S. economy “is still a ways off” and that “we will not raise interest rates preemptively because we fear the possible onset of inflation., we will wait for evidence of actual inflation or other imbalances:”
- The FED increased its 2021 real GDP growth forecast from 6.5% to 7.0% on Jun. 16.
- The headline Personal Consumption Expenditures (PCE) Index rose by 3.91% year-over-year (YoY) on Jun. 25 and came in ahead of the FED’s revised forecast of 3.4%.
The bottom line? Powell’s gambit is a classic case of ‘do as I say, not as I do.’
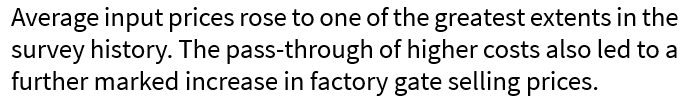
To that point, The International Monetary Fund (IMF) raised its 2021 U.S. GDP growth forecast from 4.6% to 7.0% on Jul. 1 (pending the passage of U.S. President Joe Biden’s recent infrastructure package).
Please see below:
Source: Reuters
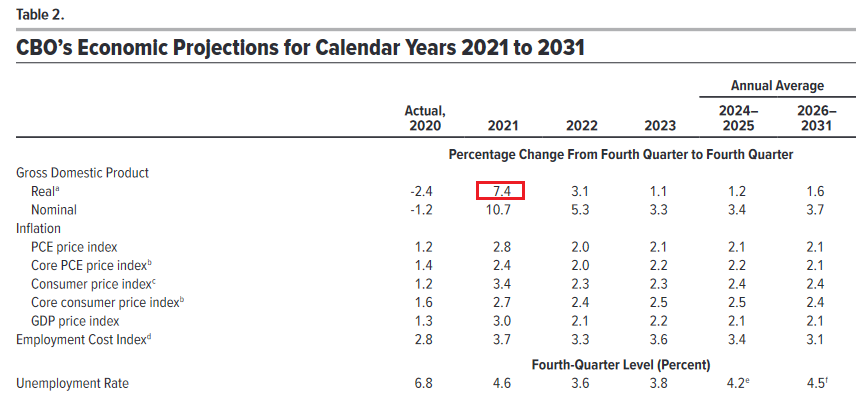
Similarly, The U.S. Congressional Budget Office (CBO) doubled its 2021 U.S. GDP growth forecast on Jul. 1. Excerpts from the report read:
“As the pandemic eases and demand for consumer services surges, real (inflation-adjusted) GDP is projected to increase by 7.4% and surpass its potential (maximum sustainable) level by the end of 2021.
In CBO’s projections, employment grows quickly in the second half of 2021 —reflecting increased demand for goods and services and the waning of factors dampening the supply of labor, including health concerns and enhanced unemployment insurance benefits.”
In addition, the group’s “PCE price index” forecast of a 2.8% YoY rise is still too low, and forthcoming prints will likely surprise to the upside.
Please see below:
Source: CBO
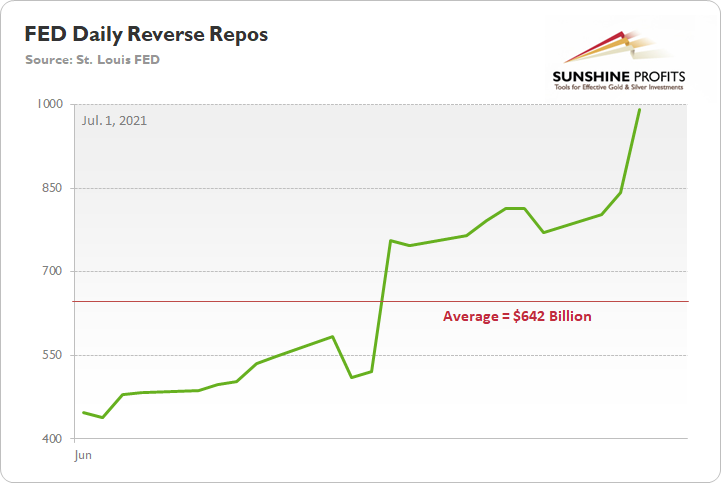
Piecing it all together: with economic growth projected to reach the levels last seen in 1984, does the FED need to purchase a combined $120 billion worth of Treasuries and mortgage-backed securities per month? As a reminder, the FED’s daily reverse repurchase agreements averaged $642 billion in June and the transactions essentially negated 5.35 months’ worth of QE in the last month alone. However, the psychological effect isn’t the same as an actual taper announcement.
Please see below:
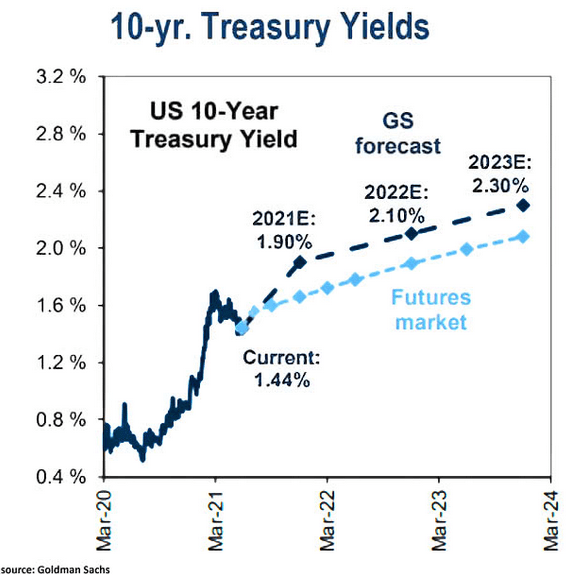
The U.S. 10-Year Treasury Yield
On top of that, the last time U.S. economic growth hit 7%, the USD Index and the U.S. 10-Year Treasury yield reached highs of 151 and 11% respectively. And while similar strength is unlikely to emerge this time around, it’s still a reminder of how low the pair’s current readings are relative to the prospective GDP growth.
To that point, while the long-end of the U.S. yield curve remains in its own little world, Goldman Sachs expects the U.S. 10-Year Treasury yield to end 2021 at 1.90% (roughly 44 basis points higher than the Jul. 1 close).
Please see below:
Likewise, Robin Brooks, chief economist at the Institute of International Finance (IIF), predicts that the U.S. cocktail of growth and inflation should result in higher long-term interest rates in the coming months.
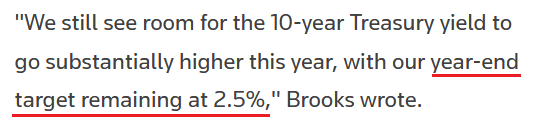
Source: Reuters
As further evidence, following the spike in the headline PCE Index on Jun. 25, the U.S. 10-Year Treasury yield is now trading at its lowest level relative to realized inflation since the mid-1970s.
Please see below:
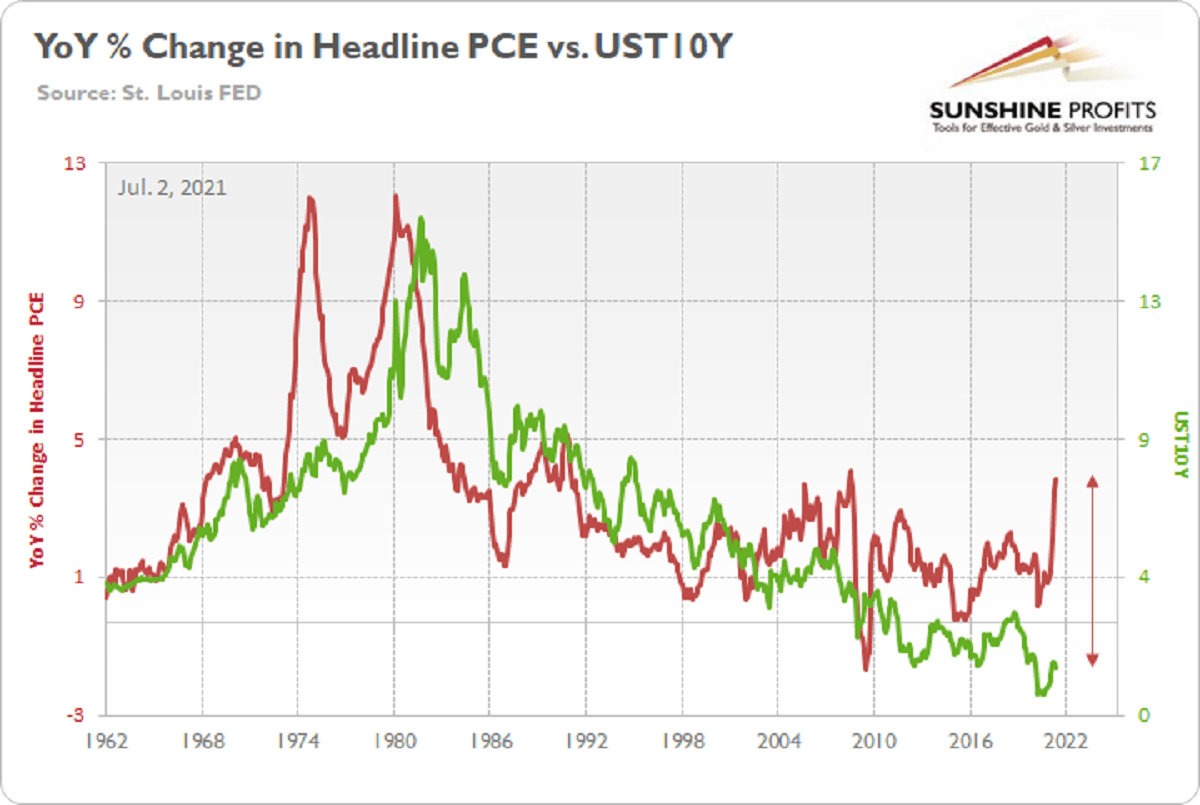
To explain, the green line above tracks the U.S. 10-Year Treasury yield, while the red line above tracks the YoY percentage change in the headline PCE Index. If you analyze the relationship, it’s been nearly 50 years since the U.S. 10-Year Treasury yield has underperformed to this degree. As a result, while the front-end of the U.S. yield curve (2s, 3s, 5s) is destined to move higher as the taper talk heats up, participation from the long-end (10s, 20s, 30s) will only add to the PMs’ ills.
The USD Up, the EUR Down
Furthermore, with the FED’s hawkish shift lighting a fire under the greenback, U.S.-Eurozone growth differentials should also propel the USD Index higher over the medium term. For context, the EUR/USD accounts for nearly 58% of the movement of the USD Index.
To that point, I warned on Apr. 8 that a shift in the central bank sentiment would uplift the U.S. dollar over the medium term.
I wrote:
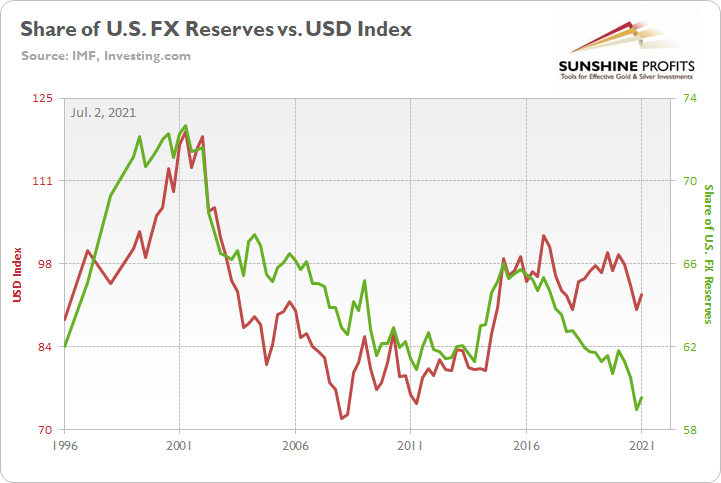
On Mar. 31, the International Monetary Fund (IMF) released its fourth quarter Currency Composition of Official Foreign Exchange Reserves (COFER). The U.S. dollar’s fourth-quarter share of allocated FX reserves fell to its lowest level since 1995, and coincidentally, the USD Index often tracks global central banks’ net-purchases of U.S. dollars (25-year correlation of 0.70).
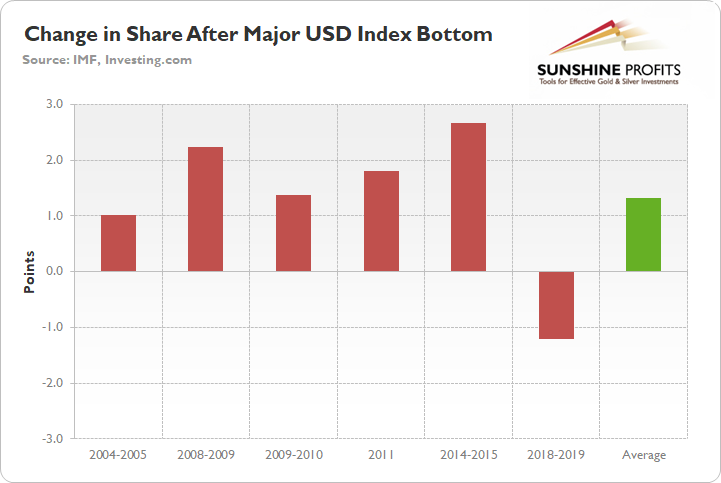
And with a current reading of 59%, you may be thinking: the ‘death of the dollar’ is unfolding before our eyes. Keep in mind though: global central banks often behave like average investors. Meaning? They buy after an uptrend is already in place. Case in point: since 1995, 83% of major USD Index bottoms were followed by an increase in allocated FX reserves . For context, the largest increase occurred from 2014 to 2015 (2.67%), while the lone decrease occurred from 2018 to 2019 (– 1.21%).
Please see below:
In addition, because the current reading of 59% is 1.70 standard deviations (SD) below the 25-year average, there is a ~4.5% chance that dollar-share declines in the coming months and a ~95.5% chance that dollar-share increases (applying standard normal probabilities).
Fast forward to the present, and the IMF announced on Jun. 30 that the U.S. dollar’s share of allocated FX reserves increased from 58.94% to 59.54%.
Please see below:
In addition, I warned that the euro would likely head in the opposite direction:
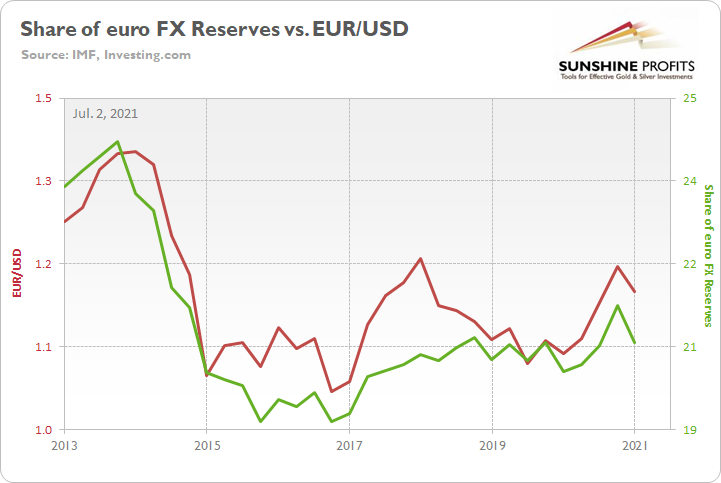
The euro is another critical component. Following the same script, global central banks often buy the euro after it rises and sell the euro after it falls. More importantly though, euro-share has a seven-year correlation of 0.92 with the EUR/USD . For context, euro-share is currently 0.30 SD above its seven-year average, which implies a ~62% chance of moving lower in the coming months.
And surprise, surprise, the euro’s share of allocated FX reserves decreased from 21.29% to 20.57%.
Please see below:
The bottom line?
While central banks have warmed up to the U.S. dollar once again, its current share of allocated FX reserves is still 1.53 SD below its 25-year average (which implies a ~93.7% chance of moving higher). Thus, if the momentum continues, it could add to the PMs selling pressure in the coming months.
Nonfarm Payrolls Incoming!
Finally, with U.S. nonfarm payrolls scheduled for release today, I noted that outperformance likely won’t materialize until August or September. However, with initial jobless claims (released on Jul. 1) coming in better than expected – at 364,000 vs. 390,000 expected – the U.S. Department of Labor (DOL) revealed that “this is the lowest level for initial claims since March 14, 2020, when it was 256,000.”
Please see below:
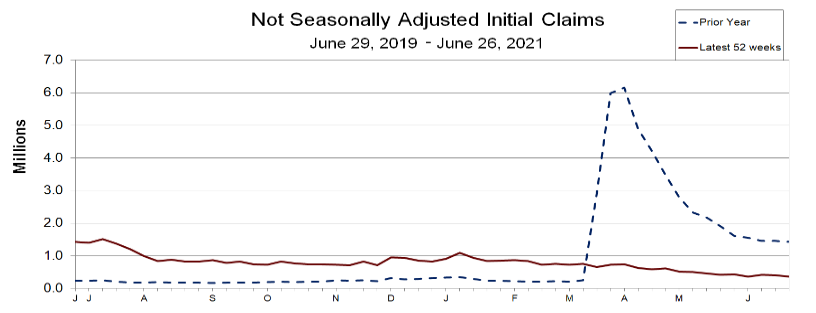
Source: DOL
And while it’s more of a wild card at this point, U.S. nonfarm payrolls have been lagging behind the recent decline in initial claims.
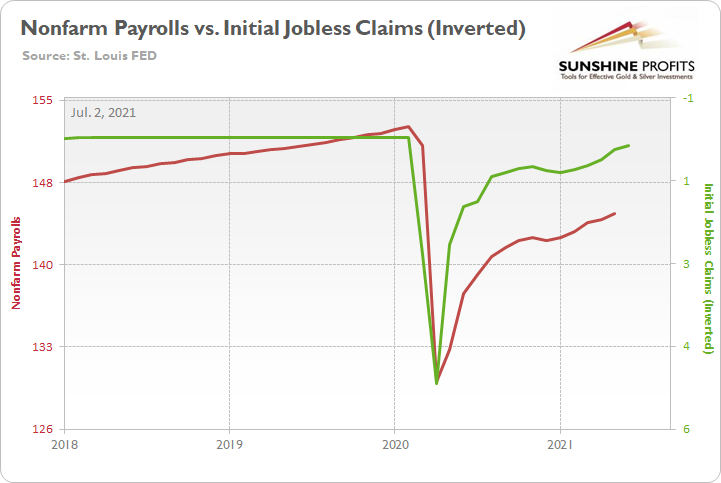
To explain, the red line above tracks U.S. nonfarm payrolls, while the green line above tracks inverted initial jobless claims. For context, inverted means that the latter’s scale is flipped upside down and that a rising green line represents falling initial jobless claims, while a falling green line represents rising initial jobless claims. If you analyze the relationship, you can see that U.S. nonfarm payrolls have some catching up to do. Thus, while we don’t expect any substantial progress until August or September, a strong print for June would serve as a pleasant surprise.
In conclusion, the PMs remain range-bound, as they debate whether the next catalyst will be bullish or bearish. However, with U.S. economic growth poised to outperform in the coming months, not only are the USD Index and Treasury yields (both long and short) undervalued relative to U.S. GDP growth prospects, but inflation is surging, and a forthcoming taper should only add to their upward momentum. As a result, the medium-term outlook remains bearish for the precious metals market, even though the long-term outlook is bullish.
Thank you for reading our free analysis today. Please note that the above is just a small fraction of today’s all-encompassing Gold & Silver Trading Alert. The latter includes multiple premium details such as the targets for gold and mining stocks that could be reached in the next few weeks. If you’d like to read those premium details, we have good news for you. As soon as you sign up for our free gold newsletter, you’ll get a free 7-day no-obligation trial access to our premium Gold & Silver Trading Alerts. It’s really free – sign up today.
Przemyslaw Radomski, CFA
Founder, Editor-in-chief
Sunshine Profits: Effective Investment through Diligence & Care
All essays, research and information found above represent analyses and opinions of Przemyslaw Radomski, CFA and Sunshine Profits’ associates only. As such, it may prove wrong and be subject to change without notice. Opinions and analyses are based on data available to authors of respective essays at the time of writing. Although the information provided above is based on careful research and sources that are deemed to be accurate, Przemyslaw Radomski, CFA and his associates do not guarantee the accuracy or thoroughness of the data or information reported. The opinions published above are neither an offer nor a recommendation to purchase or sell any securities. Mr. Radomski is not a Registered Securities Advisor. By reading Przemyslaw Radomski’s, CFA reports you fully agree that he will not be held responsible or liable for any decisions you make regarding any information provided in these reports. Investing, trading and speculation in any financial markets may involve high risk of loss. Przemyslaw Radomski, CFA, Sunshine Profits’ employees and affiliates as well as members of their families may have a short or long position in any securities, including those mentioned in any of the reports or essays, and may make additional purchases and/or sales of those securities without notice.


