RGA investment Advisors commentary for the year ended December 31, 2018, titled, “Easy Come, Easy Go”.
As the saying goes, markets go up on an escalator, down on an elevator. January 2018s smooth escalator ride higher was more than outweighed by December’s swift elevator ride lower. In hindsight, the culmination of the January ascension in February’s storm of volatility was a precursor of what was to come. The Old Wall Street rules dictate that a 20% rise from lows in markets is a “Bull Market” while a 20% fall from highs marks a “Bear Market.” By that token, we had been in a relentless “Bull Market” since March of 2009, what many call the “longest on record.” As the saying goes, “all good things must come to an end.” The final nail to the post-Financial Crisis Bull came on Christmas Eve, 2018 when the S&P hit an intraday low that was 20% off highs.

Q3 hedge fund letters, conference, scoops etc
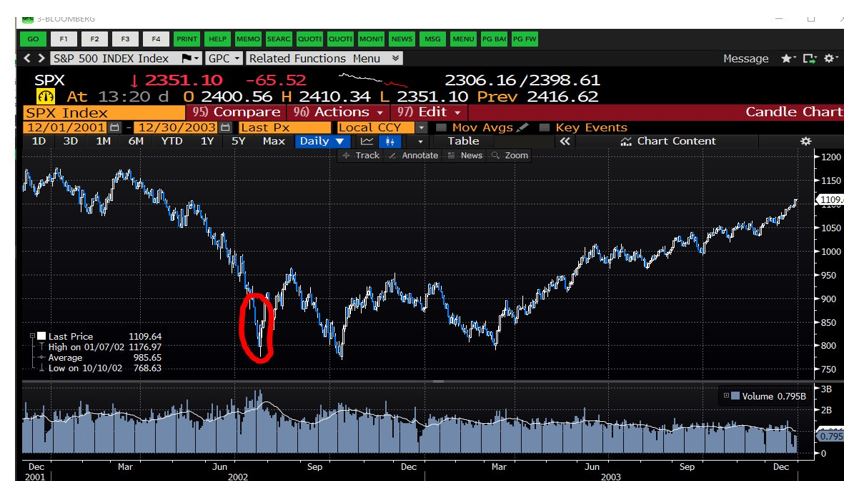
During the fourth quarter we saw historically bad stock market performance stack up on several timeframes. This was amongst the dozen worst quarters ever for markets, with December ranking as the worst December. Included in this mess was a four day stretch of the S&P registering consecutive 1.5% down days, which according to Bespoke Investment Group only happened twice outside of the Great Depression.[1] Looking at lists that stack up the “badness” of this period is a history in true economic chaos featuring the Great Depression, the 1987 crash, the Iraqi invasion of Kuwait, the popping of the Dot Com bubble and the Great Financial Crisis. 1987 is very similar in terms of the prevailing economic conditions with a benign US economic outlook amidst turbulent geopolitical tensions and valuations on the high side of their longer-term ranges. The look of things and the extent of the washout though looks most similar to 2002:
Essentially 2002 was a three-month waterfall. The big difference is how in 2002 the fears at the time were far more severe than we are seeing today. Here’s one such warning during 2002’s bear market
In 1998 it was somebody else’s problem, with their blood splashing on our trousers,” he said. “This time we’re ankle deep in our own blood.” Unlike 1998, the current crisis is rooted in the United States. It’s our stock market bubble that popped. The United States was attacked, and our CEOs cooked the books. In 1998, U.S. investors were staring out at the world and wondering where it would end. Now the world’s investors are staring at the United States and wondering the same thing.
Griffin can imagine, he said, a Japanese-style pullback from risk in the United States, in which investors give up, banks refuse to lend and the economy languishes. He can imagine other countries, accustomed to the United States’ role as the world’s economic locomotive, not taking up the standard. He can imagine a crisis of capitalism of a 1930s order. Griffin thinks the people talking about deflation are probably wrong, but he doesn’t think they’re crazy.[2]
As we all now know, 2002 was merely the warning shot and the deflationary shock came before the decade ended.
A contrast with our expectations:
Our preview for 2018 featured a few appropriate points, but more wrong ones. The appropriate ones remain applicable and we will start there (we will spare you any Bitcoin here this year). First, it was clear that the returns from 2017 were the “pulling forward” of future returns. The year was simply too good to be repeatable. In 2013, when we issued a similar warning, we emphasized that the pulling forward of returns can resolve either with sideways action or downside. Despite this call as 2018 began, we were hardly saddened to see the year on track for a back-to-back repeat of strength through September. This was before Mr. Market suddenly hammered home the idea that a pulling forward of returns can also be corrected with swift downside, in addition to extended sideways stretches.
We were especially wrong on three big things: the slope of the yield curve, the outlook for financials and the reemergence of dispersion. It turns out all three of these expectations were correlated with one another. If you were to look at the yield curve from the day the S&P made its all-time high, the expectation of more slope was mixed: inside of three years there was a steepening but the long end had flattened.
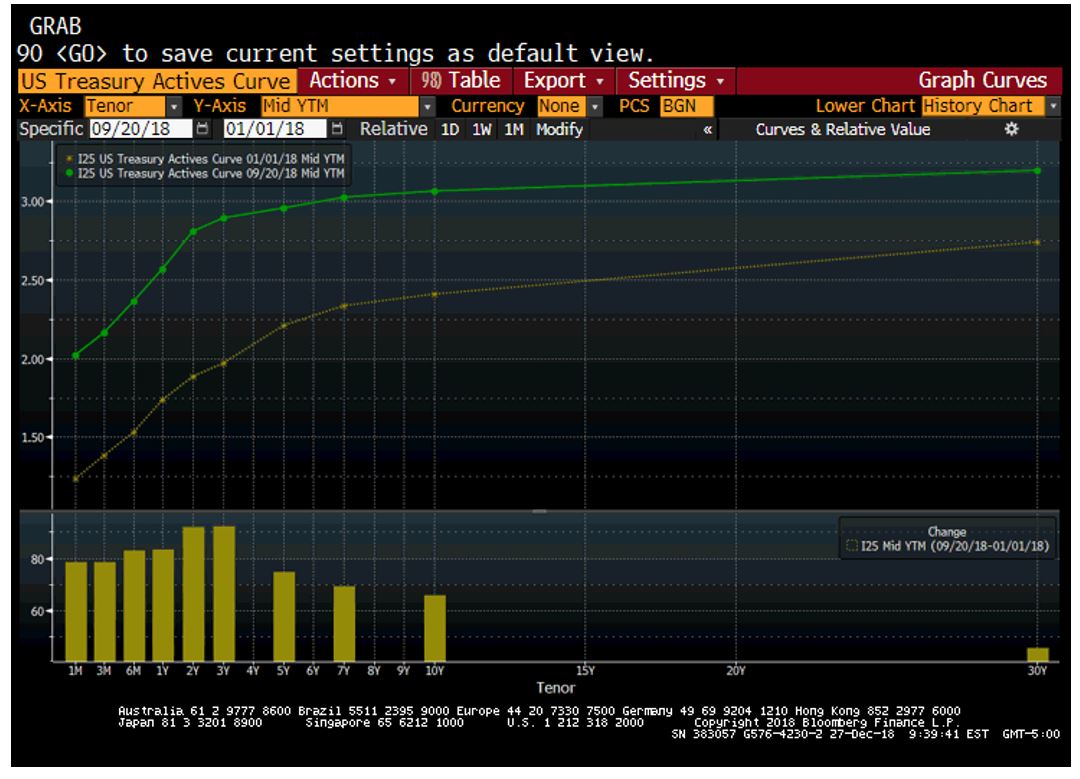
The 10-year is the level to which a considerable amount of corporate and household lending activity is tied. In the week after markets peaked, the 10-year made new highs. When equities bounced again in November, there was yet another new high in the 10-year yield, over 3.25%. This was the highest 10-year yield since 2011! At the time, banks were exhibiting considerable relative strength to the rest of the market, despite a weak year-to-date showing. As the selloff in equities escalated, the main cause was attributed to rising bond yields. We got headlines like “Here’s why stock-market investors suddenly freaked out over rising bond yields this week” which raised the prospect that Fed rate hikes Fed might push us into recession sooner than feared.[3] Interestingly, through it all, credit spreads remained firm. Later in the quarter, credit yields gave way to market pressures; however, despite the worst peak to trough market move in a decade, credit spreads remained within normal bounds and well below the scarier tumult of the winter of 2016.
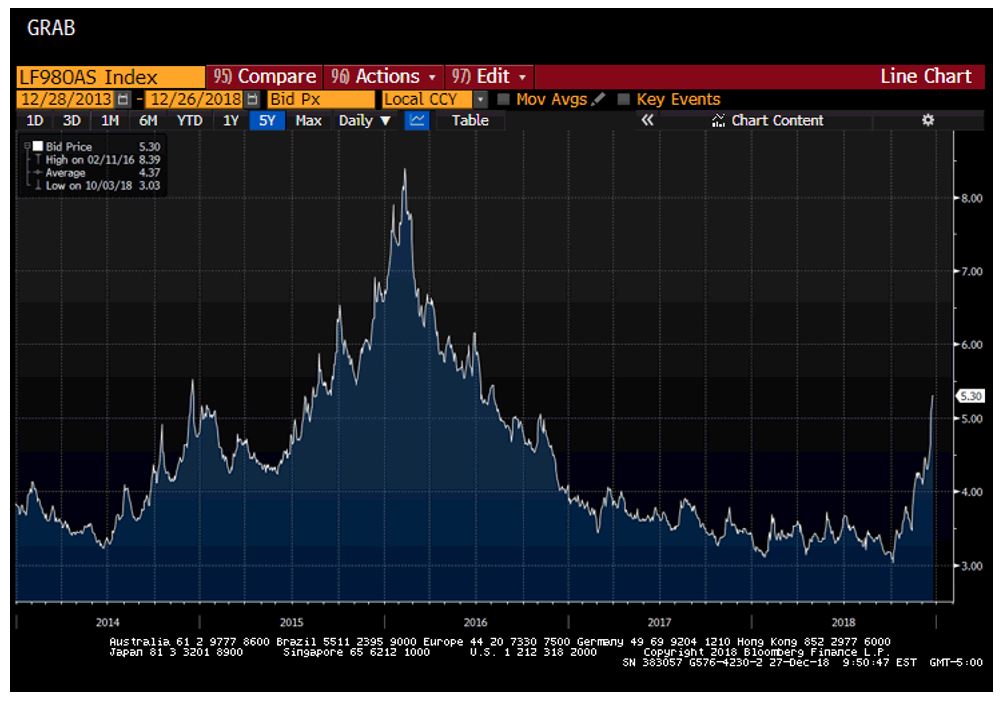
The context here is helpful. While credit has hardly performed well lately, markets went from incredibly narrow spreads to modestly wide ones. We are well within the “comfortable” zone. It would however be supportive to see the direction of change stop worsening and start improving. Markets grasp onto directional change and sentiment tends to extrapolate momentum.
Housing-"The Scene of the Crime"
The rate narrative and its tie to financials is important for housing–one of the key sectors driving our economic cycle. Housing was the economic “scene of the crime” last decade and while the fundamental backdrop is drastically different today, investors tends to anchor to the past risk in hunting for future risk. While the market down move started this quarter with the spike in rates, the pressure accelerated with the late October release of poor September home sales data.[4]
Several prevailing narratives emerged with respect to housing affordability:
- Rising rates made mortgage interest a bigger burden for prospective purchasers.
- Years of upward momentum in Case-Shiller, especially in areas with job growth kept younger would-be purchasers sidelined
- Tightness in labor markets pushed up the key input cost for homebuilders (40-45% of input cost) leaving the builders in a position of either needing to sacrifice margin or pass on costs
The affordability problem amidst a backdrop of accelerating wage growth is a challenging cross-current for analyzing this key economic sector. For example, the low end of the housing market had been neglected by builders since the crisis; however, just this year, low-end jobs wage gains reached their highest level since the crisis. One of the most fundamental problems is a mismatch in new construction between what worked over the last decade and where the strongest demand resides today. A selection of quotes from recent homebuilder earnings calls highlight this phenomenon:
- “We are experiencing healthy market conditions across most of our markets with solid demand, especially at affordable price points. And the supply of new homes remains limited. In this environment, we’re reducing sales incentives or raising prices in communities where we’re achieving our targeted sales pace, while striving to ensure that our product offerings remain affordable.” Q3 2018 D.R. Horton 7/26/2018
- “So there’s not a lot of inventory out there at the affordable price bands, and much of the headlines, I think, are tied to higher price points that are seeing some slowdown. And we’re trying to stay ahead of that at the price points that are slower, are well above us today and where we’re operating. But if it comes down, we have to be prepared for that, and it’s in part why we’re rotating to lower priced communities, positioning smaller models in higher priced areas even to keep affordable and keep some insulation there. But we think market conditions are very good and continue to see a growth opportunity as we head into ’19.” Q3 2018 KB Homes 9/25/2018.
- “Well, sort of on a general basis and there are some exceptions at the higher price points, it’s gotten a little bit softer than the lower price points have been. And that’s not unusual in a market that there’s a lot of publicity as to what’s going on in mortgage rates and price depreciation. Because the more affluent buyers time their purchase based on where they think the world is going. And so we think, as we said consistently, that this is just a market adjustment to a more normalized market from what was, really, a red-hot market in some of these markets.”Q3 2018 Lennar Corp 10/3/2018.
While some of the signs are troubling for the housing market, we think the shift from high-end to affordable is a mix-shift problem that will resolve without too much residual damage. Further, recent market activity has gone a long way towards correcting two of the big prongs impairing affordability: first, mortgage rates have come down considerably since peaking in early October, along with the 10-year yield; and, second, although housing markets correct more in terms of volume than price the rise in price will be held in check by rising inventories, sluggish volumes and a down stock market. [5]
The call that remains outstanding is one that has become a mantra of sorts for us since the commencement of RGA Investment Advisors in the wake of the financial crisis and is perhaps the most important. Last year we said:
It is hard to sit in our seat today and say exactly which areas of the market would best withstand the next bear, for there are yet to be obvious areas of overinvestment like the technology sector in 2000 and the financials in 2007 that will lead the way down; however, we have confidence that the nature of the next recession (and let’s not forget, a recession is an inevitability eventually) will be different than the last. To reiterate: “the 2007-09 bear market was an actual liquidity crisis where deflation was the risk that imperiled the economy, whereas the next recession will be a normal Fed induced recession when inflation gets too high and the Fed thus raises rates to cool things off.
China and tight labor are the kindling for broader fears
One of the fears today is that market action can be self-perpetuating and self-fulfilling. In 2018, we saw no real signs that point to an imminent recession in the U.S. but markets have now gone a long way to price one in. The global situation is messy and the idea that “Trade wars are good, and easy to win” is truly being put to the test. [6] We are insistent that they are neither good, nor easy to win. That said, there is merit to pushing a harder line with China on global trade; however, we think a resolution in a reasonable timeframe is imperative.
A conversation we had with the CFO of a manufacturing company was truly insightful on this point. The CFO told us that the biggest challenge is not knowing how to pursue strategy. Companies spent over a decade building their supply chains to run through China–this was not done overnight. For some of the largest multi-nationals, it makes sense to accelerate planned supply chain diversification to areas like Vietnam; however, this CFO warns that Vietnam’s labor pool is not skilled enough for hard durables and the port volume is not deep enough to handle the swell in demand. Further the strategic bind is intensified because if there is a timely resolution to the trade war, a diverse supply chain will end up as a cost that dampens future returns. C-suite strategists are left flat-footed between action and inaction with severe costs on both sides of hindsight proves either side wrong. This leaves many in “wait and see” mode because it’s easier to undo inaction than action. In the near-term, the combination of a strengthening dollar and some tactical maneuvers like batching orders and changing the “importer of record” have helped cushion the impact, affording the luxury of time. This state of affairs cannot last for too much longer.
This CFO conversation featured a second insightful angle on the state of the US economy. While he expressed caution about the China situation, he emphasized that an even bigger challenge was the US labor pool. The CFO’s company manufactures at low wage rates, though with a degree of skill required for some harder tasks. The CFO emphasized how the ability to retain employees was killing efficiency necessitating a change in their compensation structure to enhance retention. The company went to higher base rate and incentive compensation tied to efficiency and productivity. This was echoed a late December survey claiming “82% of U.S. CFOs expect a recession to have started by 2020.”[7] Per the survey, “The biggest concern U.S. CFOs had was the tightening labor market, which makes hiring and, therefore, continuing operations and expansion more difficult.”
Tight Labor and the Fed
Federal Reserve Bank Chairman Jerome Powell has come under fire from various corners of the political and market sphere for raising rates in December despite weakening equity markets. We think his decision was largely motivated by concerns about the labor environment. 2018 saw the swiftest rise in average hourly earnings since the financial crisis and with full employment, the Fed is expressing caution that inflation can stay within its targeted range. This gets back to our point that the next recession will be caused by the Fed, and some seem to already believe this is the Fed’s intent right now (something we believe is an overly hawkish take on the Fed’s intents). We do think it was a mistake to raise rates in December and that the risk from holding on just one more month was far more modest than acting too swiftly, though at the same time we do not think the economy is so fragile as to tip over from one 25 bps move.
It is very hard to call a good employment environment a “headwind” to the economy. After all, the economy relies on consumers, with gainful employment, investing and spending the proceeds of their labor. Rising wages should thus lead to both better consumption and better investment. This should be one of the factors most supportive of preventing a deeper slide in the house market. Importantly, this could help alleviate one of the big mysteries of the wake of the Financial Crisis–why has productivity growth been so poor?
The answer might be as simple as the amount of slack in the labor market that persisted for far too long. Why would an employer invest in productivity when they could simply hire a helping hand for decently less than the inflation adjusted wage a decade prior? Investments in productivity take an economic calculus of opportunity cost. Can I buy technology that will enhance my productivity over the next five years for less than it would cost to train and employee a worker over this time? Today with unemployment in the high 3%s is very different than five years ago at this time sitting just beneath 7%. Below we will tie this force with one of our new investments during the quarter.
What if we go into a recession in 2019?
If we do head into a recession now (and it’s hardly a foregone conclusion), the economy will do so on much stronger footing than in 2008. The employment backdrop is one of the more important differences today. The composition of the workforce both in terms of age (millennial cohort is hitting peak employment rates and ages today) and sector are very constructive. Bank capital ratios are in their healthiest state in decades, household balance sheets are as strong as they have been in decades and the key industries that led to the 2008 recession massive job losses are on much firmer footing. Over any long-term timeframe, recessions are a guarantee. The key is understanding where the real economic and market damage will come from within in. In other words, it’s important to have confidence in a portfolio that there will not be true long-term impairments in value vs interim markdowns in stock prices that will eventually revert to trend once the dust settles.
Market structure matters a lot for how stocks handle shocks–whether they be intrinsic or extrinsic shocks. We spoke about the industry reclassification undertaken by S&P shaking up the “technology” label as a sector. The major shuffle, which was described as “the biggest impact on the sector landscape in GICS history” went into effect on September 21, 2018. Markets peaked on September 20, 2018. We do think that begs the question whether there are structural or fundamental causes to the subsequent market action. While one can never know for certain, the crowding of certain pockets of the active investment community (ourselves included) in the technology sector was vulnerable to the crosscurrents that the rebalancing flows created. Add to this pocket of vulnerability a sluggish housing number and ongoing China questions and you have the makings of a bear market with or without a recession.
This also helps resolve the question: “if the biggest risks are labor tension and the trade war with China, why are some technology stocks with minimal exposure to trade wars and labor an immaterial portion of margin the biggest losers over the last three months?”
Forward P/E’s today are the lowest they have been since 2013, the year in which we had some “normalization” post crisis:
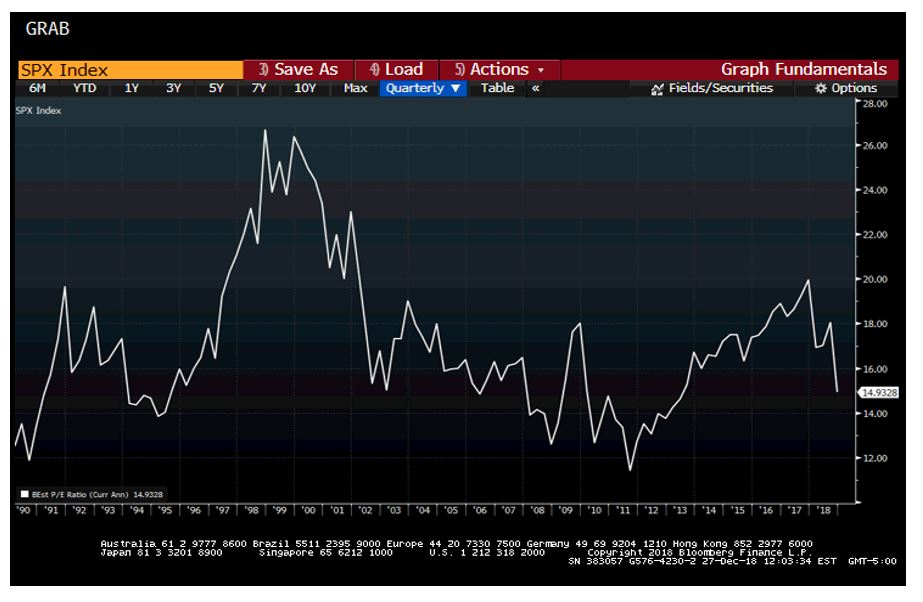
In the end, 2018 marks one of the biggest one-year declines in the forward P/E in the past few decades fueled by a combination of strong realized earnings growth and a decline in the stock market. Some of the earnings growth was the sugar rush from tax cuts, though a healthy amount was realized via higher revenue growth. While one might call the early 2018 levels “the upper end of fair value,” today is on the lower end of the fair value range. Yes, we have been below these levels, but they were in far different environments. This makes now a compelling time for long-term investors to put money to work.
See through the lumps at Cognex’ bright future:
Cognex is one of the most compelling companies we have come across in some time. The company boasts gross margins in the mid-70%s and ROICs upwards of 100%. Yes, that is not a typo on the ROICs. Consequently, Cognex has built a healthy balance sheet featuring a cash stash upwards of 10% of the market cap today. The problem for the company is that demand cycles are incredibly lumpy, and growth is inconsistent from year-to-year. While Cognex targets a 20% compound annual growth rate in revenue, which they have come close to over the past five years, the longer-term realized growth is closer to 15%. This longer-term period includes the crisis.
Cognex is in the business of “machine vision.” They build the sensors and the supporting software for manufacturing, supply chain and logistics companies to process and analyze a high velocity of product and data moving through a field of vision. The industry is somewhat fragmented, with the two largest players (Cognex and Keyence) combining for about 40% of share in the core machine vision segment. The core TAM for Cognex will represent about $4.3 billion in 2019, expected to grow at an 8% compound annual growth rate into the foreseeable future. Vision itself is a mission-critical add-on to other core automation initiatives and is a modest percentage of the cost for a company to automate in their respective field. While there are some functions of vision that are commoditized, the high function areas are both research and relationship intensive. Cognex and Keyence spend meaningfully more than the rest of the industry in R&D (a target around 15% of sales at Cognex, one of the most R&D intensive companies) and they have dedicated sales forces of highly trained engineers who work in close conjunction with their customers to develop uniquely tailored solutions.
Cognex CEO Robert Willett explains this nicely in the company’s Q3’18 earnings conference call:
“I mean, machine vision is very difficult to do, and the competitive advantage of advanced products from us and a few of our competitors is very substantial. So in general, this is not a market driven by price. It’s a market still driven by technology. Of course, we could drop price to try to win share, but that’s never been something that we’ve wanted to do. It’s not what we’re about as a company nor I believe it’s really what about — our major competitors are about.”
Note that while the units sold are measured much like a hardware company would, what Cognex (and Keyence) really sell is the software designed to process what the hardware reads. Customers get an ROI within two to three years of purchase, creating an incredible pricing advantage for these two unique companies.
Willett, as CEO, has the background and incentive structure we admire. He built his own business–Willett International LTD–that he sold to Danaher for $125 million in 2003. Danaher merged Willett’s business into their Videojet subsidiary and made him the head of the business unit. You may have heard of Danaher recently, when its former CEO Larry Culp was picked to help GE out of its mess.[8] Danaher is known for both outstanding operations built around the “Danaher Business System,” (DBS) a form of the Japanese “kaizen” and a deep capital allocation playbook deployed with prudence. DBS and kaizen feature continuous improvement and efficiency. Despite proceeds that would make anyone comfortable financially, Willett’s drive led to him joining Cognex in 2008 as an executive VP, rising to COO in 2010 and ultimately CEO in 2011 when the company’s founder Robert Shillman stepped back.
Cognex growth has been fueled by a robust secular tailwind driving automation’s increased adoption within and across various industries. The company has been further aided by taking a growing share of the revenue pie. One notably large customer is Apple at over 20% of revenue. This has left Cognex vulnerable to Apple’s iPhone upgrade cycle, further fueling the lumps. Apple is unquestionably a great customer and the willingness of Apple to pay Cognex an exceptionally high margin despite a reputation for pressuring key suppliers is demonstrative of both Cognex quality and importance. Importantly however, we see the future of revenue streams diversifying to Cognex’ benefit. Two emerging areas of growth are logistics and 3d vision. Logistics is interesting for how low the overall penetration has been. Arguably this has been a direct result of the high unemployment rate over the past decade. With labor tightening alongside the rapid escalation in ecommerce and commensurate rebuild of supply chains to accommodate new market realities, the outlook is as bright as ever for logistics. [9]
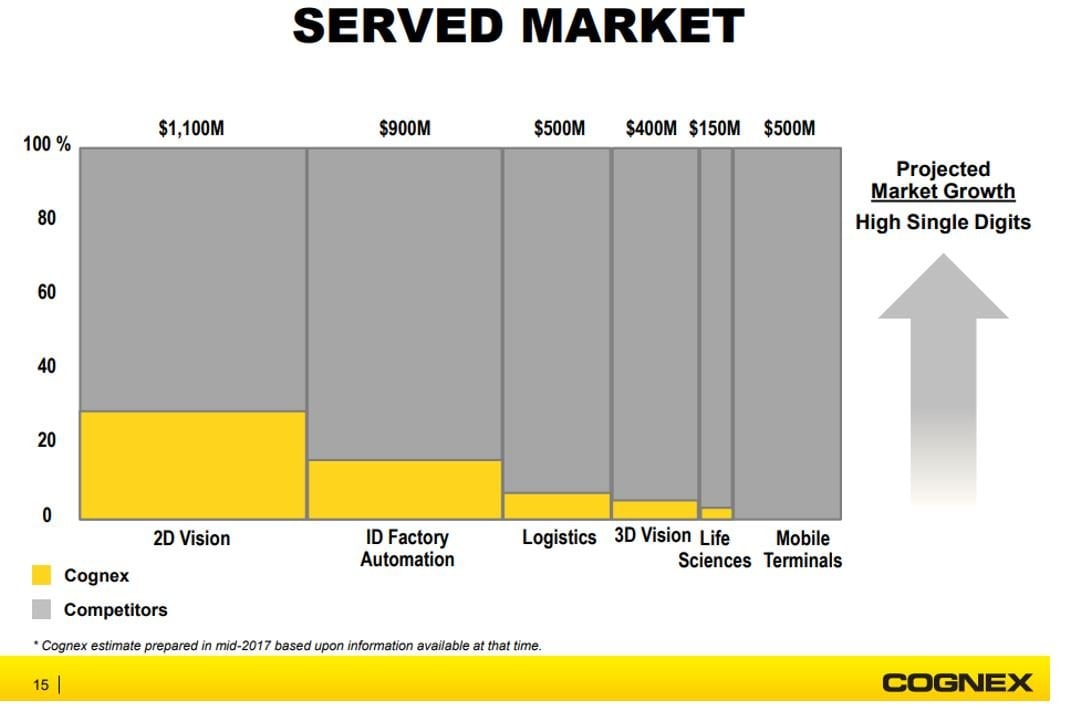
Today, about 10% of Cognex’ revenues come from logistics, a market which vision has 10% TAM penetration. We see Cognex’ share of revenues from logistics nearly doubling over the next five years. Similarly, 3d vision will continue its own rapid growth.
We envision Cognex’ revenue base evolving along the following lines:
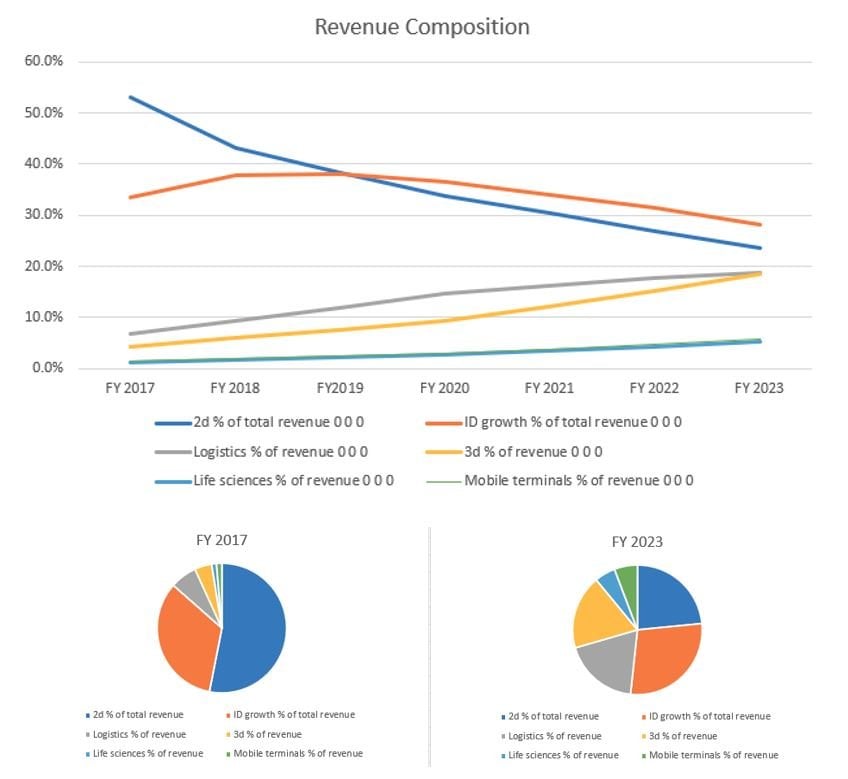
Notably, the future growth drivers have far less lumpy demand channels than the existing ones. Meanwhile, the existing channels will continue to grow albeit at their consistently inconsistent pace. Diversifying the revenue stream in this way will give analysts more confidence in forecasting out-years and investors more confidence in ascribing an appropriate multiple to the company’s earnings stream.
With over 100% ROICs, capital allocation is an important driver of future value and the hardest to model. The company boasts over $830m in cash, though does not screen that way since around $300m of that resides in “long-term investments.” Given Willett’s background at Danaher, it’s no surprise that capital allocation has been a strong suit. Despite the huge cash balance, Cognex’ share repurchases have been incredibly lumpy with the company demonstrably “buying low.” To that end, repurchases have been reaccelerating in the past year after having paused on the share price’s rapid ascent.
In our base case, we see a clear path to double digit annualized returns with a minimum three-year target holding period, assuming no return is generated on excess cash flow either via strategically timed repurchases or acquisition. We expect the primary driver of growth to be a presumed 12% CAGR in top line, with modest EBIT and EBITDA margin leverage. Note this 12% CAGR falls well short of the company’s 20% target and below the 15% realized growth rate. In our bull case, growth in the high teens for the next four years, settling into the mid-teens thereafter, alongside 200 bps margin leverage supports prices today into the $70s, with the same prevailing assumption on reinvestment of cash flow. In our bear case, a mid single digit CAGR and flat margins give us confidence that a worst-case outcome would yield a mid $30 stock over our targeted 3-5 year timeframe. This bear case also assumes a WACC of 10% vs 9% for the base and bull cases.
Full Stream Ahead with Roku:
In our January 2016 commentary, we detailed our attraction to networks and platforms in the digital age. We were insistent on the appealing valuations and growth prospects for a certain crop of elite company. Today we see a similar opportunity taking shape and we have found our favorite risk/reward setup in a “robust network for the long-term” since then: Roku, Inc. (NASDAQ: ROKU). Many of you heard of Roku and have a streaming device of some kind in your household–likely also a Roku. Our younger readers are likely not just to have a Roku, but to consume a high percentage of video content on one of their devices. Per Anthony Wood, CEO of Roku, “10% of the 18 to 34 year olds watch their television on a Roku,” meaning Roku itself is the exclusive platform through which this key demographic watches TV.
You can get a sense of the future by seeing how this breaks out timewise:
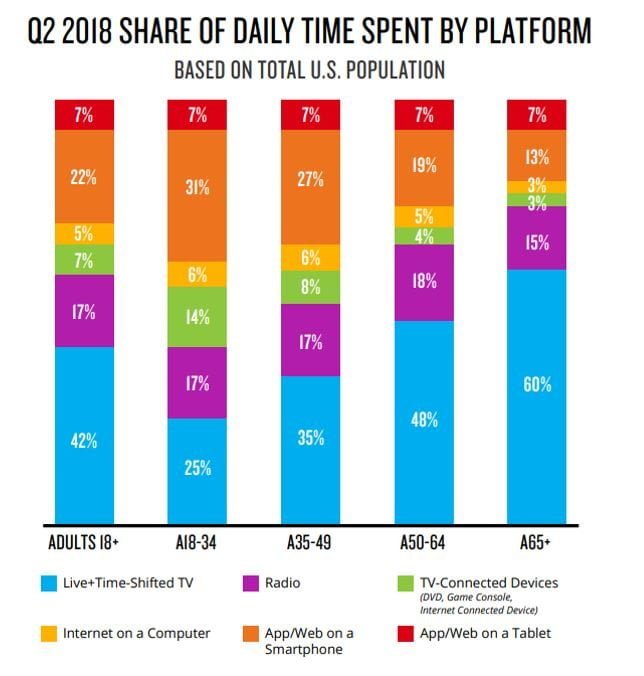
(Nielsen Q2 2018 audience report)
Roku Inc IPO’d in 2017 and the stock has been highly volatile ever since. At the time of IPO, approximately 56% of revenues were driven by low margin hardware sales (“Player” sales) and the remainder from “Platform” sales. In the first quarter of 2018, Platform exceeded Player sales for the first time in the company’s history. This was the inflection point upon which it became clear the company’s future value will be driven by Platform sales. The company strategically views Player sales to drive placement of the Platform. Once a streaming device (whether a stick or increasingly a TV itself) is placed in a household, the company then seeks to monetize an account with a combination of successful subscription and Video-on-Demand (VOD) purchase royalties (1/3rd of Platform revenues) and, more importantly advertisements (2/3rds of platform revenues and growing quicker than the combined segment). Ads take several forms, including home screen placements for audience building, but most important is advertising VOD (AVOD).
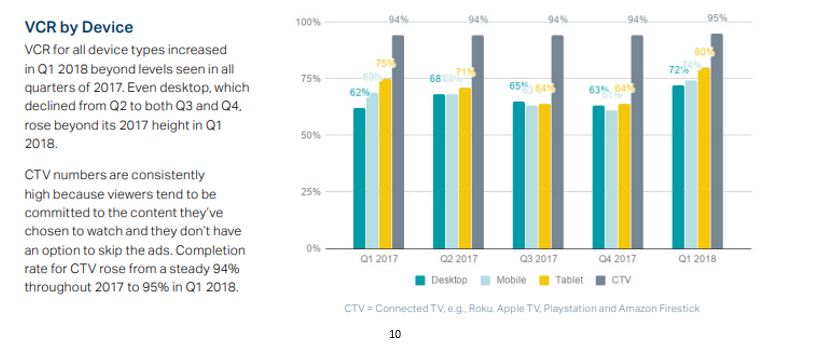
Once a household has an “Active Account” on Roku, the Platform side benefits from several levers enhancing monetization over time. First, with a surging abundance of streamable content, hours streamed continues to grow. Second, Roku can “fill” more of the available inventory on the platform. Third, Roku can drive better CPMs (cost per mil/thousand impressions) augmenting advertising inventory with its growing trove of user data. Roku boasts 95% completion rates on commercials, which contrasts favorably with linear TV.[10]
The enhancement to the user experience offered by lower ad loads makes the ads themselves more valuable. Scott Rosenberg, the one who runs the advertising platform at Roku, described it as follows in their Q3 2018 call:
“We’ve been very effective at showing them the ROI math, that the last dollar that they put in the linear TV is reaching a smaller and smaller base, and that if they move that dollar to Roku, it’s going to deliver much more reach and ROI. I’m just — I mean, backing up more broadly and thinking about our advantages as an ad platform, the reason advertisers come to us in the first place is we’re an ad-scale platform with the largest, most engaged user base. It’s a unique audience that can only be reached on Roku. We’ve got that direct consumer relationship and all of the data that flows from it. And ultimately, it’s ads that work.” Roku is building its own “walled garden” with this virtuous cycle.”
In 2018, just shy of $70 billion will be spent on advertising over linear TV. When measured as “linear TV,” advertising is no longer growing.[11] Advertising on digital platforms will grow nearly 19% in 2018. Advertising on the Roku platform will nearly double. Roku was early to realize there was demand for free content, supported by ads in the streaming world, while the rest of the world was focused on subscriptions. As a result, some estimate Roku controls as much as “87% of ad requests” on connected TV today.[12] This kind of scale has advantages for viewers and advertisers alike.
We think inevitably most TV will be consumed through one of the digital platforms and as of today, two clear leaders are emerging: Roku and Amazon. Each boasts unique advantage and each benefits from considerably more share in the relevant metrics than the peers on the outside looking in (like well capitalized Google and Apple). One of Roku’s most important advantages in this competition stem from the platform’s openness. On Roku Inc, you can watch Amazon’s Prime TV, YouTube, access the Google store and channels with add-ons ranging from ESPN to NBC, whereas on Amazon there have been extended periods of time where YouTube is inaccessible. Roku’s combination of interface, quality and low price are garnering favor with customers and reviewers alike. For TV manufacturers competing amidst this monumental shift in the content distribution landscape the answer is rather simple. Wood summed up the advantage of Roku software for a manufacturer as follows:
“So for example, so what’s better about Roku software? Well, a big one is that phones are expensive, like they cost a lot of money, they’re super computers. TVs are cheap, the main board on a TV is $25 and TVs are brutally cost competitive, no one makes money in the TV business. So our software runs on low-cost TVs, it costs less to build a TV with Roku software. When you’re trying to get 50 cents off your bill of materials so you can win a Black Friday special at Walmart, the amount of money you save by cutting your RAM in half and your CPU in half by running Roku software — which actually has great performance and more content — is huge. It’s the difference between getting distribution and not getting distribution in Walmart.”[13]
Roku Inc is led by Anthony Wood and its origin story sounds more Hollywood than Silicon Valley. Wood himself owns 25.9 million shares, or 24.2% of the company. Wood’s ownership is via the Class “B” voting shares, of which he controls 42.3% of the vote. As such, investors in Roku are effectively business partners with Wood, granting him an extremely high degree of control. While the separation of voting control is not ideal, we like how much Wood’s own fortunes are tied to Roku’s stock and view this as an important alignment of interests.
Wood’s background is interesting and worthy of such co-investment. He founded a DVR company that was an early competitor to TIVO, called Replay TV and learned much about the box placement and content challenges along the way. The successor company to Replay TV is now owned by DirectTV. The proceeds from this early foray helped Wood bootstrap Roku early on and has led to a determination to conservatively finance the company while investing in growth. Roku’s history is tied to Netflix and streaming itself. In fact, it’s first name was “The Netflix Player by Roku.” The idea within Netflix was to create a platform for easier distribution of streamed content, but Netflix instead decided to pursue licensing arrangements with various hardware-based distributors ranging from gaming consoles to TV makers. Wood speaks with grand ambition when he talks about making Roku the operating system for the future of TV:
So the big picture is if you think about when new competing platforms have emerged, the software platform has always changed. So if you go back, we were talking about PCs back in the early days, well before PCs, there were mini computers like that PDP 11. Those had their own operating systems. Those operating systems didn’t make the transition to PCs. Instead of operating systems designed for PCs, Windows became the dominating operating system on PCs and then when phones became a computing platform, Windows didn’t make that transition. No one’s running Windows these days on their phone, they’re running Android or iOS.[14]
Since Roku Inc places an actual piece of hardware in a house, increasingly in the form of a TV, the churn associated with the platform is inherently lower. Per Roku’s analysis, one out of four smart TVs sold in the US are powered by Roku’s OS. Evidence of this is provided by TCL’s rise from a non-factor in the TV industry (24th in market share) to number three overall share, driven almost entirely by the Roku relationship.[15] The Washington Post recently called a Roku-powered TCL TV “the best deal on a premium TV I’ve ever seen” when comparing it to a high-end Samsung[16]
It is important to consider both the actual and the strategic value of Roku Inc. Disney, which has every reason to downplay the value of Hulu as it seeks to acquire the 40% it does not own recently valued Hulu and it’s near 30 million users at $9.26 billion[17]. In contrast to Roku, which is modestly cash generative in today’s high growth mode, Hulu continues to burn cash. Further contrasting the two is how Roku places hardware whereas Hulu sells subscriptions. Digital subscribers tend to churn with regularity.
As of today, Roku boasts nearly 24 million households. In its Q3 2018 report, Roku Inc reported trailing twelve-month annual revenue per user (APRU) of $17.34, up just shy of 48% yoy. CPMs on the platform are said to be upwards of $30, rivaling some of the best networks on linear TV. Roku tastefully inserts ads at approximately 1/4th the industry average ad load (4 minutes of advertising per hour on Roku vs 16 minutes on linear) and have banned pre-roll ads before movies or shows in an effort to “premiumize” the experience watching content monetized with ads. The effort to make advertising more personal and to consume less time per hour makes the platform and its supporting ads appear less intrusive to consumers. This makes viewing content on Roku increasingly appealing driving further growth in hours viewed per account, thus making the entire platform increasingly attractive for advertisers to be on.
The Roku Channel (TRC) itself is becoming a key driver of value. TRC was first launched in October 2017 and is already one of the top 5 most watched apps on Roku. Originally, TRC was solely available on Roku itself, but now the company has a distribution agreement with Samsung covering their smart TVs (perhaps a precursor of a bigger agreement), has enabled web-based login and a forthcoming mobile app. These changes have untethered TRC from the Roku hardware and unleashed TRC as a streaming asset with universal availability. The increased engagement with TRC has driven ad revenue growth which has empowered Roku’s ability to acquire more desirable content. There are also signs Roku will use TRC as a home screen and a modern aggregator/bundler of content. Roku Inc started the New Year by announcing the availability of subscription content within TRC that will be payable all via one simple, monthly bill.[18] Our guess is that this subscribable content is monetized like the standard royalty Roku takes on subs over its platform. There have also been suggestions The Roku Channel might eventually become fertile grounds for Netflix to release past seasons of some of their own shows as advertising supported content, to both further monetize that content and tempt new subscribers to join.
At the end of 2019 we expect unit economics to look like the following:
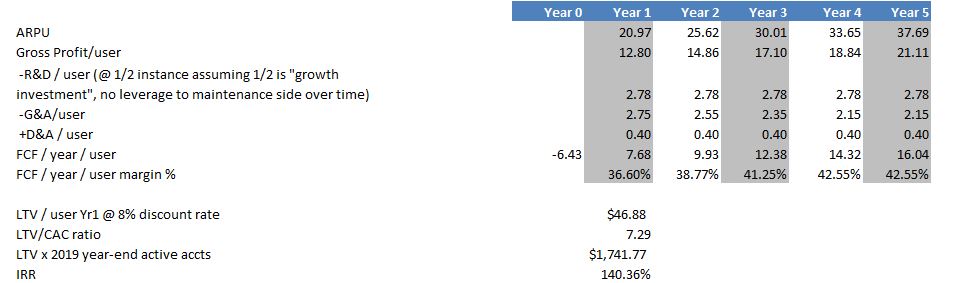
These assumptions are also unfair to the Player business, which does generate margin. The company views this “margin” as a form of “negative customer acquisition cost” and for the purposes of our analysis, we use this as an offset to selling & marketing expense per new active user. Wood explained the margin rationale as follows: “And if we felt like…it’d be better for us to go to 0 gross margin or even negative on players, we would certainly consider that. But right now, at some point, there’s diminishing returns. I mean, the cheaper you make the players, the more likely that someone buys it and doesn’t use it.”[19] Laying out the money up front for a Roku device is effectively a commitment that it will be used. This is the same rationale behind a Costco or even Amazon Prime membership.
If Roku Inc can get to 40 million Active Accounts (32% penetration of the 126.22 million US households, leaving aside the international opportunity for now) and an ARPU of $25 by 2020, the company can hit $1 billion in platform sales (approximately 66% growth for Active Accounts and 50% growth for APRU over expected 2018 final results, both implying a fairly large slowdown from present trends). This $1 billion expectation is slightly ahead of the consensus expectation, which has been rising consistently as the year progressed (Roku is one of those rare cases where a stock will finish the year down 40% all the while forward revenue expectations rose). If we assume no value or margin for the Player business, we can use today’s roughly $3 billion market cap and think about what the 3x P/S means. P/S = net margin * payout ratio * (1+g) / (r-g). In solving for net margin, assuming a 10% WACC and either 4% or 5% growth, you get an implied net margin at maturity of 17.3% or 14.3% respectively.
We think 3x what is an achievable 2020 platform sales targets a unique wager. If beyond that timeframe Roku achieves one of the following, returns on an equity investment today will be comfortable in the double digits annualized:
- Greater than 40m households long-term
- Greater than a $25 ARPU
- Greater than a 20% net margin
- Growth above terminal rate in 2020 and beyond
It’s possible for Roku Inc to exceed each of these hurdles, with ARPU being the most likely and an answer on net margin farthest in the future as the company invests to drive growth beyond the forecast period. To put the 3x P/2020 Platform sales in context, many great high growth digital platforms trade with P/S upwards of 8 (see NFLX, SHOP, CRM, SQ, ETSY, and TTD to name a few). We expect the primary driver of returns to be Roku’s delivery of exceptional growth; however, we also see a path to multiple expansion as the market comes to appreciate the company’s uniquely advantaged business model, scale and free cash flow generation ability on a recurring style of revenue base.
Thank you for your trust and confidence, and for selecting us to be your advisor of choice. Please call us directly to discuss this commentary in more detail – we are always happy to address any specific questions you may have. You can reach Jason or Elliot directly at 516-665-1945. Alternatively, we’ve included our direct dial numbers with our names, below.
Warm personal regards,
Jason Gilbert, CPA/PFS, CFF, CGMA
Managing Director
O: (516) 665-1940
M: (917) 536-3066
Elliot Turner, CFA
Managing Director
O: (516) 665-1942
M: (516) 729-5174
[1] https://twitter.com/bespokeinvest/status/1077261781586849792
[2] https://money.cnn.com/2002/07/19/news/crash2002/:
[3] https://www.marketwatch.com/story/stock-market-investors-are-right-to-be-frightened-by-rising-bond-yields-economist-2018-10-12
[4] https://www.cnbc.com/2018/10/24/new-home-sales-september.html
[5] Leamer, Edward. The Housing Cycle IS The Business Cycle https://www.nber.org/papers/w13428.pdf
[6] https://www.cnbc.com/2018/03/02/trump-trade-wars-are-good-and-easy-to-win.html
[7] http://fortune.com/2018/12/12/cfos-recession-2020/
[8] https://www.cnbc.com/2018/10/05/new-ge-ceo-larry-culp-inks-stock-heavy-contract-worth-up-to-300-million-if-shares-soar.html
[9] https://cgnx.gcs-web.com/static-files/8ca19d6f-3ea7-44b3-bf08-6bc7d9616cd8
[10] https://www.iab.com/wp-content/uploads/2018/06/extreme-reach-video-benchmarks-2018q1.0079873a72f3.pdf
[11] https://www.forbes.com/sites/danafeldman/2018/03/28/u-s-tv-ad-spend-drops-as-digital-ad-spend-climbs-to-107b-in-2018/#28bef1077aa6
[12] https://www.broadcastingcable.com/news/demand-for-connected-tv-ads-jumped-in-last-year
[13] https://www.recode.net/2018/9/13/17852908/roku-anthony-wood-apple-google-amazon-tv-competition-peter-kafka-media-podcast
[14] https://www.recode.net/2018/9/13/17852908/roku-anthony-wood-apple-google-amazon-tv-competition-peter-kafka-media-podcast
[15] https://www.recode.net/2018/9/13/17852908/roku-anthony-wood-apple-google-amazon-tv-competition-peter-kafka-media-podcast and https://www.cordcuttersnews.com/tcl-still-plans-to-sell-roku-tvs-after-restructuring/
[16] https://www.washingtonpost.com/news/the-switch/wp/2018/06/08/this-tv-youve-never-heard-of-is-the-best-tv-deal-weve-ever-seen/?utm_term=.f47b86bfe5ba
[17] https://deadline.com/2018/11/disney-values-hulu-at-9-3-billion-1202506231/
[18] https://www.businesswire.com/news/home/20190102005277/en/Roku-Adds-Premium-Subscriptions-Roku-Channel
[19] Roku Inc at Citi Global Technology Conference 9/6/2018
Article by RGA Investment Advisors


