
The Absolute Return Partners letter for the month of January 2019, titled, “Potential Pitholes Of 2019.”
A lot of Leave voters say “stop complaining, it’s democracy!” Well, democracy doesn’t always work. If five people democratically elect to take your iPhone, it’s a mugging.”
Dane Baptiste
My great day
Allow me to rewind to the 13th July 1984. I turned 25 that day and had invited plenty of friends and family for a bash that same evening. At the end of the main course I began my carefully prepared speech:
“Thank you all for coming today to celebrate me, but there is much more to celebrate today than just me as, earlier today, I married Anne…”.
Q3 hedge fund letters, conference, scoops etc
Deadly silence for a few seconds. Then the real bash began, and it didn’t finish for quite a few hours.
I tell this little tale for you to gain some insight into my behavioural pattern. I am not as plain vanilla as you may think I am, and neither is the investment strategy I pursue. When equities have performed outstandingly well for over 35 years (admittedly with a few hiccups along the way), and when investors are prepared to chase equities despite some very dark clouds gathering on the horizon, I know that the party is nearly over. Could the good times carry on for another year or two? They certainly could but, in the bigger scheme of things, a year more or less is nothing.
Secular bull and bear markets
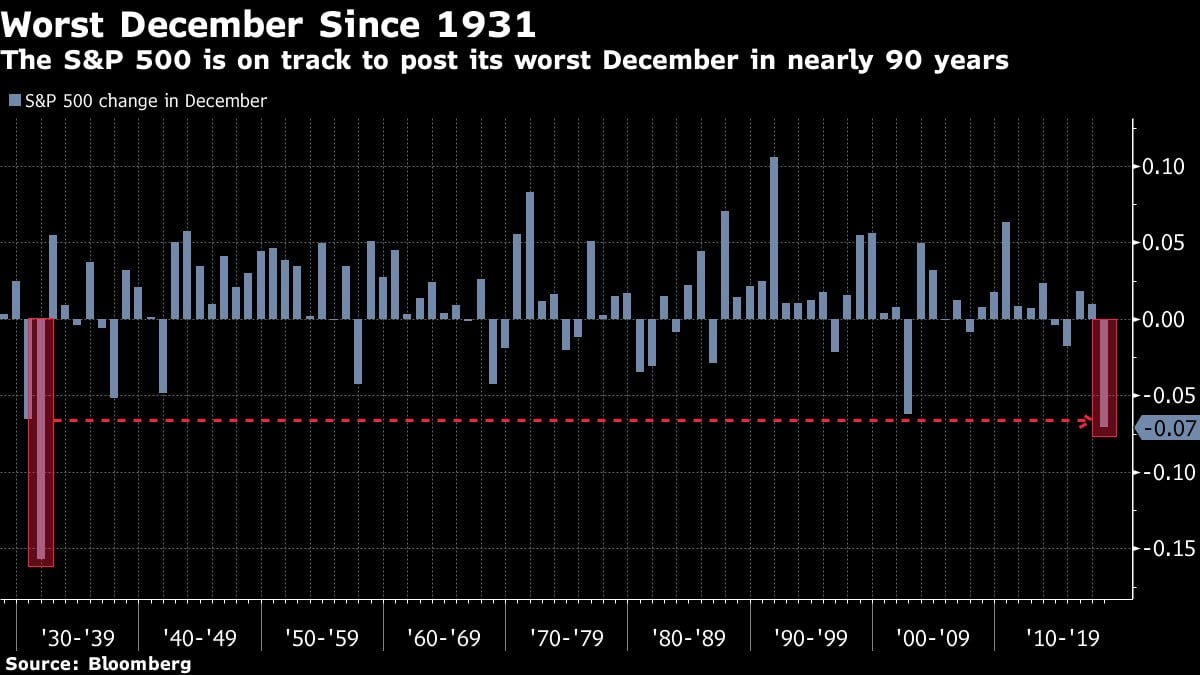
December was a difficult month for equity investors – in fact the worst for US equities in nearly 90 years (Exhibit 1) – but there is more to the story than that. Equities go through both bull and bear markets, but they also go through secular bull and secular bear markets. I will argue today that we are on the cusp of a new secular bear market.
Cutting a long story short, it is possible – it is indeed quite normal – to have several bull and bear markets within a single secular bull or secular bear market. Since 1877, investors in US equities have been through six secular bull markets and five secular bear markets, the last one of which ended in March 2009 (Exhibit 2).
Exhibit 1: S&P 500 performance in the month of December
Source: Bloomberg
A secular bull market is characterised by rising P/E multiples, whereas P/E multiples always fall in secular bear markets, hence the massive difference in annual returns between the two, as you can see in Exhibit 2.
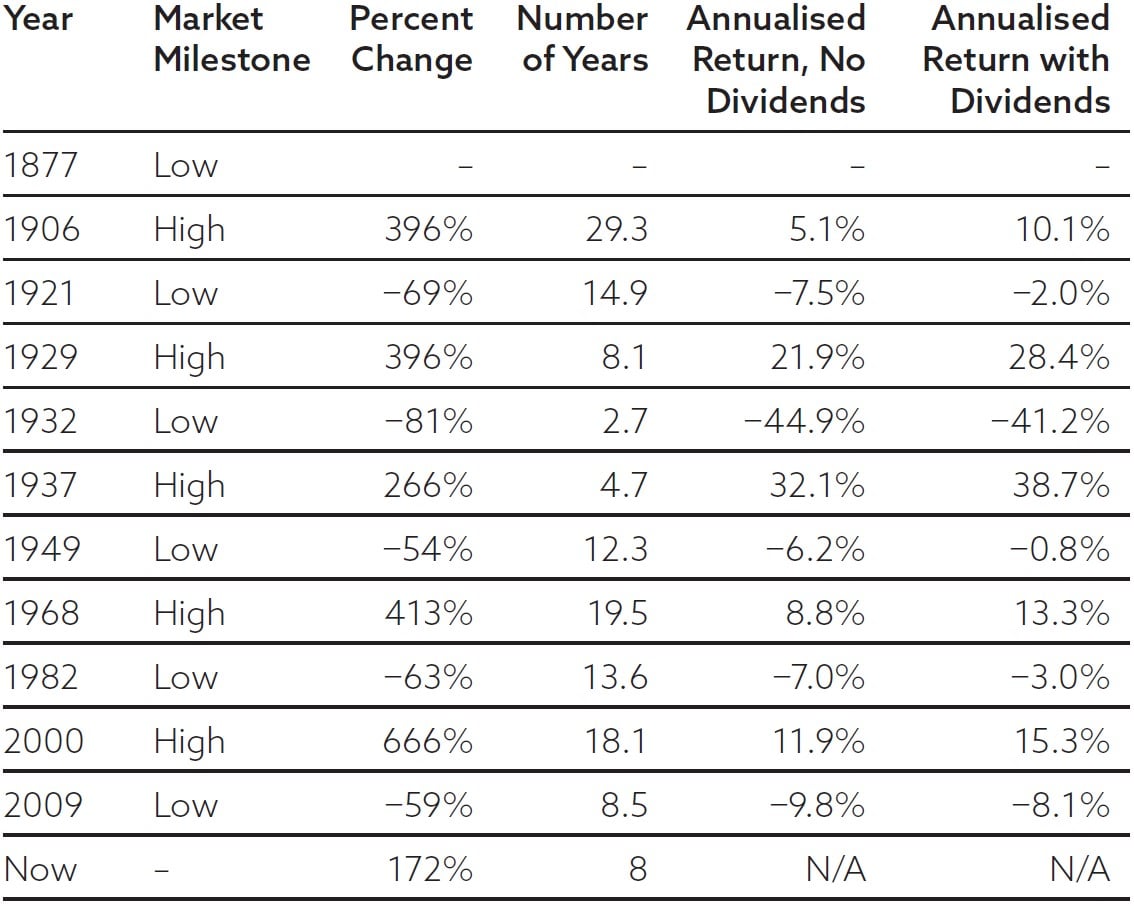
Exhibit 2: Secular US equity bull and bear markets since 1877
Source: The End of Indexing, Niels Jensen
Original Source: A Perspective on Secular Bull and Bear Markets, Jill Mislinski, Advisor Perspectives
Now, if you look at the total return attribution on US equities in 2018 (see Exhibit 3 below which was actually calculated in mid-December), you will see that P/E multiples on US equities have indeed been under significant pressure this past year.
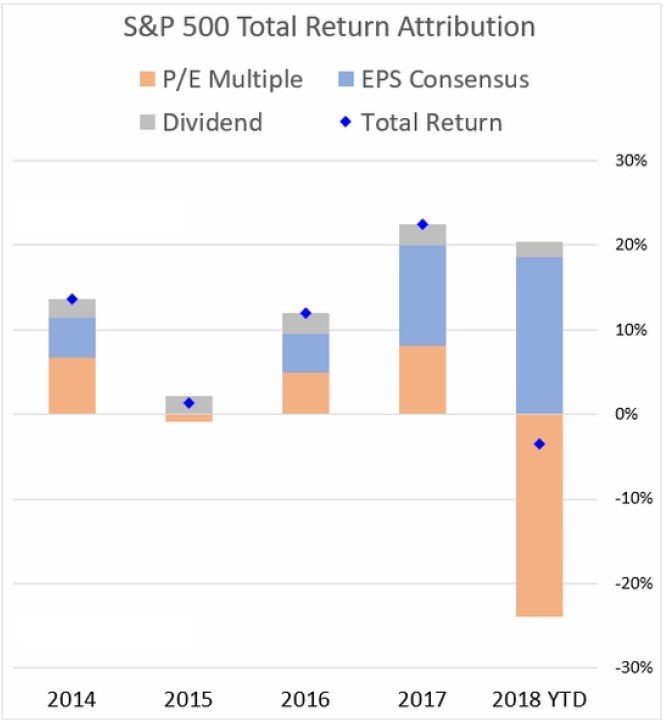
Exhibit 3: S&P 500 total return attribution
Sources: Bloomberg, The Daily Shot
I argued in my book from last year, The End of Indexing, and I will argue again today, that the party is indeed nearly over for now. When you arrive at the end of the debt super-cycle; when the workforce begins to shrink in size and when the middle classes of the developed world (who underwrite economic and political stability) experience declining living standards, then something has to give, and I believe that something is (a.o.) the equity market which appears to be entering a secular bear phase. The 2018 multiple contraction as evidenced in Exhibit 3 is, I believe, only the first sign of that.
The End of Indexing coming to China
Talking about The End of Indexing, I got a call from my publisher a few weeks ago: “We have been approached by a Chinese publisher who wants to publish your book out there. Do you have a problem with that?”
As one of my smug colleagues said in response: “Just make sure it is in Mandarin. That’s much better than your Cantonese”. Smartass comments aside, I am actually looking forward to reading myself in a language that I can’t even count to three in!
I am sure quite a few of you have not yet read the book and, if that is the case, I will strongly encourage you to do so. Not so much because I earn a tiny bit (it is truly tiny), or because it got great reviews but because the underlying structural trends that I discuss in the book are affecting financial markets more than ever and will continue to do so for many years to come. The lowest price on offer at the moment is on Amazon.
People often ask me why it took me so long to write my first (and, according to my wife, also my last) book. I have written 154 Absolute Return Letters since 2003, which equates to about half a million words or about ten books the length of The End of Indexing (Exhibit 4). Clearly, I must have gathered material for more than one book?
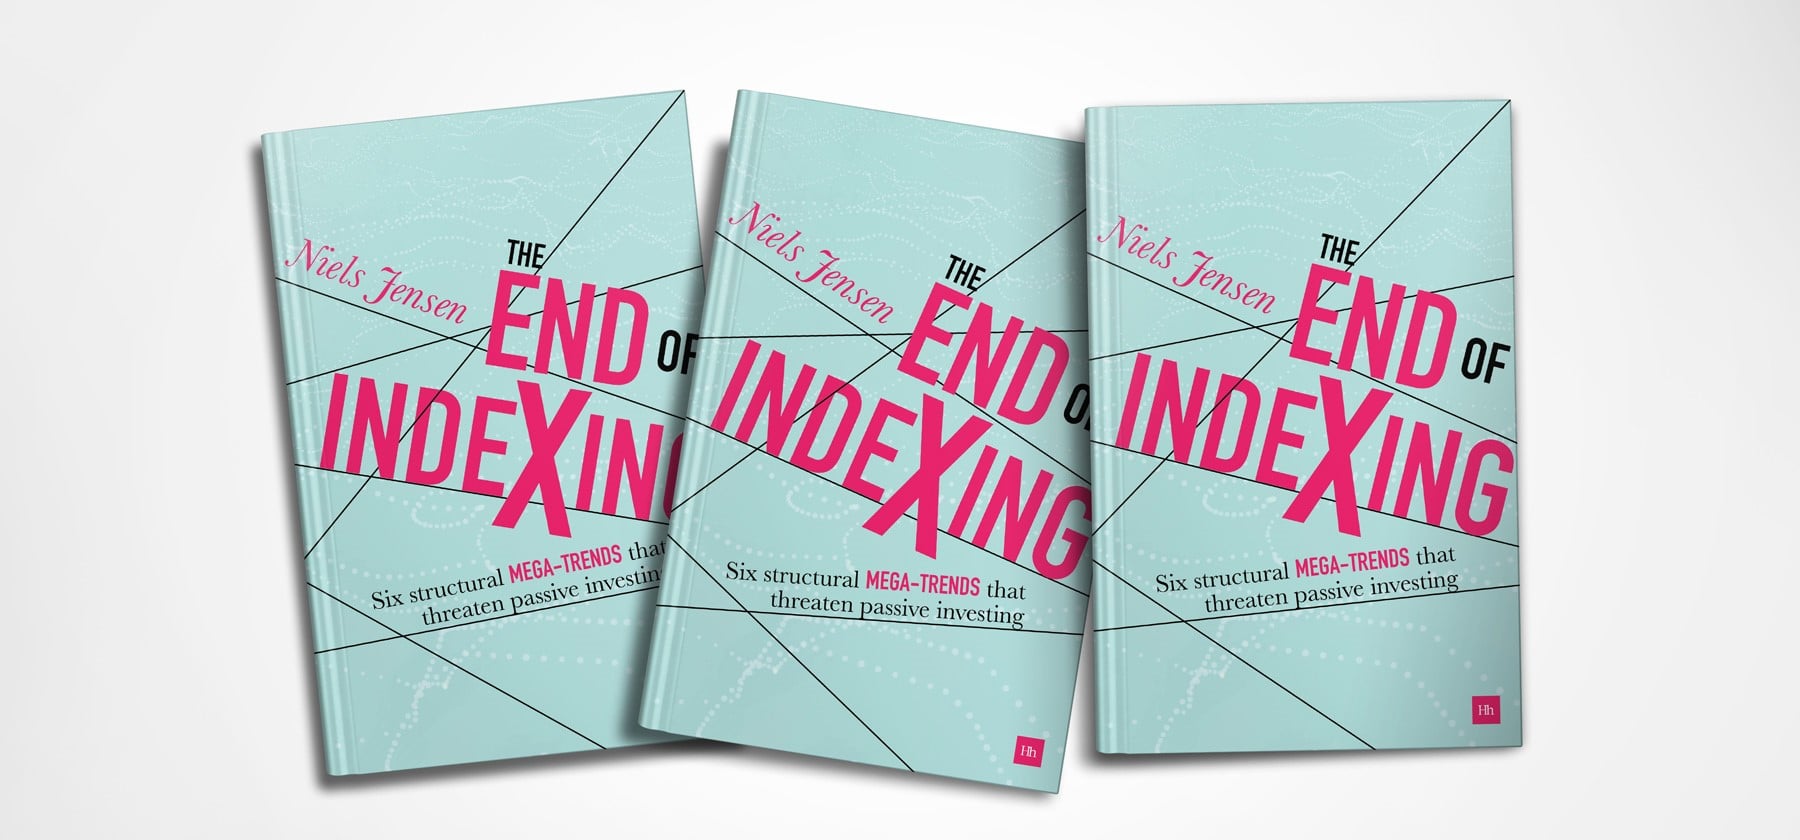
Exhibit 4: The front cover of The End of Indexing
Sources: Harriman House, True Design
My answer is always the same. I didn’t write The End of Indexing because I want to make a living out of writing books (I would be a very poor man if I did). I wrote it because there was – and still is – a bloody good story to be told, and good stories do not pop up on my radar screen every day.
Saxo Bank’s “Outrageous Predictions” of 2019
Let’s switch to something more relevant to the January Absolute Return Letter. As you may recall, the January letter is always about risks that we should worry about in the year to come. Saxo Bank (of Denmark) does a compilation of what they call Outrageous Predictions every year and, this year, their list is more outrageous than ever:
- Australian central bank launches QE on housing bust Down Under.
- Corporate credit crunch pushes Netflix into GE’s vortex.
- EU announces a debt jubilee.
- Germany enters recession.
- Global transportation tax enacted as climate panic spreads.
- IMF and World Bank announce intent to stop measuring GDP, focus instead on productivity.
- X-class solar flare creates chaos and inflicts $2 trillion of damage.
- Prime Minister Corbyn sends GBP/USD to parity.
- Trump tells Powell “you’re fired”.
- Apple secures funding for Tesla at $520/share.
Most predictions are hilarious at first glance, but they all contain at least an element of reality. For example, as far as no. 6 is concerned, I have argued for years that, in a world where the workforce (and population at large) is declining, posting GDP growth on an absolute basis, as almost all nations do, is misleading.
Whether you instead choose to post GDP growth on a per capita basis as I have often suggested, or you report productivity growth, as suggested by Saxo Bank, is less important. The bottom line is the same.
My own “not so outrageous” worries going into 2019
Here in the UK, the Brexit debate, which is farcical at times, has stolen the limelight more recently. It is hard to open a newspaper these days, let alone switching on the radio or TV, without being bombarded with arguments either for or against. That said, Brexit is far from the only thing we should be concerned about going into 2019. My list of the things to worry most about this year looks as follows. Please note that they are not predictions but things that could potentially happen and should therefore be kept in mind when investing:
- The UK leaves the EU on the 29th March 2019 without an agreement between the two.
- The trade war between China and the US escalates and kickstarts the next recession.
- The link between wage growth and inflation is re-established and inflation takes off.
- Populism, which is already at elevated levels, rises further, leading to a cascade of political problems.
- A free-spending (and populist) Italian government drives the country into serious financial problems.
- Wealth-to-GDP finally begins its long-awaited mean reversion.
More on #1: Brexit
Let’s begin with what is likely to define the UK economy for years to come – Brexit. If no last-minute agreement can be reached, the UK will leave the EU on the 29th March at 23:00 GMT without any safety net whatsoever.
I am fully aware that many of our political leaders have argued, and continue to argue, that a little bit of short-term pain is worth the longer-term benefits. I have only one response to that: the poor understanding of economic fundamentals amongst the political elite in this country is breath-taking.
I have recently written a piece on Brexit called Brexit at 23:58. Instead of repeating myself, I suggest you click on that link, should you want to follow my thinking. Only two points that I would like to add in this context.
Firstly, there is a surprisingly large number of people who argue that nothing too bad has happened so far, so why should it happen now? To all those who argue along those lines, I simply remind them that we haven’t left the EU yet, so of course nothing overly dramatic has happened so far.
Secondly, I am still not absolutely convinced the UK will ever leave the EU. Let me give you a simple scenario: the sitting government decides to go for (or are forced into) either a second referendum or a general election.
The latter could very well lead to Labour coming to power, in which case we will almost certainly get a second referendum as there is a clear majority in the Labour party for that. Should that referendum reverse the decision of the June 2016 referendum, what happens next? A best-of-three or …? We are the laughing stock of the rest of the world.
More on #2: Trade wars
People often forget how important international trade is to economic growth (Exhibit 5), which is partially why leaving the EU is a mistake and why declaring trade wars can only lead to problems down the road.
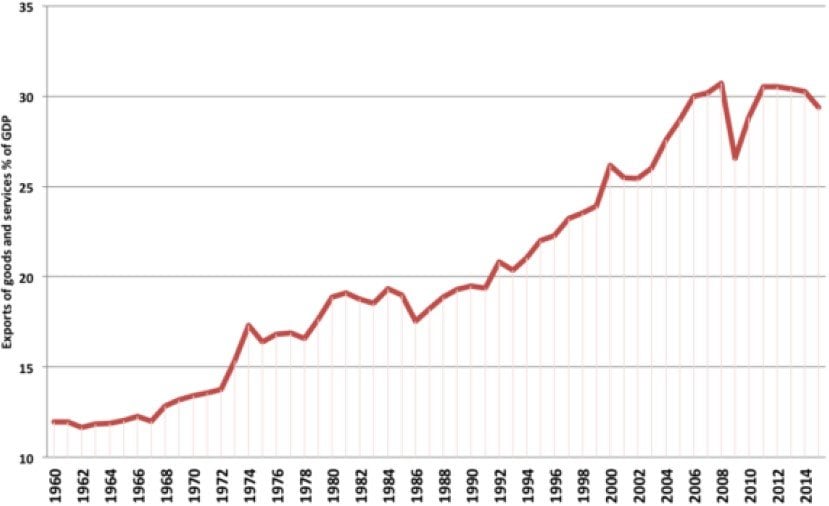
Exhibit 5: World exports as % of GDP
Source: economicshelp.org
Donald Trump didn’t do his homework before raising steel tariffs in 2018. Had he done so, he would have found that nobody ever wins a trade war. The last US president to raise steel tariffs was George W. Bush when he, in 2003, raised tariffs in a misunderstood attempt to protect jobs in the US steel industry.
18 months later those tariffs were reduced again as more US jobs in steel-using industries (car manufacturing etc.) had been lost than the total number of people employed in the US steel-manufacturing industry. Admittedly, the US economy was weaker in 2003 than it is today, but that doesn’t change my conclusion – only the extent to which the US economy will suffer.
More on #3: The link between wage growth and inflation
Another one of my major concerns going into 2019 is that the historic link between wage growth and inflation is somehow re-established. I should point out that I am not referring to the Phillips curve, which measures the link between unemployment and inflation, but there is obviously a powerful link between the Phillips curve and the relationship between wage growth and inflation.
As you can see in Exhibit 6, until early 1994 there was a very tight link between the two. In fact, they were almost perfectly correlated. Then something happened. During the second half of the 1990s, the two moved in opposite directions and have been far less correlated ever since (Exhibit 7).
I worry about this as wage growth is picking up almost everywhere and because the rate of unemployment keeps falling which strengthens labour’s negotiation powers. The rate of unemployment is now clearly below NAIRU in the US, which historically has been considered critical as far as the inflationary impact is concerned.
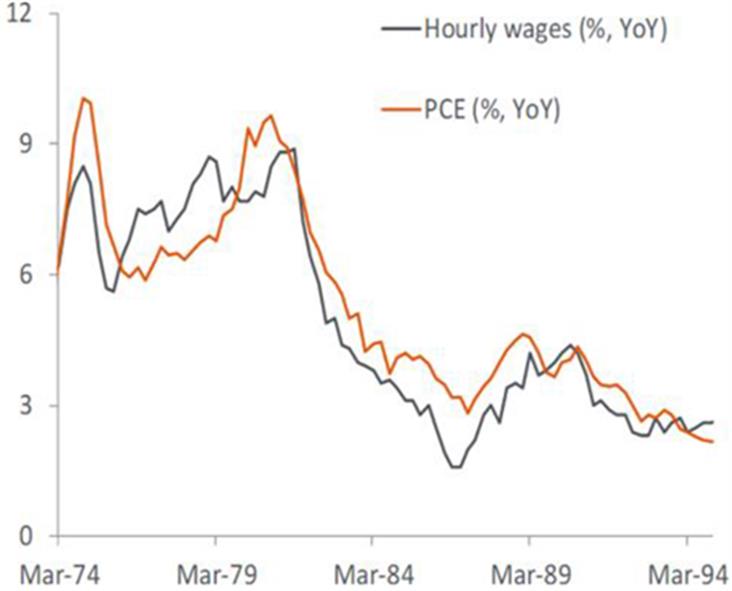
Exhibit 6: The link between wage growth and inflation, 1974-93
Source: Piper Jaffrey, The Daily Shot
In the context of the Absolute Return Letter, the problem I am facing is that this is a major topic, which deserves a letter on its own. Trying to cover it in a few paragraphs makes absolutely no sense but rest assured. I will return to this topic before long.
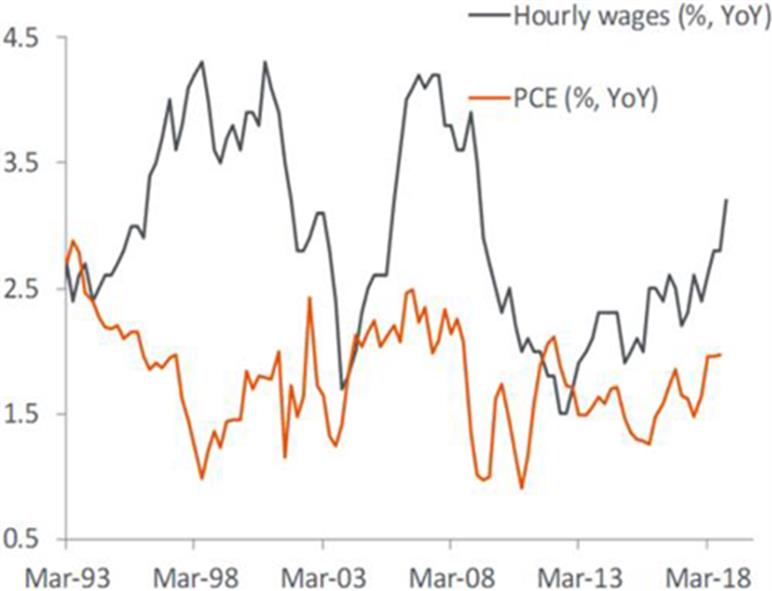
Exhibit 7: The link between wage growth and inflation, 1994-2018
Source: Piper Jaffrey, The Daily Shot
More on #4: The rise of populism
The Cambridge Dictionary defines populism as “political ideas and activities that are intended to get the support of ordinary people by giving them what they want”. In other words, if the man on the street feels his living standards are under pressure (as they are), he wants to blame somebody and, in today’s environment, that “somebody” is the immigrant who takes jobs away from ordinary people, or so the argument goes.
The fact that the real problem is something entirely different – namely how more and more of national income falls into the hands of capital at the expense of labour – has been lost on most people. Easier to blame immigrants and simply ignore the fact that unemployment is lower than ever!
Scrupulous politicians take advantage of this, just like Hitler abused the trust of the German people back in the 1930s when populism last spiked. Deutsche Bank runs a populism index which, better than words, illustrates why now has some very uncomfortable similarities with the late 1930s (Exhibit 8).
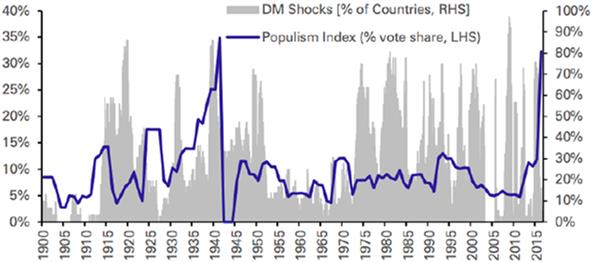
Exhibit 8: Populism index
Source: Deutsche Bank Research
I am not suggesting we should prepare for another Hitler – not at all – but I do expect something nasty to happen in the not so distant future. It almost always does when populist political leaders are roaming freely.
More on #5: Italy
Back in July 2018, I covered most of the issues facing Italy (see details here) and shall not repeat myself. Suffice to say that a combination of factors will put considerable strain on public finances in Italy and, sooner or later, something will have to give.
As you can see in Exhibit 9, Italy already spends nearly 4% of its GDP on servicing its vast amounts of public debt – more than any other OECD country – and debt will increase further in the years to come (for all the reasons I covered in the July 2018 Absolute Return Letter).
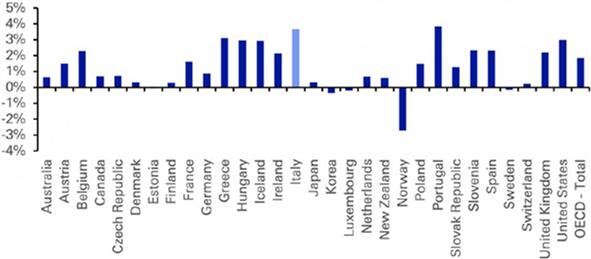
Exhibit 9: Net government interest costs (% of GDP)
Source: Deutsche Bank Research
It is difficult to say more precisely how it is all going to end but end it will. No country can afford to spend 5-10% of its GDP on servicing public debt for longer periods of time. Historically, Italy fixed its problems by devaluing its currency regularly but, as a member of the Eurozone, that is no longer an option. With a populist government in control, I fear the worst.
More on #6: Mean reversion of wealth-to-GDP
Long-term readers of the Absolute Return Letter will be aware that one of the eight structural mega-trends that drive our investment strategy and portfolio construction is a theme we call Mean Reversion of Wealth-to-GDP, and we think of it as the collective result of the other seven mega-trends.
Wealth-to-GDP is long-term stable and, as you can see in Exhibit 10 below, the US long-term mean value is around 380%, i.e. total US household wealth is on average about 3.8 times US GDP. The mean value varies somewhat from country to country, but it is long-term stable everywhere.
Think of the wealth-to-GDP ratio as a measure of capital efficiency, i.e. how much capital does it take to produce one unit of output? The lower the mean value, the more efficient a country is at utilising the capital at its disposal.
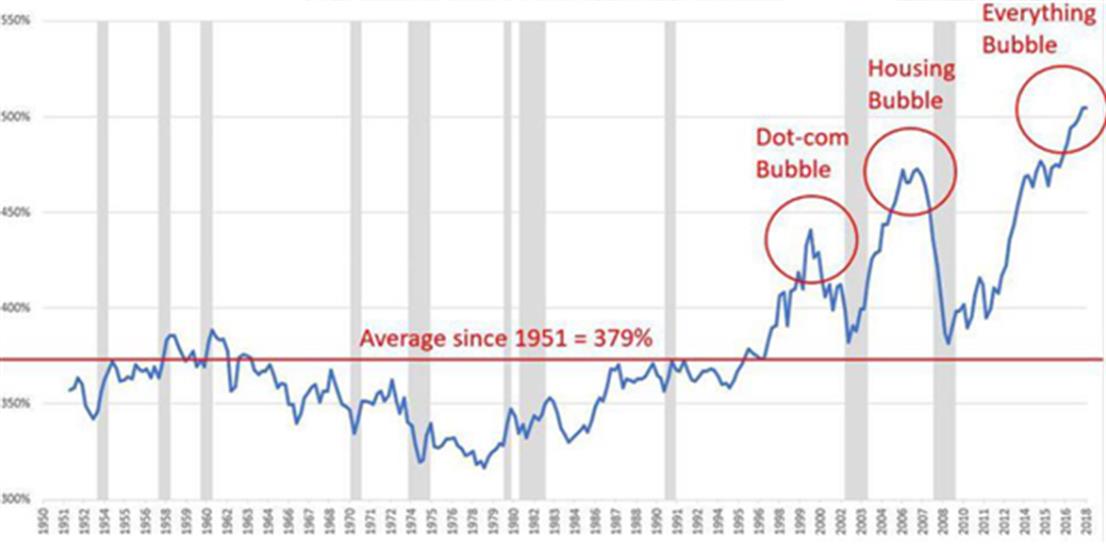
Exhibit 10: Total household wealth-to-GDP (US only)
Source: The Deviant Investor
Wealth simply cannot outgrow GDP (or vice versa) in the long run. The two must grow hand-in-hand longer term. I have seen US data going back about 150 years, and every time wealth-to-GDP has deviated meaningfully from 380%, it has mean-reverted. Every single time!
US wealth-to-GDP now exceeds 500%, i.e. it must drop 25-30% for the long-term mean value to be re-established. That can happen in two ways: either GDP grows faster than wealth for an extended period of time or 25-30% of all US household wealth is destroyed.
As we enter 2019, my concern is that the latter will happen, and that it will happen quite soon. Having said that, the economic theory behind says absolutely nothing about the timing of it all.
Final few words
I can smell a fish! Equities struggled in December with the S&P500 ‘enjoying’ the worst month of December for nearly 90 years. If you happen to disagree, I suggest you take another look at Exhibit 1.
Meanwhile, investors in various credit products are running for the hills for the first time in years. I should point out that the example used in Exhibit 11 below is just one of many I could share with you. The overall level of investor anxiety is clearly on the rise.
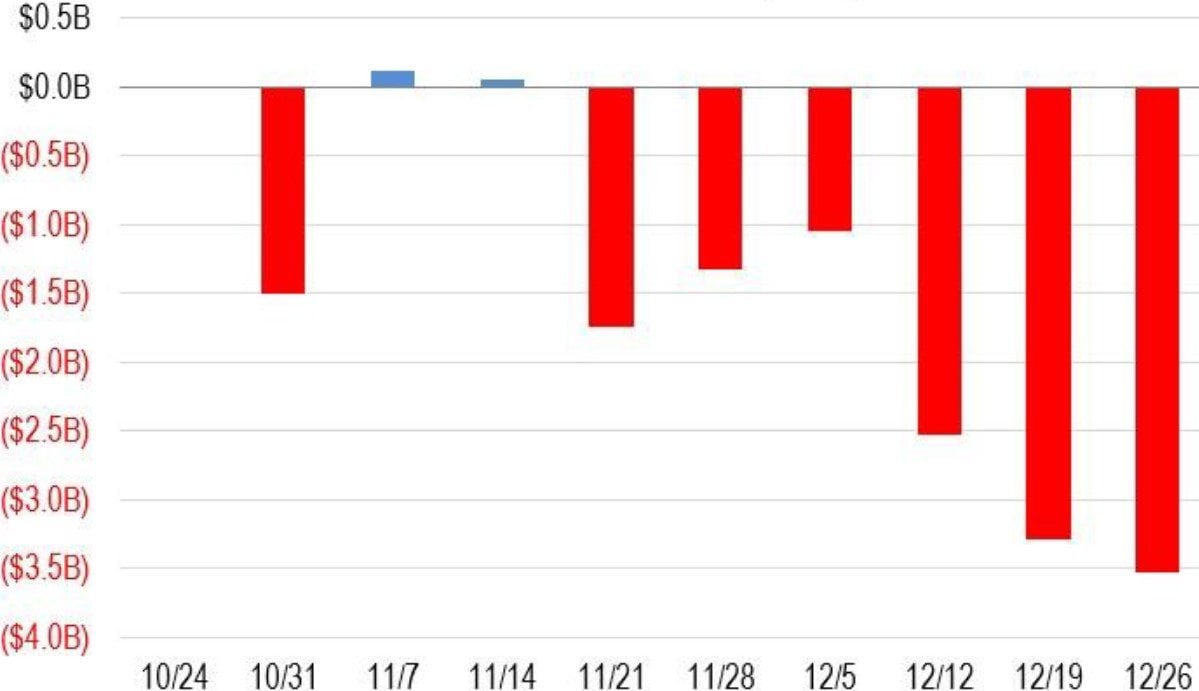
Exhibit 11: US loan fund flows (weekly data)
Source: LeveragedLoan.com
Many billions of dollars have been seeking refuge in short-dated instruments more recently (Exhibit 12). How it is all going to end is difficult to say. The optimists amongst us would probably argue that bull markets almost always climb a wall of worry, but you won’t get me on that one. After years of virtually uninterrupted bull conditions, it is time for some cleansing.
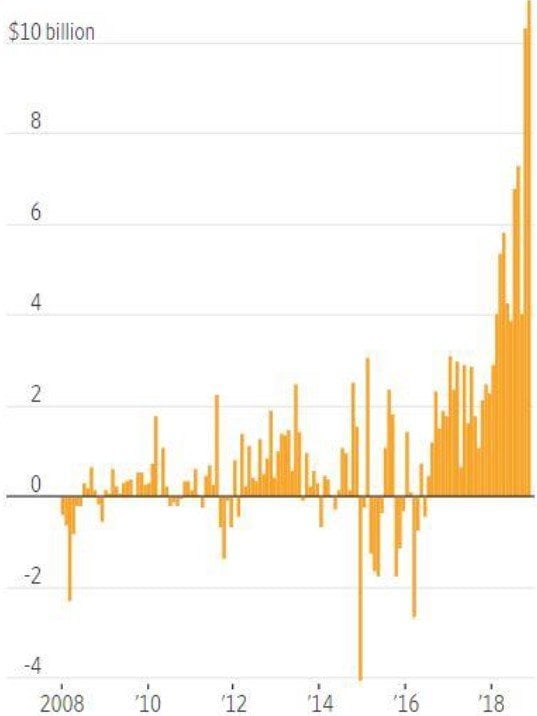
Exhibit 12: Non-institutional net flows into US ultrashort bond funds (monthly data)
Source: Wall Street Journal
And, if you argue that 2018 has already delivered that, I would argue that every great meal contains both an appetiser and a main course, and that we have not yet had the main course!
Niels C. Jensen
3 January 2019
Investment Theme: Mean reversion of wealth-to-GDP


