
Mittleman Investment Management commentary for the year ended December 31, 2021.
Q4 2021 hedge fund letters, conferences and more
Mittleman Investment Management’s Composite gained 4.9% net of fees in the fourth quarter of 2021, versus a gain of 11% in the S&P 500 Total Return Index and a gain of 2.1% in the Russell 2000 Total Return Index. Longer-term results for our Composite through 12/31/2021 are presented below. MIM Composite performance ranked in the top 1% of PSN’s global equity universe* since inception (12/31/2002) as of 12/31/2021:
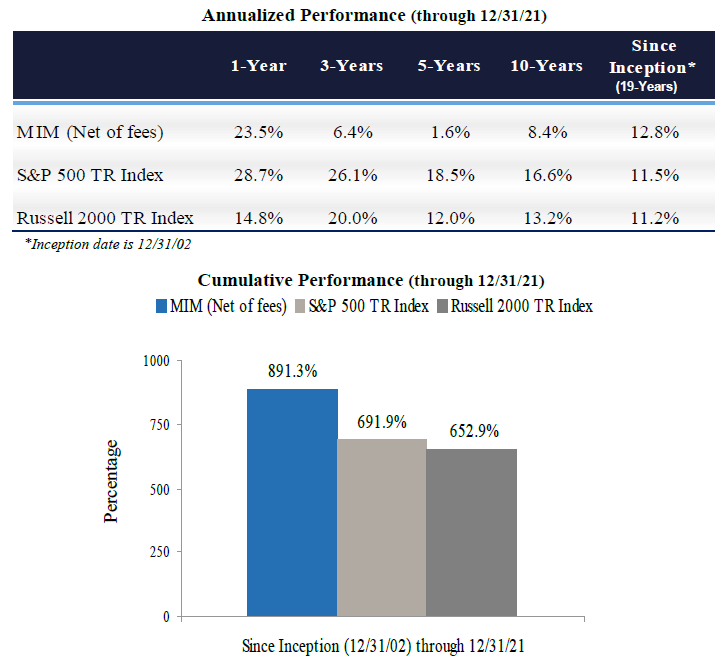
MIM’s Composite performance was +23.5% net of fees for all of 2021, vs. +28.7% for the S&P 500 total return index, and +14.8% for the Russell 2000 total return index. The global value-oriented investment disciple to which we’ve adhered since inception seems to be creeping back into favor, in fits and starts, and it is nice to feel a bit of a tail wind starting to kick in. Value investing seems to be regaining some fans as interest rates rise along with inflation, factors that have often been associated with value strategies outperforming. We expect that the return to out-performance for our style of global value investing, which began in November 2020 with our best month of performance ever (+42.9%), is still in the early innings. We are publishing this on the first day of February, after concluding the first month of 2022 up roughly 1.6% (preliminary, net of fees), with the S&P 500 down 5.2% and the R2000 down 9.6%, which is encouragingly reminiscent of a bygone era when value strategies like ours went up during broad market downturns. If such a paradigm shift is in fact upon us, history suggests it should last a while. So, we are looking forward to what this Year of the Tiger has in store for us.
Contributors/Detractors
The top three contributors to our Q4 2021 performance were Aimia Inc (TSE:AIM): US$3.41 to US$3.91 (+14.7%), Revlon Inc (NYSE:REV): $10.11 to $11.34 (+12.2%), and International Game Technology PLC (NYSE:IGT): $26.32 to $28.91 (+10.6% w/ divd).
The three most impactful detractors from Q4 2021 performance were AMA Group Ltd (ASX:AMA): US$0.32 to US$0.31 (-2.5%), Absa Bank Limited (JSE:ABSP): US$0.26 to US$0.23 (-11.7%), and Bayer AG (OTCMKTS:BAYRY): $13.60 to $13.26 (-2.5%).
Aimia
Aimia continues to make progress on its strategy to invest in public and private companies to yield superior returns for its shareholders. In Q4’21, Aimia’s share price was up 14.3% and for the year it was up 19.9% (all on a CAD basis). Since our first purchases of Aimia’s shares in late May 2017 a lot has changed, and those changes have yielded significant benefits to all of Aimia’s shareholders. While we are insiders now and can’t comment much anymore on the stock, suffice it to say that we believe significant value remains to be realized at Aimia, from both the market valuation getting closer to fair value as confidence grows in its performance, and from the fair value rising in the businesses in which Aimia has invested as they grow in value over time. For example, in October Aimia confirmed it was in discussions with Aeromexico regarding a potential PLM transaction, which if successfully consummated, would deliver substantial proceeds to the company. Also, in December, Aimia announced an additional investment of C$31.6 million in TRADE X, a global B2B cross-border automotive trading platform. Trade X is growing at a remarkable rate as they expand their market reach via acquisitions and grow their trading platform to other countries. Aimia remains a very large position for us, with the average portfolio weighting at approx. 24% as of 12/31/21, with the concentration risk mitigated by the diversity of assets inside of Aimia, and its net cash balance sheet. For more about Aimia please see their website: https://www.aimia.com/about-us/
Revlon
Revlon, while creeping up enough to make it our 2nd best performer last quarter, was still essentially wallowing around the $10 level where it began the quarter, despite a brief run-up to $17.65 in early November on seemingly speculative activity (the meme stock / Reddit mob have taken a liking to Revlon’s illiquid shares and periodically toy with it). The company remains over-leveraged but has been making progress on improving sales and margins and thus deleveraging.
We starting buying Revlon at around $10 in Dec. 2010 and enjoyed a nice run over the first 5 years, a period during which the business performed well. We sold some shares at around $40 in 2015 (only about 20% of our position, thinking the stock was worth $60+ then), but 2015 marked the last year in which it exhibited what I consider normal economics for this business (65% gross margin, 20% EBITDA margin, 3% maintenance cap-ex). So while it has been 6 years since that interim peak in business performance and stock price, and some hideously abnormal results in the interim period, we think the quality of the business remains largely intact, with Q3 2021 results creeping back towards normal economics (58% gross margin, 17% EBITDA margin), and a sale of part or all of the company remains a good possibility. We see Revlon as worth $27, 2.4x its year-end price of $11.34, at 14x EBITDA of $350M for 2022.
Adidas And Nike
There are a number of examples of high quality consumer brand businesses with multi-decade track records of endurance going through prolonged periods of underperformance before finding a way to rejuvenate themselves. Adidas (ETR:ADS, €253) went from an interim peak of €42 in Mar. 1998 to €22 in Mar. 2009, while Nike Inc (NYSE:NKE, $167) went from $5.53 to $11.72 over that same 11 years. But then over the next 10 year Adidas out-performed Nike, with a 26.3% CAGR vs. 23.6% for NKE, so the prior 11 years were not necessarily instructive. Of course, not all once great consumer brands regain their former glory, such as Schaefer beer, but we think Revlon (and its other owned brands, Elizabeth Arden, Almay, and American Crew among others) has the proven multi-decade resilience from which a resurgence can spring. And while Revlon is multi-national (50% of sales from outside U.S.), the core U.S. market for color cosmetics is rebounding strongly from the unprecedented drop in 2020.
International Game Technology
For the third consecutive quarter, International Game Technology was among the top three contributors to portfolio results. The company reinstated a cash dividend and announced its first ever share buyback program in Q4, both initiatives are modest in amount but a good start given how cheap the shares remain at 7.7x EBITDA and 11x FCF. IGT’s lottery business proved its resilience through the pandemic and continues to see strong growth. The slot machine business has also stabilized and sports gambling provides a tailwind of a large secular growth story that is under-appreciated with IGT. Their “PlaySports” technology is the backbone of 50 U.S. sports betting operations in 17 states, including the retail and mobile sportsbook for Resort World Las Vegas, and they are behind the scenes on many other high profile operators. We increased our estimate of IGT’s fair value to $39 during Q4 from $38 per share in Q3 (previously $29), which applies the same targeted EV/EBITDA multiple of 9x on estimate of 2022 EBITDA at $1.6B, and market cap. to FCF multiple of 14x estimated $550M in FCF for 2022, but with slightly lower net debt.
We believe our estimate is conservative as IGT’s closest peer, Scientific Games’ (SGMS) lottery business was recently sold to Brookfield Asset Management for 12x EBITDA ($6B / $500M EBITDA), and does not appear to be a better business than IGT’s lottery business (which is 80% of IGT’s overall EBITDA). https://www.gamingintelligence.com/finance/manda/146780-scientific-games-to-sell-lottery-business-to-brookfield-business-partners/ Applying the same 12x multiple to IGT’s lottery EBITDA would boost the value of IGT’s stock to about $55 per share, well above our $39 target and the $29 year-end price.
AMA Group
As for the top three detractors from our performance in Q4 2021, AMA Group, the largest auto collision repair company in Australia and New Zealand, led the pack but was down only slightly on the COVID variant Omicron weakness (less drivers on the road, less accidents) over the course of Q4. We discussed our thesis in the Q3 Investment Review so we won’t repeat here again, but believe it remains intact. Mobility trends show drivers getting back on the road, and business should return to normal very soon. Type “Australia” into the Apple.com mobility website and you’ll see driving is +30% over pre-COVID baseline, which would imply a much faster return to pre-COVID sales for AMA than we think is currently reflected in consensus estimates. https://covid19.apple.com/mobility
From AMA Group’s year-end price of A$0.43 (USD 0.31), we see upside potential of 79% to our A$0.77 estimate of Fair Value. A$0.77 = 10x EBITDAaL (pre-AASB 16) (est. for CY2023) of A$100M (10% margin on A$1B sales) = A$1B minus net debt of A$100M (excluding converts) minus A$20M minority interest = A$880M equity / 1,142M shares (fully diluted for converts) = A$0.77 per share Equity value = 17.6x FCF est. of A$50M.
AMA Group’s FY 2021 sales of A$920M represents 13% to 15% market share of the industry’s total revenues at their estimate of A$6B to A$7B annually. We estimate that AMA is 15 times the size (in sales) of its next closest competitor. For perspective, compared to AMA’s roughly 14% market share, the top 3 operators in North America (Caliber, Boyd/Gerber/ Service King) don’t add up to that much in terms of aggregate percentage market share. AMA is a roll-up following the template of Boyd Group Services (BYD CN, C$200), a Canadian firm which has been rolling up that industry in Canada and the U.S., generating a 35% CAGR total return for its shareholders over the past 10 years.
Absa Bank
Our 2nd biggest detractor from performance in Q4 was ABS-CBN Holdings Corp. PDR. My original thesis for ABS CBN was wrong. I had thought that a threatened but blatantly political cancellation of the most popular TV broadcaster in the country would prove too unpopular politically to attempt, but that is unfortunately what happened on July 22, 2020 when the company’s broadcasting franchise was not renewed, wiping out about half of the company’s business (the rest is broadband and content production). Our plan B was that the populace would not tolerate being unable to see their favorite shows for very long and would seek to watch them on ABS-CBN’s OTT or other offerings, and also that the broadband and content assets would cover us on the downside. My current estimate assumes a return to normal operations in 2023, and the stock price should anticipate that well in advance. The next presidential election in the Philippines is on May 9, 2022 and Duterte cannot be re-elected. Despite having been wrong about the broadcast franchise renewal, we did note that “…even if it were to transpire [the cancellation of the broadcast license], ABS-CBN could run their programming on a competing broadcaster’s channels, for a fee of course that would impair profits immensely, but such an outcome is already more than reflected in the share price.” That is happening, so they are getting their programming out there with block-time deals on TV-5 and another channel. ABS-CBN is a dominant collection of media properties, with decades of track record. In such a fast-growing country, it should not be trading in the open market for less than 4x normalized EBITDA today, when similar companies in slower growing developed markets trade for around 7x to 10x EBITDA and more. Obviously, the great upside here is dependent on a return to normal. Once the political punishment abates, we believe the stock should more than triple from year-end price of USD 0.23 (PHP 11.92). But even if ABS-CBN never gets back to its normal mode of operating, the broadband and content assets alone more than justify the current price, so we think it’s a great risk/reward ratio.
The company owns a 57.4% interest in privately held cable TV firm, Sky Cable, which has a 47% market share of the Philippines pay-TV segment. They have discussed possibly bringing that public at some point, to fund the rapid expansion to its market-leading broadband business, but now it could serve as a liquidity lifeboat if the broadcast shutdown persists too long. They also have a Netflix-like OTT offering, which is garnering subscribers rapidly in a region where Netflix is doing very well, but was not the first mover. ABS-CBN and its close competitor GMA7 dominate local content production, while Netflix provides the Hollywood content. ABS-CBN is controlled by the founding Lopez family, which holds a 55% stake via a family-controlled holding company, Lopez Holdings (LPZ:PM). Harvard graduate Oscar Lopez founded the company in 1956.
The Philippines’ population recently surpassed 100 million, and it is a very young population with a median age of 25.7, versus 37 for China and 38 for the U.S. Heavy spending on infrastructure should help sustain the recent 6% to 7% GDP growth rate there, as the Philippines becomes an increasingly attractive place for business versus higher-cost China. Manila has even displaced Mumbai, India as the second largest outsourcing destination in the world, with another city in the Philippines, Cebu, also making it into the top ten. Call centers are growing in the country due to the prevalence of skilled English-speaking workers.
Bayer
Bayer AG ADR was our 3rd largest detractor from Q4 performance but was off only 2.5%. The company is a sum-of-the-parts play, with crop science (#1 in seeds and crop protection), pharma, and consumer health each highly attractive businesses. We think fair value is more than double the year-end price of $13.26 at $28.50, which would be 11x EBITDA of €12B, and a mkt. cap. to free cash flow multiple of 16.7x €6B. Lawsuits over their Roundup weed killer (acquired when Bayer bought Monsanto in mid-2018) appear increasingly in the rear-view mirror, and a recent failed attempt by Unilever to buy Glaxo’s consumer health unit for a very high multiple strengthens the argument that Bayer’s is worth a lot, too.
Conclusion
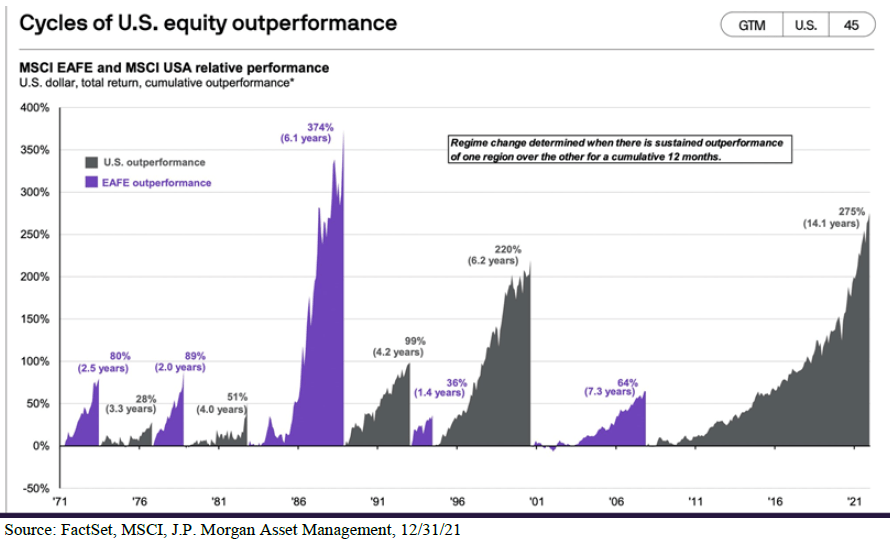
In closing, our progress in 2021 was satisfying but much more work needs to be done. The good news is that the more favorable environment now for value-oriented strategies like ours seems more conducive for us to get that work done. Also, a large part of our under-performance over the past few years has been due to our heavy foreign exposure (54% in late 2014 to 79% now), and as the chart below shows, the unprecedented run of U.S. stock market dominance over the past 14 years won’t last forever, and we outperformed by much more than the MSCI EAFE (in purple below) during the last time it was in ascendancy, the 7.3 years that began this century. But, we also outperformed during 2007 to 2014 when U.S. equity outperformance was just getting half-way through its current run, which shows that none of this stuff is determinative. If we buy a stream of growing free cash flow at a cheap enough valuation, no matter what the backdrop, we should end up very content over time. The point is that regime change can happen abruptly, as we saw with the shift to value that began in Nov. 2020, and while not a prerequisite for our strategy to succeed, the added potential is clearly great if the macro tide turns in our favor as well.
Sincerely,
Christopher P. Mittleman,
Chief Investment Officer
Mittleman Investment Management


