Dear Investors,
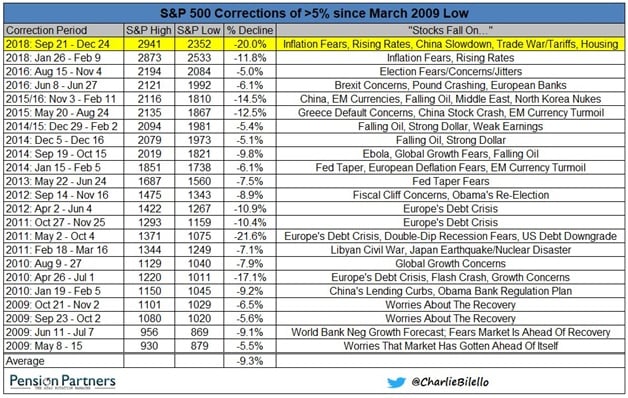
We are all used to the ups and downs of the stock market. Below is a table from Pension Partners, showing all the times the market declined by more than 5% since the financial crisis in 2008.
Looking back, we can see that most fears that caused the declines were silly. People were worried about anything and everything, but none of those fears materialized.

Q3 hedge fund letters, conference, scoops etc
Most clients realize there will be ups and down in the market. The big fear isn’t the frequent swings in the market; their worry is that we’ll have a big drop that takes years to recover.
It’s easy to see why this is a big fear. The last two recessions coincided with huge market drops. We had the 2000 dot com crash (and later a mild recession). The market dropped about 49% over a period of 929 days. It took about 7 years, until 2007, for investor to recover all their losses! During the financial crisis, the market dropped a total of 57% over a period of 517 days from 2007 to 2009. It took investors about 5 to 6 years, until 2012-2013 to recover all their losses.
We are not going to talk about the market in 1973-1975 because there is no real applicability to today. No worries that we will leave a currency/monetary arrangement (Bretton Woods) that we already left. There is no OPEC embargo causing real oil prices to go up by ~1000%. (The US is now almost a larger petroleum producer than OPEC anyway.)
Everyone is ok with ups and downs shown in the table above. It’s the big 50% drops that take almost a decade to recover from that keep investors up at night. But rational thinking is an antidote.
By understanding why we had those huge market drops and why they took so long to recover from, we can better understand when we need to be afraid and when it’s just another fluctuation that’s no cause for alarm in the long run.
The Dot Com Crash
Let’s start with the dot com crash, since it’s the easiest to understand. The problem here was pretty simple. People were too enthusiastic and bid stocks up to crazy valuations. Instead of valuing companies based on profits (and profit growth), people invented new metrics like “clicks” and “eyeballs.” To give you an idea of how crazy things got, one of the companies that made money and easily survived the crash, Cisco Systems, still hasn’t regained its high valuation during the dot com era.
In that time, the stock market traded at a high of 34 times earnings. That means for every one dollar in profit a company earned, investors were willing to pay $34 per share. The stock market’s historic average is about half that. That’s the reason the crash was so deep and took so long to recover from. The market as a whole was wildly overvalued.
Is that what we have today? No. Right now, the stock market trades at about 13.3 times forward earnings.
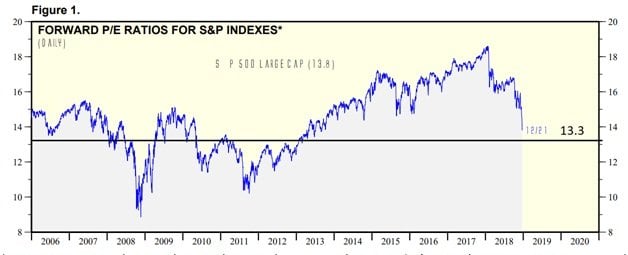
(Graph from Yardeni Research)
That means investors are paying just $13.30 for every one dollar a company is expected to earn next year. (We used next year’s earnings because the tax law skewed the current P/E.) As we can see in the table above, the 13.3 figure is low by recent historical standards. The market right now is probably fairly valued or perhaps a bit undervalued. We are a long ways away from being overvalued like the dot com era.
2008 Financial Crisis
What happened in the 2008 financial crisis? The one key component that made the recession so deep and the recovery take so long was private sector consumer debt.
What happened in years before 2008 was that households took on more and more debt, mainly in the form of mortgages and home equity loans or lines of credit. I’ve highlighted with a red arrow on the chart below how household debt as a percent of the economy took off starting in the early 2000s.
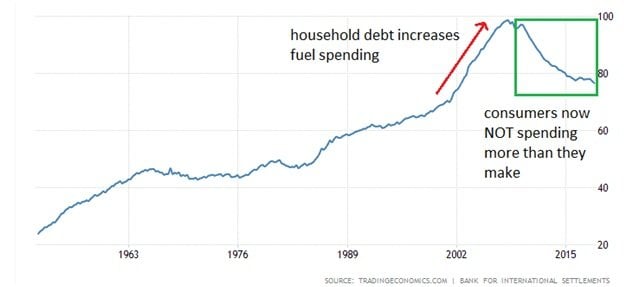
Remember from our previous newsletter that consumer spending makes up about 70% of the economy. That number also includes real estate. That means that consumers were borrowing money and spending that money, keeping the economy growing at a good pace. Eventually, those loans needed to be paid back. When the borrowing stopped and consumers started paying down debt, the economy collapsed. The biggest part of the economy, that 70%, was hit the hardest. That’s why we had the worst recession since the Great Depression.
Take a look at the graph above again. In the green box, I’ve highlighted what consumers have been doing since that recession. They’ve been paying down debt, and they are now spending from earnings, not from taking on more debt. This is healthy and infinitely sustainable.
That means, we do not have any of the underlying conditions needed for a collapse like in 2008. You and I don’t need to worry about that.
What Is Happening Now
What is going on with the market now? It looks like the market is really panicking over a number of things. Trump’s trade war (and the constant chaos in the administration), the prospect of interest rates going up, a partial government shutdown, a slowdown in China, some weakness in residential real estate, the UK’s Brexit plan, some slowing in Europe, and whatever else you want to throw on the list.
When looking at the US economy, we don’t see any major issues. Let’s examine some more real time (or almost real time) data. Here is intermodal rail (the big shipping containers) traffic data as of one week ago.
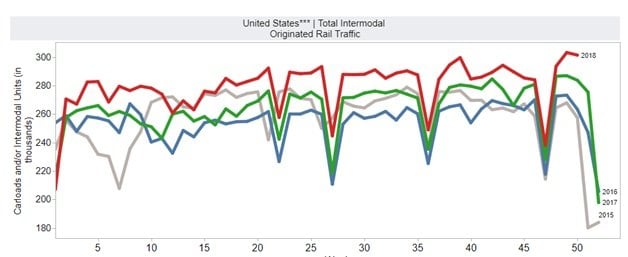
We can see that the red line for 2018 has spent the entire year comfortably above the past three years. That means there has been more rail traffic this year than the last three years. This is a good sign the economy is healthy.
We can also look at unemployment benefits in real time. As of Christmas Eve, the government has paid out $5.9B in unemployment benefits this fiscal year.
![]()
Last year at this time, the government had paid out $6.6B in unemployment benefits.
![]()
If the job market is strong and more people are working, then it’s hard to see how the economy will slow significantly. Remember consumer spending is about 70% of the economy. If more and more people are working and spending,how will we get a significant slowdown in that area? Indeed, it’s reported that this holiday, retail sales rose 5.1%, which was the best figure in six years.
Will we have a bit of a slowdown in business investment due to trade war and tariff uncertainty? Maybe. Although as of November, commercial and industrial loans have still been growing, which is a sign businesses are continuing to invest. Will auto sales continue to tread water? Maybe. Will rising rates slow down housing a bit? Maybe. Will the government shut down hurt things a bit? If it lasts long, sure.
We don’t know the exact path of the economy. But when looking at the big picture, consumer spending, the main driver of economic growth, is doing just fine. The government sector is also adding to economic growth (sans shutdown). The business sector looks fine now with a bit of a slowdown likely.
All in all, there is no reason to panic. None of the conditions that led to the dot com crash or the financial crisis are in place. You can sleep well knowing that I’m continuing to monitor the economy and your portfolio.
About Our Portfolios
The Capital Appreciation Fund and the Dividend Fund are innovative, investor friendly alternative to traditional actively managed mutual funds called a Spoke Fund ®. We can also customize portfolios for clients seeking less risk and volatility by including allocations to other asset classes such as bonds and real estate.
Spoke Funds are significantly less expensive and more transparent than a large majority of mutual funds. Both portfolios are managed for the long term using value investing principles. Fees for both portfolios are 1.25% of assets annually. That figure includes both our management fee and all trading costs. We try to minimize turnover and taxes as well in both funds.
Investor accounts are held in your name (we never take investor money) at FOLIOfn or Interactive Brokers*.
For more information visit our website.
*Some older accounts may be custodied at TradePMR.
Disclaimer
Historical results are not indicative of future performance. Positive returns are not guaranteed. Individual results will vary depending on market conditions and investing may cause capital loss.
The performance data presented prior to 2011:
- Represents a composite of all discretionary equity investments in accounts that have been open for at least one year. Any accounts open for less than one year are excluded from the composite performance shown. From time to time clients have made special requests that SIM hold securities in their account that are not included in SIMs recommended equity portfolio, those investments are excluded from the composite results shown.
- Performance is calculated using a holding period return formula.
- Reflect the deduction of a management fee of 1% of assets per year.
- Reflect the reinvestment of capital gains and dividends.
Performance data presented for 2011 and after:
- Represents the performance of the model portfolio that client accounts are linked too.
- Reflect the deduction of management fees of 1% of assets per year.
- Reflect the reinvestment of capital gains and dividends.
The S&P 500, used for comparison purposes may have a significantly different volatility than the portfolios used for the presentation of SIM’s composite returns.
The publication of this performance data is in no way a solicitation or offer to sell securities or investment advisory services.


