What are the (macro-)economic, geopolitical, and technical factors driving oil prices this week?
Crude oil settled on Wednesday at its highest level in nearly a month, boosted by another larger-than-expected drop in U.S. crude inventories. The prospect of a possible OPEC+ production cut announced by Saudi Arabia following a potential return of Iranian barrels into the market also played a part in this.

Q2 2022 hedge fund letters, conferences and more
Macroeconomics
On the macroeconomic view, the greenback went towards its highest level against a basket of currencies this week as the US dollar index (DXY) topped 109.270 on Tuesday – just getting close enough to its 109.294 top reached on July-14.

U.S. Dollar Currency Index (DXY), daily chart
Fundamental Analysis
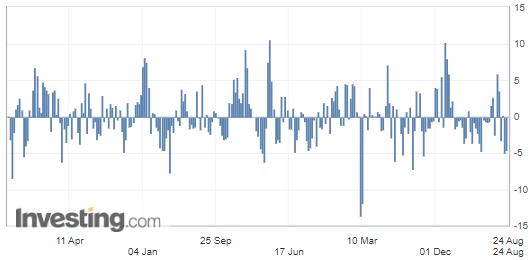
On Wednesday, the Energy Information Administration (EIA) released the weekly change in Crude Oil Inventories.
U.S. Crude Oil Inventories
During the week ended August 19, commercial oil stocks contracted by 3.3M barrels, while analysts were anticipating a lighter decline.

On the other hand, strategic oil reserves have lost 8.1M barrels, a record, according to Kpler. All in all, U.S. stocks, both commercial and strategic, are at their lowest level for nearly 20 years (since June 2003).

(Source: Investing.com)
This contraction in crude stocks is largely attributable to the high level of exports since the acceleration in European demand is helping to push up US exports and therefore lower inventories. Indeed, total crude and refined product exports reached an all-time high level last week – 11M barrels per day – 40% more than a year ago at the same time.
U.S. Gasoline Inventories
Regarding the U.S. gasoline demand figures, the market players were sensitive to the maintenance of gasoline inventories at an almost unchanged level, while analysts expected a drop of 1.5 million barrels over the week.

(Source: Investing.com)
This may trigger the effect of heightening concerns about an economic slowdown given that weekly gasoline demand figures have been very volatile throughout the summer.
Geopolitics
On the geopolitical scene, the negotiations around the Iranian nuclear deal, foretelling a return of Iranian barrels, were followed by the eventual prospects of OPEC+ members, which would cut their output in this eventuality, so it offset the bearish factor that I was mentioning last week.
Technical Analysis – Introduction to Regression Channels
On the daily chart, WTI crude oil (October contract) has just reached the upper band of the regression channel, set up as two standard deviations from the mean regression line. The latter being the best fit with a Pearson’s R coefficient of 86.5. For those who are not too familiar with this statistical tool, it just means that the regression-based (mean) trend line is defined with a correlation of about 86.5 % compared to the evolution of prices since the end of May. For a quick introduction to regression channels, here is a short video published by TD Ameritrade.
Therefore, the price area around $ 94.50, which also corresponds to the location of the 50-day moving average, could potentially be a good level to enter a short trade with a relatively tight stop and a price target providing a fairly good risk/reward ratio from a money management point of view. More details of this trade projection will be provided within our subscribers’ section.
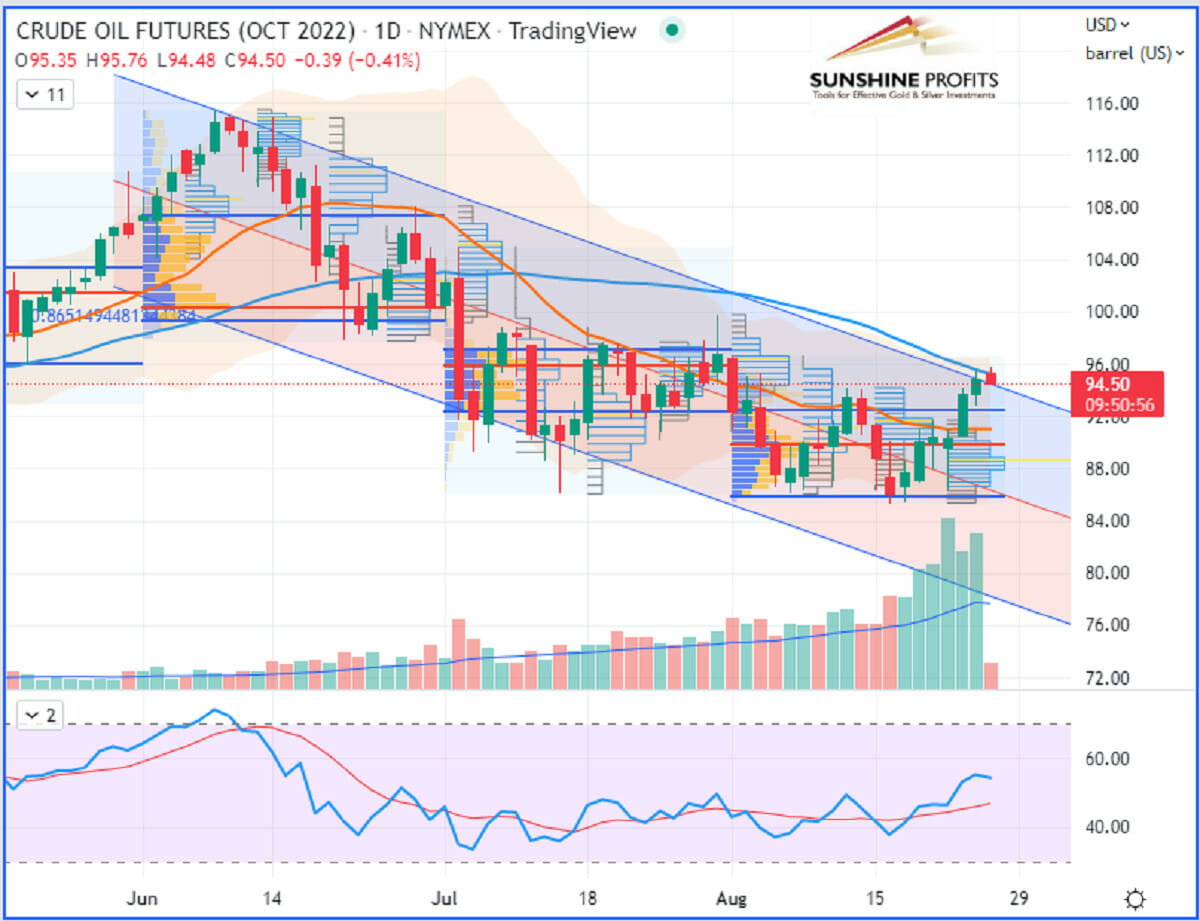
WTI Crude Oil (CLV22) Futures October contract, daily chart)

RBOB Gasoline (RBV22) Futures (October contract, daily chart)

Brent Crude Oil (BRNV22) Futures (October contract, daily chart) – Contract for Difference (CFD) UKOIL
Like what you’ve read? Subscribe for our daily newsletter today, and you'll get 7 days of FREE access to our premium daily Oil Trading Alerts as well as our other Alerts. Sign up for the free newsletter today!
Thank you.
Sebastien Bischeri
Oil & Gas Trading Strategist
The information above represents analyses and opinions of Sebastien Bischeri, & Sunshine Profits' associates only. As such, it may prove wrong and be subject to change without notice. At the time of writing, we base our opinions and analyses on facts and data sourced from respective essays and their authors. Although formed on top of careful research and reputably accurate sources, Sebastien Bischeri and his associates cannot guarantee the reported data's accuracy and thoroughness. The opinions published above neither recommend nor offer any securities transaction. Mr. Bischeri is not a Registered Securities Advisor. By reading Sebastien Bischeri’s reports you fully agree that he will not be held responsible or liable for any decisions you make regarding any information provided in these reports. Investing, trading and speculation in any financial markets may involve high risk of loss. Sebastien Bischeri, Sunshine Profits' employees, affiliates as well as their family members may have a short or long position in any securities, including those mentioned in any of the reports or essays, and may make additional purchases and/or sales of those securities without notice.


