Tollymore Investment Partners commentary for the fourth quarter ended December 31, 2018.
Dear partners,
In 2018 Tollymore generated returns of +4%, and an annualised performance since inception of +20%.

Q4 hedge fund letters, conference, scoops etc
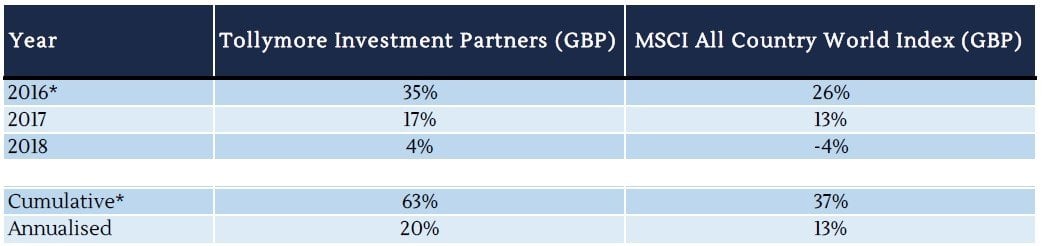
*Since inception on 12 May 2016, gross of adviser fees, unaudited
Over the past few years I have discussed Tollymore’s investment philosophy and process in detail in investment letters, interviews, articles and presentations. I have used investment decision making examples as a mechanism for current investors and prospective allocators to understand how I make decisions, and allow them to judge the consistency of these decisions with the key principles of the investment strategy.
As an emerging investment management firm Tollymore has the advantage of organically building a set of aligned investment partners, deeply appreciative and practically aware of the significant behavioural edge that a long-term mindset affords in public market investing; investors who think like business owners rather than traders.
Key elements of such a symbiotic relationship between manager and client are transparency, integrity and authenticity. As such, this letter delves deeper into the investment merits of the portfolio’s largest holdings, as well as the most recent investment. Understanding the intrinsic value potential of a portfolio allows successful money managers to stay the course in periods of self-doubt. By being transparent about the companies we own and why we own them I hope to give investors the tools to share my fundamental appreciation of the portfolio’s potential, allowing them to invest countercyclically to the ultimate benefit of the investment partnership’s capacity to sustainably create value for all partners.
The partnership’s four largest holdings, in alphabetical order, are Amerco, Gym Group, ITE Group and TripAdvisor. All four companies are founder-led2, provide enduring products and services, and have demonstrative capacity to generate sustained supernormal profits. They differ in their scope for organic capital reinvestment into valuable projects, and therefore the importance of the stock’s multiple of owner earnings in determining the potential IRR available to equity owners.
One thing they all also have in common is that they screen terribly. Reasons are various and are discussed below. Screens miss one of the most compelling sources of mispriced securities: those companies whose reported financials poorly reflect the underlying cash earnings’ power of the business, due to for example high reinvestment rates, inappropriate accounting policies or business model transitions. All such examples are described below.
Amerco (UHAL.US)
Amerco ticks all the boxes of a reinvestment moat, stewarded by excellent long-term business owners and capital allocators, and trading at a modest multiple of normal earnings power. The DIY moving market was essentially created with the founding by Leonard and Anna Shoen of Amerco in 1945. Today 40% of movers in North America are DIY vs. professional moving companies. Shoen spent decades signing up land-owner franchisees across North America, developing a network across the country which allowed users to collect vehicles in one location and drop off at another, facilitating ‘inter-city’ house moves.
U-Haul, the brand behind Amerco, has made the most of its first mover advantage by aggressively expanding its network of franchised moving service locations. Each additional location increases the value of existing locations by enabling more convenient pick up and drop off logistics for an increasing number of moving routes. This should increase the steady state asset utilisation of the business. Franchisees are attracted by the number of U-Haul customers; customers are attracted by the convenience of franchise locations. This virtuous circle drives market share and revenue growth, which has been reinvested in more locations and vehicles, making U-Haul’s dominance increasingly difficult to replicate. Today U-Haul as eight times as many locations as its nearest competitor, and four times as many trucks. Management has clearly identified the source of the moat for this business and has continually reinvested capital in widening it over time. This network advantage limits the ability to add supply in the ‘one-way’, inter-city moving market.
Trucks are necessary for moving but people move infrequently; these characteristics lend themselves to a rental business model. Moving depends on idiosyncratic factors such as the need to upsize, downsize, get divorced, get married, move jobs, attend and leave college etc. The need for more affordable housing is a significant reason for moving, likely a countercyclical driver of volumes. If humans live in houses, regardless of how those houses are financed, and if changing life circumstances cause them to move homes several times through their lifetimes, none of these drivers of demand is set to change materially long into the future. It is very possible, however, that Amerco captures an increasing share of the total costs incurred in making these moves.
Another example of management directing capital to widening the business’s unfair advantage is the development of MovingHelp.com. Movinghelp.com is a platform bringing together supply of and demand for moving labour. As the number of providers of labour grows, the more users are attracted by greater availability. The accumulation of independent reviews also creates stickier supply and encourages better customer service, increasing demand.
The U-Haul brand is well-recognised and ubiquitous; there are 65% more U-Haul locations in the North American network (20k) than there are Starbucks coffee shops (12k). The orange and white livery and U-Haul logos adorn its 100k trucks, 80k trailers, 20k truck rental nodes and 1,100 storage locations, serving as a free mobile and ubiquitous advertising machine.
Since its inception U-Haul has grown its dominance in DIY moving. Several competitors have tried to enter or grow in the space, but none has succeeded in denting U-Haul’s market share. The industry has consolidated down to three main players today: U-Haul, Budget Truck Rental and Penske Truck Rental. Budget generates 15% of the revenue of U-Haul with a truck fleet one quarter the size and has been retrenching. highlighting the economies of scale in the industry and U-Haul’s network advantage.
The other major use of the company’s operating cash flow has been the purchase and greenfield development of self-storage facilities. Like truck rental, self-storage is a commodity offering. The site acquisition and build costs are low, lowering barriers to entry. Hence there are many players in a fragmented industry. As fixed costs are high there may also be the temptation to cut prices to fill capacity. However, once tenants are secured, switching costs are high and so rent increases can be imposed. This, coupled with low maintenance costs and high operating leverage, mean that returns can ramp up quickly. Amerco can use its U-Haul brand and ability to hook truck customers into the sales channel via its website to lower self-storage customer acquisition costs. This potentially lowers Amerco’s self-storage breakeven price and occupancy vs. peers.
I think several factors suggest that the company’s capital can be deployed at high incremental returns: a wider economic moat, industry consolidation, capital reinvestment into very high margin self-storage services, operating leverage, and declining labour intensity as technology lowers the cost of generating business.
Multiple avenues for earnings’ growth suggest that owner earnings’ reinvestment rates can continue to remain high for a long time:
- Continued share take in the self-moving market (less than half of the total moving market). Truck rental is subscale for existing players. Budget has been scaling back its fleet and Penske, the nearest competitor, has 10% of the number of locations U-Haul has. The overall moving market is c. $15bn (U-Haul is less than one quarter of this).
- Encroaching into the professional moving market (>50% of the market), which a fragmented, and therefore largely local, industry. There are 7k companies represented by the American Moving and Storage Association alone, representing 14k locations across the US. Half of these businesses employ fewer than five people. The sustainability of the professional moving segment seems threatened by the scale of U-Haul’s network, provision of moving helpers through Moving Help, and the potential introduction of autonomous vehicles. The investments into Moving Help could be a significant enabler of this.
- Finally, the self-storage industry is twice the size of the moving industry, c. $30bn. This is a fragmented market in which there are synergies with the moving business. Given these two factors, it is possible that certain storage assets are worth more to Amerco than other bidders. Amerco can rebrand the acquired facility with the ubiquitous U-Haul logo and link it to its online reservation system, immediately connecting the assets to Amerco’s large customer base. None of Amerco’s competitors, either in the self-storage or the moving space, can exploit this synergy to the same extent.
Since we initially acquired shares in February 2017 for $370 per share, the stock has fallen 9%, materially lagging the market over the last two years. There have been several short-term pressures on Amerco’s profitability over this period. There has been some pressure on operating profit margins due to the acceleration of truck and self-storage asset expansion and the tweaks to the company’s depreciation policies to front load tax-deductible depreciation ahead of the corporation tax reductions. The fleet increased 10% yoy in 2018 but management expects this to be roughly flat in FY19 as truck acquisition slows and used truck sales pick up. EBITDA margins however continue to improve.
Asset utilisation has been constrained by low occupancy rates on self-storage assets and lower truck fleet utilisation. However, self-storage square footage has increased 50% over the last three years and the CFO on the call stated that revenue per square foot continues to rise 3-4% yoy and the average occupancy on units older than three years is 84%, vs. 39% for units younger than three years. Given lofty self-storage market prices, UHAL has been focused on a build vs. buy growth strategy, with its associated larger drag on average occupancy. Finally, a collapse in used truck disposal profits was due to an effort to slow down sales and maximise the depreciable asset base ahead of the corporation tax rate change, and poor execution in underwriting the sale of waiver insurance, incurring elevated repair costs in getting vehicles into a sellable condition. The elevated disposal profits are something we highlighted in our original research and normalised for in the owner earnings calculation.
Listening to Amerco’s investor conference calls is instructive. Some comments from participants on recent calls reflect a level of frustration at the long-term horizon of management’s capital allocation choices, pleading for the installation of a regular dividend and buyback. I disagree. A dividend should be the last thing this company is doing, and despite the stock failing to remotely keep pace with the market’s rally over the last few years, a buy back would shrink an already small free float. My sense is that management is making capital allocation decisions that are designed to maximise the total future economic value of the business. I don’t care whether this is realised later vs. sooner, if the company’s investments are returning more than our opportunity cost of investing. With the company’s widening moving and storage network advantage and a CEO who is paid < $1mn per year but whose family owns most of the business, I think this is likely to be the case.
Over the last 12 reported months of business operations Amerco generated operating cash flow of almost $1bn. Amerco’s enterprise value is less than 9x this number. With capex of over $1.7bn Amerco is currently generating FCF of c. -$700mn. Adjusting for c. $1.1bn of growth capex, maintenance FCF = +$4-500mn, a 6-8% yield to the market cap for a business with evidence of high cash reinvestment rates and high incremental returns on capital.
GYM Group (GYM.LN)
Gym Group enjoys a cost advantage facilitated by superior asset utilisation and a long runway for value accretive asset growth. GYM was founded in 2007 and is today the second largest low-cost gym operator in the UK. It runs 150 gyms and has 700k members. All revenues are generated from membership fees and joining fees. The company has a sense of purpose/coherent mission, which is to help people improve their wellbeing, whatever their fitness of financial starting point or location. The fact that consistently 30% of new members have never been a gym member before suggests this mission is being accomplished. This is a relatively capital-intensive business. However, while 30-40% of revenues are spent on capex, c. 4-6% of revenues relate to maintenance capex.
GYM is a market leader in a fragmented industry: There are over 2k private gym operators in the UK, running 3.7k private gyms. The ten largest operators account for c. 650 gyms, 18% of the total number of private gyms, and GYM accounts for c. 4% of all private gyms. The low-cost gym model has grown rapidly by addressing the barriers to gym membership: (1) high membership cost and (2) being tied into contracts. The proposition of “high quality, low cost” appears to be well received: GYM’s net promoter score is very high: +60. 55% of new members come from referrals.
GYM can profitably offer average memberships 60% below private sector averages due to higher utilisation of site space (170 stations per gym vs. 60 private market average, and limited wet/racquet/café facilities/24-7 opening hours) and the employment of technology rather than employees for customer sign up and management. Customers enter the gym via a PIN entry system. The joining process is online, or via on-site internet connected kiosks, lowering customer acquisition and management costs.
In reviewing thousands of potential sites over the years GYM has developed relationships with landlords and property agents. It is conceivable that the brand and GYM’s strong covenant rating may be competitive advantages when it comes to securing new sites with landlords.
Low cost gyms have been growing 50% pa but low-cost gym membership in the UK is still only 3%. Low cost gyms in the UK are 8% of the total. In the US and Germany half of gyms are low cost (and rising), accounting for the higher gym penetration rates in those markets. The low-cost segment in the UK has both taken share from the traditional segment and grown the market (in every year since 2008 >30% of new GYM members have not been a gym member before). This has resulted in low cost club CAGR of >50% since 2011. Initial site investment costs have declined as a result of economies of scale. Gym fit-out contractors are awarded contracts through more competitive tender processes, better terms are agreed with equipment suppliers and service providers such as cleaning. The economic return on marketing spend has improved as the number of sites and members has grown.
Estate maturation should improve margins: Average mature site EBITDA margin/ROCE is 47%/32%. Yet the average site EBITDA margin is 40%, and the EBITDA margin for the group is 30%.
In my view the principal risks that may cause the future to unfold in a less favourable way than the above analysis anticipates are: (1) member churn/customer response to real disposable income erosion; (2) input cost inflation, and (3) irrational and aggressive competitive reaction.
Churn and customer demand elasticity: members can cancel without charge at any time. To re-join would incur a £20 fee. Annual membership attrition (cancellations net of re-joiners) is 100%; 30% of leavers re-join. Management has stated that it does not consider cancellation to be a KPI for the business. This is for two reasons: (1) Cancellation improves membership yield as new members join at higher prices than cancelled members. And (2) the cost of acquiring a new member is less than the joining fee. This is due to marketing economies of scale and word of mouth recommendations (more than half of new joiners are costless referrals).
Competitive response: Mid-tier gyms may cut their membership fees to compete with the increased popularity of low-cost fitness clubs. However, despite prices 60-70% below mid-tier gyms, GYM’s margin profile is vastly superior. This is also despite having a lower percentage of the estate comprising mature gyms vs. established non-growing mid-tier competitors. Mid-tier and premium competitors have lower margins than GYM. This lowers their headroom for profitable price cuts. The competitive response from the mid-tier/premium segment seems to have been benign. Mid-tier/premium operators have upgraded their service to warrant the premium they charge and/or have increasingly targeted the top end of the market which they argue is not addressed by the low-cost segment. Mid-tier and premium gyms have consistently increased their fees each year. One mid-tier operator, Fitness First, did attempt to create a low-cost arm, opening Klick Fitness in 2012 with 6 gyms. Just over 12 months later the group exited the sub-sector. The mid-tier peer group has been restructuring, with consolidation on-going in the market.
Leverage/recession risk: In the event of a recession prices and memberships may erode. GYM has high financial gearing in the form of operating lease obligations. Given GYM’s operating leverage mature site profitability would fall significantly should the business experience a marked revenue decline. I estimate that a 20% drop in revenues would reduce the owner earnings to £17mn from £40mn in a no-growth scenario. This is still a 5% yield to the current market cap. Current adjusted net debt/EBITDAR = 3.5x; assuming the maintenance profitability of the estate this is 2.5x. This would be 6x with a 20% revenue decline assuming zero capacity to cut 100% fixed costs, or 3.8x based on maintenance profitability. Under these assumptions GYM’s EBITDA margin would be 13%/ and maintenance EBITDA margin 35% vs. the current 30% rate (and 47% mature gym rate). It is difficult to envisage a 20% revenue decline due to the immaturity and increasing penetration of low-cost gyms, as well as the 60-70% price discounts vs. mid-tier competitors. When US membership growth was negative in 2012, Planet Fitness still grew its memberships by 28% yoy. This might suggest that the large discount lowers the price elasticity of demand for budget gyms.
High reinvestment rates mean GYM screens poorly: With a P/E ratio of 47x and a FCF yield of negative 4%, many investors will write off GYM’s investment merits. However, owner earnings3 c. £40mn, a 12% yield to the current market cap.
These owner earnings are largely being directed to clearly above cost of capital projects. I estimate the total capitalised costs per new site are c. £1.5mn, and the economic profit per gym is c. £0.3mn, leading to after tax returns on incremental capital in excess of 20%. So, for every pound of owner earnings invested, GYM can create £2 of value. Unfortunately, the board has a progressive dividend policy with a 10-20% payout ratio target. With the company’s unit economics and runway for growth I would prefer that 100% of earnings were reinvested in asset growth. However, 10-20% of reported earnings will be much lower than 10-20% of owner earnings. If 90% of owner earnings are reinvested an equity investment in GYM could yield annual returns in excess of 20%.
ITE Group (ITE.LN)
What should a demanding investor be willing to pay for:
- A simple, founder-led business.
- A provider of an enduring service, reflecting a business practice which is hundreds of years old with a high utility to cost ratio.
- Geographically and industrially diversified end markets.
- UK headquartered and listed enterprise.
- Capital intensity of 1-2% of annual revenues.
- Strong FCF conversion of earnings due to deferred income balances 50-70% of revenues.
- Average through cycle returns on capital of around 30%.
- Defensible moat facilitated by two-sided network effects barriers to entry.
- Revenue visibility, with two thirds of following year’s sales forward booked.
- Conservative capital structure.
- Organic revenue growth of 11%.
ITE is involved in one business activity: it organises exhibitions and conferences. ITE hires venues and gathers a group of exhibitors and visitors, monetising the exhibitor side of the network by charging companies for floor space. The company operates across several sectors including construction, food, energy and travel and tourism and predominantly emerging market geographies.
While multi-year agreements can be struck to secure venue capacity, these agreements have the flexibility to modify capacity commitments ahead of changes in demand. There is good revenue visibility thanks to forward bookings.
Operating margins have been reasonably stable due to moderate operating leverage, but current levels of operating profitability of c. 22% are around 5ppts below mid-cycle levels. Some of the margin run off has come as a result of deferred revenue increases, with exhibitors securing their participation at future events at more competitive rates. What therefore may be surrendered in terms of income statement profitability is recovered via working capital inflows and FCF conversion. Despite this, as we will discuss, management has a plan to restore the business to operating margins in the high twenties.
ITE is an appropriately capitalised business given high revenue visibility, strong repeat business and multi-year agreements. Despite £50mn of debt funded M&A in FY18, net debt = £80mn, 1.4x EBITDA, two years of FCF and around one quarter of ITE’s equity. Revenue is recognised at the completion of an event; cash is received from exhibitors in advance and booked as deferred income. This is a costless source of finance and represents a working capital inflow when revenues are growing (but a drag on FCF when revenues decline, as they did FY15). This deferred income float has typically been c. 40% of sales, but since the founder of the business returned as CEO this has grown to two thirds, strengthening cash conversion.
A long track record of supernormal profits seems to emanate from two sources of competitive advantage: (1) Network effects: visitors are needed in order to attract exhibitors and vice versa, making it difficult for a non-established player to gain traction. And (2) intangible assets: trademarks and licences to operate venues, databases of consumers and exhibitors, brand reputation that makes participants reluctant to move away from a tried and tested event. The value chain is symbiotic: customers do not want competing trade shows; they want to know that their customers are going to be at the event they are attending that year. This is a form of efficient scale; there is only space for a handful of profitable operators within each region and industry niche.
I have classified this as a legacy moat business (rather than a reinvestment moat or a capital light compounder) due to the lack of greenfield organic opportunities to build new exhibitions around the world. However, ITE does have a strong foothold in several emerging markets including China and India. ITE has established market leading positions through fully owned subsidiaries and controlling interests in locally dominant exhibition brands. For example, it has a controlling stake in the market leading conferences business ABEC in India which runs 20 exhibitions across the country. ITE has offices in Beijing and Shanghai, operated through a JV with Hong Kong based Sinostar. ITE also runs conferences across Indonesia via a JV partnerships and wholly owned subsidiaries.
The organic growth trajectory has inflected positively, partly due to the economic stabilisation in a number of ITE’s end markets, and partly due to a business improvement programme put in place as a result of a change of CEO in 2016.
A series of macroeconomic and geopolitical shocks have beset ITE’s end markets and impeded business progress in the three or four years prior to 2017. These included the Russia-Crimea crisis and resulting trade sanctions at a time when Russia was a much larger part of ITE’s business, and a 70% collapse in the price of oil harming business in ITE’s energy-dependent central Asian markets.
This improvement in top line growth should bode well for the capacity of the business to meaningfully increase underlying cash generation, especially given the strides management is making in collecting cash for conference pre-bookings. As we will discuss, the market implies that the exact opposite will happen; that the sustainable cash the business can generate will wither significantly, and the stock has continued to move in the opposite direction to the business’s progress.
As legacy moat business with limited opportunities to build new shows organically, M&A will always be part of management’s capital allocation agenda. It is therefore important to understand the management team, their track record and incentives. The founder Mark Shashoua has returned to the business with a plan to improve the organic growth potential and profitability of the current portfolio. He is divesting the least profitable, sub-scale events. He has executed this transformation playbook at i2i Events, which enjoyed a doubling of revenues and profits before being acquired by Ascential Events under his five-year leadership prior to returning to ITE, the company he founded in 1991.
In 2018 ITE announced the acquisition of Ascential Events Limited from Ascential plc, based on an EV of £300mn. The target assets comprise two global exhibitions brands, Bett and CWIEME, and several UK exhibitions brands such as the Spring and Autumn Fairs and Pure. The CEO and COO of ITE Group are very familiar with these assets; they ran them together 2011 – 2016 as CEO and CFO.
Management incentives have improved with the management change and are reasonable but not standout. Base salaries for the CEO/CFO are £450k/£250k. Bonuses are a function of headline PBT, organic revenue growth, cash conversion and qualitative strategic targets. LTIP awards are based on recurring EPS and relative TSR versus a combination of the FTSE Small Cap and FTSE 250 Index constituents. What is interesting is that ITE’s earnings per share need to grow by 75% over the next two years for any of the LTIP to vest. For 100% of the LTIP to pay out ITE needs to generate EPS of 14.4p by September 2020, almost treble the FY18 EPS, and a 25% yield to the current share price.
All these measures were only introduced in 2017. While cash conversion is a sensible target, some measure of incremental returns on capital would be a welcome addition to the incentive programme, given the high cash generation of the business and the limited obvious long-term redeployment opportunities. I would say that the track record of the new leadership and some incentive framework progression are improving stewardship of a demonstrably wide-moat business that has suffered macro headwinds which have shown signs of dissipating. This is not a turnaround thesis; this is a fantastic, highly profitable business already, and one that can benefit from three tailwinds: (1) cyclical/macro mean reversion, (2) structural portfolio improvement driven by positive management change, and/or (3) a potential re-rating of the shares to reflect the former drivers.
The share price has collapsed since 2014 due to a series of macro and geopolitical events including the Russia/Crimea crisis, oil price collapse and rouble depreciation.
The share price has fallen by 50% in the last year to a 52-week low. More recently the company has suffered non-fundamental selling pressure as the portfolio has become much less emerging market focused. In my view the company’s stock price has moved in the opposite direction of the business’s performance and private business value.
ITE’s cash flow and owner earnings are materially higher than reported earnings per share due to a large deferred revenue float, impairments of prior capital allocation decisions and amortisation of quasi-permanent assets such as customer relationships and internally developed brands.
Trailing FCF of the business is c. £30mn (adjusting for restructuring costs and biennial events); this is 25% of ITE’s equity and debt funding and 19% of core Group revenues, excluding the contribution from Ascential. Organic revenue growth is running at double digit levels.
So that is what the business is generating. How is the market pricing that? The current £450mn market cap accounts for a £265mn rights issue-funded acquisition completed in the summer. So, the market is valuing ITE’s pre-acquisition cash flows at a 16% yield. This implies material FCF erosion in the core business or zero or negative FCF margins in the newly acquired assets. Or that ITE has massively overpaid for Ascential.
This despite the core business recording 11% organic revenue growth in 2018 and the acquired assets, which ITE’s management believe have been poorly managed, generating 31% EBITDA margins.
So, did ITE overpay for the deal? They believe they are paying 11.5x EV/EBITDA for an ungeared business that can grow revenues double digits. That seems reasonable. In the case of zero revenue or cost synergies they are paying 12.5x EV/EBITDA for a business with high barriers to entry and capex intensity of 1%. I don’t think that is expensive. It may just be the case that ITE is a better owner of this business because it is a core asset for them vs. non-core for Ascential. This is consistent with the comments Ascential have made about the deal (and with Mr. Shashoua’s prior comments to me about Ascential not being a strong competitor as the company focuses on its data and analytics businesses).
The market is not paying attention; I have spoken with large institutional owners of the shares appearing near the top of the register; for them ITE is a small part of a diversified portfolio and their understanding of the deal and management’s prior history with the assets reflected that. A conservative appraisal of private business value would imply 70% upside to the current price. That is if we capitalise the trailing FCF generation of the core business at 6% and add the rights issue capital we arrive at an owner’s value of £750-800mn. The global industry is projected to continue to grow at 5% pa, with many of ITE’s markets expected to grow high single digits. This would also imply that management miss their own goals and LTIP targets substantially, as previously discussed. In fact, management is targeting (and is over-executing) high single digit revenue growth, margin expansion and large working capital inflows; this would result in FCF compounding 1.5x revenue growth.
TripAdvisor (TRIP.US)
One- and two-sided network effects and a globally trusted, top-of-funnel, brand strongly position TripAdvisor to take an outsized share of the growing global online travel market. I have discussed my views on the TripAdvisor investment case in prior letters, so I won’t repeat them here. TRIP continues to strike me as a good example of investors’ inappropriate application of linear projections to platform business models. TRIP’s potential for potentially explosive low-cost growth emanates from its ability to tap into existing demand (travel and leisure visitors) and connecting it to acquired or developed supply (Viator, La Fourchette). Therefore, TRIP is strongly positioned to be the winner in two winner-take-all markets: restaurants and attractions. For both restaurants and attractions, the number of reviewed items is multiples higher than the number of bookable items. These low penetration rates of bookable inventory (1% for restaurants, 8% for attractions) will provide a long volume growth runway.
Adjusting the company’s trailing FCF for stock-based compensation, TV advertising and non-hotel investments (assuming OpenTable margins achievable on a normalised basis), I estimate the business is generating c. $400mn of owner earnings, a 6% yield to the current cash-adjusted market cap, and c. 60% of invested capital. It’s clear that the opportunity and capital allocation priority for the business will remain reinvestment for a long time. If (1) for every $100 we invest in TRIP it generates $6 of owner earnings, and (2) that $6 is all reinvested into projects which generate a recurring $3.60 pa, then TRIP has generated $36 of value, capitalised at our opportunity cost of 10%. Assuming average incremental returns on capital of 25% over the next decade and that three quarters of earnings are reinvested yields an IRR of c. 20%, and TRIP would be worth c. $40bn over the next decade.
I have written in the past about the importance of being able to execute a long-term investment strategy. The portfolio management decisions that I have taken, and documented, relating to our ownership of TRIP shares since September 2016 are an example of the freedom that a sound investment process, appropriate working environment and philosophy aligned to manager temperament can afford in making decisions that are consistent with our stated investment philosophy. TRIP’s quoted share price at the end of 2018 was $54, c.11% lower than our initial acquisition price in September 2016. Yet TRIP’s positive contribution is responsible for c. 8% of the cumulative performance of the portfolio since inception, thanks to an environment and investor base that allow us to make investment decisions which are consistent with a long-term business owner investment philosophy; that is to average down in the face of short-term market pessimism and reduce exposure in response to excessive exuberance.
New portfolio investment
In December 2018 we acquired shares of Trupanion (TRUP) at a price of $23.3 per share. TRUP is a founder-led, simple one-product-one-geography business with single-minded focus on a niche service. TRUP has a superior value proposition and strong competitive position afforded by gestation of distributor relationships, a data flywheel and customer switching costs. It operates in a large addressable market with a significant penetration opportunity affording a potentially multi-decade runway for compounding owner earnings. It may come as a surprise that TRUP is also an insurance company.
TRUP provides medical insurance for cats and dogs in the US and Canada. The problem that Trupanion is trying to solve is that it is difficult for pet owners to budget for the magnitude and timing of pet illness and injury. Pet owners do not know the average costs of pet healthcare for the pets that they own. Even if they did, they would not know if their pets will be lucky or unlucky for that breed and location.
Trupanion’s solution is a cost-plus insurance product which spreads the risk that the customer’s pet is unlucky by subsidising unlucky pets with lucky pet premiums. Like any insurance product Trupanion allows customers to budget for the unpredictable timing and magnitude of loss, in this case pet healthcare costs.
The distribution of TRUP’s insurance products is primarily through vet and customer referrals. TRUP uses a network of c. 100 independent contractors called ‘Territory Partners’ to build long term relationships with vets; they are responsible for making vets aware of the benefits of TRUP’s products to the vet’s customers, with the goal of earning the trust of the vets.
Like any insurer, TRUP must estimate and hold reserves for vet invoices which have been incurred but not yet submitted, a complex process requiring subjective judgement. Unlike most insurers TRUP is a cash in – cash out business; it does not have a substantial float, nor does the investment income from that float contribute meaningfully to the business’s discretionary profits.
Given pet insurance penetration rates in the US of 1%, TRUP’s primary competitor is the pet owner who chooses to self-fund pet healthcare costs with cash or debt. TRUP is therefore focused on growing the addressable market vs. taking market share from existing players; the primary challenge in achieving this is the education of pet owners about the merits of TRUP’s pet insurance.
The nature of the insurance business model – risk is spread over a large membership for lucky pets to subsidise unlucky pets – is a barrier to profitable entry for small insurance providers. For example, given the fragmented nature of the vet industry, it would not be possible for individual vets to offer their customers insurance products.
TRUP is the largest player in Canada and the second largest in the US, behind Nationwide. Nationwide started in 1982 and was the first pet insurer in the US. It has c. 550k enrolled pets; TRUP has rapidly grown to c. 500k pets and it is likely that TRUP will become the largest player in the US soon.
High retention and net subscriber addition rates are evidence of a strong value proposition. The sources of this superior value proposition stem from (1) a cost advantage that is shared with customers, (2) a data advantage driving more accurate underwriting, and (3) switching costs and symbiotic value chain.
TRUP is vertically integrated; it owns its insurance subsidiary and is responsible for acquiring and servicing existing customers as well as underwriting their insurance. TRUP estimates this vertical integration has eliminated frictional costs of c. 20% of revenues. These economic savings have been donated to consumers in the form of higher claims payout ratios. TRUP’s strategy has therefore been to sacrifice the near-term margin upside of this cost advantage in the pursuit of a larger and stickier customer base and subscription revenue pool. This cost advantage does not manifest itself in lower prices, but rather the highest sustainable expenditure on vet invoices per dollar of premiums.
TRUP has built a database over 15 years using 7.5mn pet months of information and > 1mn claims; it has segmented the market into 1.2mn price categories in order to more accurately underwrite insurance costs for a given pet. Of course, determining the point at which the marginal returns on incremental data diminish is difficult, but according to the CEO it would take a competitor 13 years to replicate this data asset. Although Nationwide is larger by number of pets enrolled, its data are likely to be less comprehensive for two reasons: (1) a lack of data for conditions not covered by policies, such as hereditary and congenital diseases, and (2) pricing categories by state rather than zip code, even though the cost of vet care can vary widely within states. TRUP considers its ability to accurately estimate the costs of pet healthcare costs by granular sub-categories crucial to its leading value proposition. This allows for the provision of more relevant products for the customer.
Trupanion Express is software that was developed by TRUP and integrates with vets’ practice management systems. Through Trupanion Express, TRUP pays vets directly, within five minutes of a vet invoice being submitted, disrupting the traditional insurance reimbursement model and obviating the need for customers to pay out of pocket and then submit a claim for the expense. This is clearly a superior solution to the reimbursement model in solving customers’ cash flow problem associated with unexpected pet healthcare costs. In general, pet owners do not switch insurance providers due to the non-coverage of pre-existing conditions. Trupanion Express is installed in 10% of the 20k hospitals being visited by Territory Partners each year. The integration of this software is likely to improve the loyalty of pet owners and vets.
Finally, TRUP insurance seems to be a win-win-win proposition for pet owners, vets and TRUP:
- Vets’ treatment decisions can be dictated by efficacy rather than cost. Pet owners visit the vet more frequently and are more likely to agree to the vet’s Plan A treatment recommendation. The goal for Territory Partners is to sign vets up to Trupanion Express, which is free, removes bad debt issues and therefore fosters better relationships with customers. Trupanion Express also eliminates credit card fees, which may constitute c.15% of a vet’s profits.
- Pet owners have peace of mind that they will not be hit with unexpected large vet bills and are therefore also less likely to choose economic euthanasia or suboptimal treatment plans. With Trupanion Express they do not need to settle vet invoices out of pocket and then attempt to cover the claim through the traditional reimbursement model.
- Through Trupanion Express TRUP improves the retention of its customer base, freeing up discretionary capital for accelerated pet acquisition.
The addressable market is large and underpenetrated relative to other developed markets. The differences in these other markets are not demographic, social or economic, but rather (1) the length of time comprehensive pet insurance has been available, (2) the value proposition in the form of higher claims payments as a ratio to premiums (higher loss ratios) and (3) vet vs. direct to consumer distribution models. Pet insurance companies in the US typically do not cover hereditary and congenital conditions, which are the forms of illness most likely to be suffered by cats and dogs, they increase rates when claims are made, they impose payout limits, and pay claims according to an estimated cost schedule rather than actual vet invoices. TRUP is different in all these respects and as such expects to grow the addressable market in North America to greater than 1% penetration. In any case, it appears to be the case that TRUP’s value proposition is driving adoption in North America.
The unit economics associated with the pursuit of this opportunity to grow the company’s assets are attractive. The cost to acquire a pet is c. $150, around 3x the average monthly ARPU. Assuming the current 10% discretionary margin and a six-year average pet life, the IRR on new pets is 30-40%. At a 15% discretionary margin the IRR would be double this. I estimate that both ARPUs and discretionary margins would need to decline by 20-25% to render reinvestment in pet acquisition a capital destructive pursuit. This would contradict the economic reality of a market in which pet healthcare costs are increasing mid-single digits as new technologies and treatments are ported over from human healthcare, and the scalability of the business model.
The CEO owns 7% of TRUP equity/$60mn and in total the executive leadership team owns 10%. This is c 100x the CEO’s annual compensation. He automatically sells 2% of his shares each year until he has sold 25% of his interest in the company by 2025. This has been a source of criticism from short sellers but given the large gap between stock ownership and annual remuneration, and the zero-dividend policy, I don’t think this represents misalignment with other minority owners of the business.
TRUP’s quoted market cap is c. $800mn, c.6x BV and 24x owner earnings of c. $33mn. A 4% owner earnings’ yield is reasonable for a business with TRUP’s high reinvestment rates and incremental returns on new capital investments if these can be successfully maintained. The strength of TRUP’s competitive position and evidence that their value proposition is attractive to pet owners suggest that they can. These owner earnings are one quarter of book value, and the company is growing its assets (enrolled pets) 20-30% each year; 6x BV implies a 6% sustainable growth rate.
Yet incremental returns on reinvested capital are higher than the return on existing net assets, leading to growth rates many multiples of that implied by the market. Finally, management expects scaling of the fixed cost base to drive margin expansion, leading to economic earnings growth higher than revenue growth. By 2020 if management achieves its targets it should be generating c. $450mn of revenues and $65-70mn of discretionary profits. Given the company expects to reinvest all discretionary profits into growing enrolled pets, retained losses are unlikely to improve over that time, leading to a potential RoE of c. 50% in 2020 on an owner earnings basis. At the current price the stock would then be trading at a multiple of its book value that implied zero growth, despite the ample room for enrolled pet expansion afforded by low market penetration and a leading value proposition.
Wishing everyone a healthy and happy year ahead,
Yours sincerely.
Mark


