Summary
- Lennar Corporation (NYSE:LEN) (Lennar) became the leading homebuilder mainly due to acquisitions. If Lennar relied on organic growth, it would probable only achieve revenue growth of about 5 % per annum.
Q3 2021 hedge fund letters, conferences and more
- The homebuilding sector is cyclical. There is a 0.9 correlation between the US Housing Starts and Lennar’s revenue. When the US Housing Starts mean revert, so will Lennar’s revenue and earnings.
- Lennar should be analysed and valued through a cyclical lens. A valuation of Lennar based on a cyclical model showed that there is no margin of safety at the current price.
Investment Thesis
For the financial year ended Nov 2021, Lennar achieved an unaudited net earnings per share of USD 14.27. With Lennar market price of USD 105.84 per share, this is a PE of 7.4.
Compared to the last financial year, revenue increased by 21 % while net earnings increased by 80%. You can be forgiven for thinking that this is a good investment opportunity.
But Lennar is a homebuilder. The homebuilding industry is a cyclical one and any fundamental analysis of Lennar should be through a cyclical lens. Based on such a lens, there is no margin of safety at the current market price. The market is pricing Lennar as if it is a growth stock.
Rationale
- Over the past 12 years, while Lennar’s revenue grew at 21.2 % CAGR, this was due to its acquisitions and the tailwind from growth in the Housing Starts. If based just on organic growth, Lennar’s revenue growth over the past few years was around 5% per annum.
- The homebuilding industry is a cyclical one. There does not seem to be any growth in the long-term average Housing Starts. Over the past 10 years, the Housing Starts was in the uptrend part of the cycle.
- There are two trends driving the current housing situation - the uptrend part of the Housing Starts cycle and the housing deficit. These would cause the current Housing Starts to overshoot the long-term average. However, Housing Starts would peak and mean revert eventually.
- There is a 0.90 correlation between the Housing Starts and Lennar’s revenue. When the US Housing Starts mean revert, so will Lennar’s revenue and earnings.
- Lennar is fundamentally strong. It had a good track record in creating shareholders value. It is also financially sound with a decreasing Debt Equity ratio over the past 12 years.
- While a good company, Lennar is currently not a good investment as there is no margin of safety based on valuing Lennar as a cyclical stock.
The supporting analyses for the above are presented in the following sections.
Limits To Revenue Growth
From 2010 to 2021, Lennar’s revenue grew at a CAGR of 21.1 %. Part of this was due to organic growth and part was due to acquisitions.
To exclude the impact of the acquisitions, I looked at the revenue growth for 2 periods when there were no acquisitions by Lennar. In order words, the growths were organic. I then compared this organic revenue growth with:
- The top 9 homebuilders’ revenue growth. The top 9 were those with the highest 2020 revenue.
- The growth in the US Housing Starts.
As can be seen from Table 1, Lennar did well in the early part of the last decade when its revenue grew faster than both the top 9 group and the Housing Starts. But from 2018 onwards, its growth was not exceptional.
Table 1: Comparative Growth Rates
The relatively lower growth rates from 2018 to 2020 meant that Lennar’s market share reduced slightly from 2018 to 2020.
However, if you looked at the overall picture, Lennar’s share of the top 10 homebuilders’ revenue increased from 14% in 2010 to 25 % in 2020. Note that the top 10 revenue here included that of Lennar. But this growth covered both organic and inorganic. This meant that the overall growth was due more to the acquisitions rather than organic growth.
What does this all mean moving forward? Lennar had grown to a size where it is unlikely to increase its market share significantly via organic growth.
Cyclical Housing Starts
The US Housing Starts grew from 0.59 million units in 2010 to 1.38 million units in 2020. This was equal to an 8.9 % CAGR. But 2010 to 2020 was an uptrend part of the Housing Starts cycle.
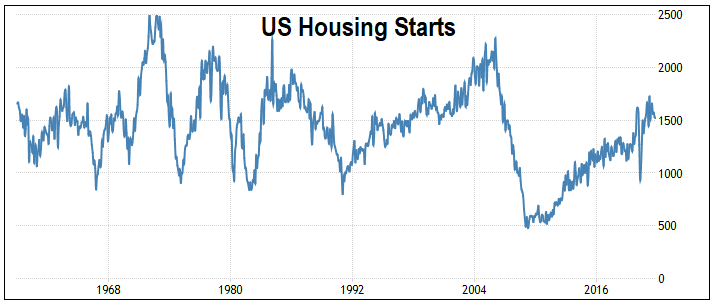
As can be seen from Chart 1, over the past 70 years, the Housing Starts was cyclical. According to Trading Economics the Housing Starts is projected to trend around 1.37 million units in 2022 and 1.27 million units in 2023. In other words, there is a projected downtrend.
Chart 1: Housing Starts
Source: Trading Economics
There were about 7 cycles during the last 70 years with the longest cycle stretching from around 1992 to 2010. There are 3 takeaways from the chart and Trading Economics outlook.
- This is a cyclical industry.
- There does not seem to be any uptrend in the long-term average Housing Starts. We have a “stable” long-term average.
- The 2020 Housing Starts is approaching the long-term average of about 1.5 million units per year.
Any long-term projection of the Housing Starts should thus be based on reversion to the mean.
During the period from 2010 to 2020, there is a 0.90 correlation between the Housing Starts and Lennar’s revenue. The correlation between the Housing Starts and the number of homes delivered by Lennar was 0.89. These meant that when the Housing Starts mean revert, we should also expect Lennar’s revenue to mean revert as well.
Any continuous long-term growth for a homebuilder must be because it is taking market share from its competitors. I had shown earlier that Lennar had not been able to grow its market share over the past few years.
This is not to suggest that there would not be any organic growth for Lennar. Rather any revenue growth would mainly be tied to a price increase rather than an increase in unit sales volume.
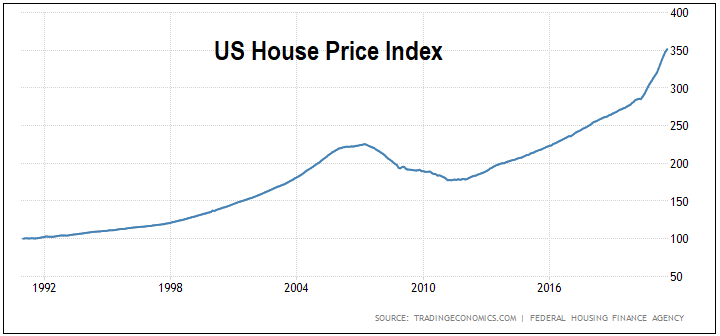
While Housing Starts did not show any long-term uptrend, house prices behaved differently. Based on the Federal Housing Finance Agency House Price Index, house price increased at a 4.3 % CAGR from 1992 till Aug 2021.
While there is no long-term growth in the Housing Starts, the homebuilders’ industry revenue would still have growth due to unit price growth. But this is growth at about the US long-term GDP growth rate. Again, it showed that this is not a growth sector.
Chart 2: US House Price Index
Source: Trading Economics
Will Housing Starts overshoot the long-term average?
There are two key macro trends driving the demand for houses in the US currently.
- Housing Starts. This is cyclical with the long-term average at about 1.5 million units per year. Over the past decade, Housing Starts were in the uptrend part of the cycle.
- US housing deficit. There is currently a national housing shortage with estimates varying from one million homes to 5 million homes. The National Association of Realtors and Rosen Consulting Group recently published a report concluding that U.S. housing stock is undersupplied by at least 5.5 million units.
Looking at both these factors, I would conclude that the Housing Starts would overshoot the long-term average in the current cycle.
To get a picture of how it will overshoot, I used the following model:
- The Housing Starts will reach the long-term average of 1.5 million units in 2021.
- The growth will continue at CAGR of 8.9 %. This was the CAGR from 2010 to 2020.
- The Housing Starts will then peak and decline. I assumed that the down pattern from the peak will be the same as the pattern moving up to the peak.
- I looked at 2 scenarios. The first is with the total excess at about 1 million units - Conservative Scenario. The second is when the total excess is about 5 million units - Optimistic Scenario. The excess each year is the number of Housing Starts greater than 1.5 million units.
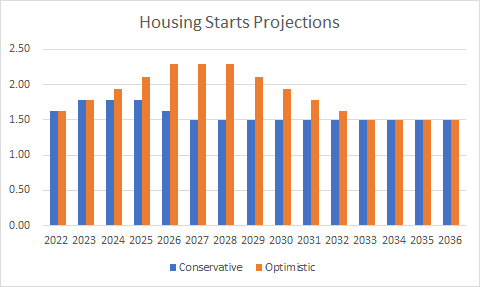
The chart below shows the Housing Starts projections under the 2 scenarios.
Chart 3: Housing Starts Projections
- If you take the Conservative Scenario with the deficit of about 1 million, it will peak around 2024.
- If you take the Optimistic Scenario with the deficit of about 5 million, it will peak around 2027.
Note that in these scenarios, I have assumed that the Housing Starts would not go below the long-term average ie “undershoot” on the way down. Whether it does this or not does not change the long-term average value.
Furthermore, I do not expect any change to the long-term average given that it is 6-decades Housing Starts average.
Strong fundamentals
I do not think anyone would dispute that Lennar is a fundamentally sound company. To get a sense of this, I looked at 2 parameters - shareholders’ value creation and financial strengths.
Firstly, Lennar had been able to create shareholders valued from 2010 to 2020. I assessed this based on 3 metrics where I compared the returns with the respective cost of funds as shown below. Shareholders’ value is created when the returns are greater than the cost of funds.
Table 2: Shareholders’ Value Creation
Note
(a) This looked at how a shareholder would have gained if he bought one share at the end of 2010 and held onto it till end of 2021 as computed in Table 3. Unlike the other two metrics, this one is a share market-based view.
Table 3: Shareholders Gain
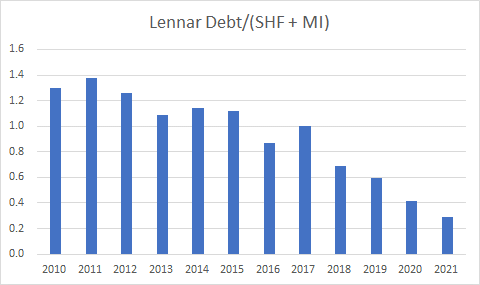
Secondly, Lennar is financially sound with a Debt Equity ratio of 0.3. This has been reducing over the past 12 years. Part of this was due to debt retirement and part was due to the increase in the SHF. Its financial strengths had enabled it to finance its land purchase as well as price its properties to the current market conditions. These in turn resulted in better gross profit margins.
Chart 4: Debt Equity
The issue is not whether Lennar is a good company. The question is whether the market has overpriced Lennar.
Valuation.
If you view Lennar as a cyclical company, then the various parameters used in the valuation should be based on some “normalized” values. I assumed the following in my valuation.
| Item | Value | Notes |
| Base revenue | USD 25.5 m | 2021 values |
| Gross Profit margin | 20.84 % | 2018 to 2021 average (a) |
| SGA margin | 9.11 % | 2018 to 2021 average (b) |
| Tax rate | 23.20 % | 2018 to 2021 average |
| TCE | USD 24.4 m | 2021 values (c) |
| Cash & Non-Op | USD 3,729.2 m | 2021 values |
| Return | 9.45 % | EBIT(1-t)/TCE |
| Risk-free rate | 1.92 % | As per Damodaran |
| WACC | 8.03 % | As per Damodaran approach |
| Growth rate | 4.3 % | Long term growth in Housing Price Index |
Table 4: Valuation Assumptions
Notes
(a) The past 12 years average was 20.83 %.
(b) The SGA margin had declined from 10.3 % in 2017 to 8.6 % in 2021.
(c) TCE = Total Capital Employed = SHF + MI + Debt - Cash
My valuation model was based on a single-stage model with the following.
EBIT = Gross Profit - SGA
Value = EBIT(1-t) X (1 - Reinvestment rate)
Reinvestment rate = growth rate/return
I obtained the following values for Lennar:
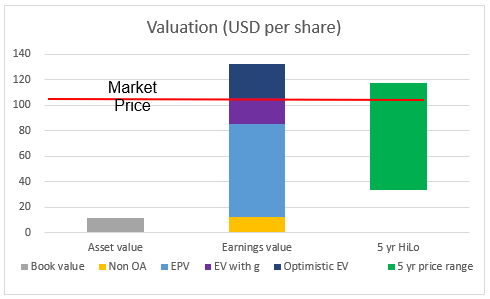
- Book Value = USD 68 per share
- EPV = USD 85 share
- Earnings with 4.3 % growth = USD 106 per share
As you can see there is hardly any margin of safety based on a cyclical perspective.
Potential Upsides
Using a cyclical model is of course a conservative approach. While the results showed that there is no margin of safety, there are 3 potential upsides to the above valuation.
- Improvements in the SGA margins. As far back as 2016, Lennar reported reducing SGA expenses by using innovative strategies. In my valuation, I had assumed an SGA margin of 9.11 %. Assuming that the SGA margin would be improved to 8.11 %, the EPV would increase to USD 93 per share. Correspondingly the Earning with growth would increase to USD 123 per share.
- Gain from strategic technology investments. In 2021, Lennar reported a gain of USD 680 million from its investments in a number of technology companies. I have ignored such gain in my valuation.
- Earnings from a change in the way the Housing Starts will revert to the mean.
My cyclical model assumed that any “overshoot” to the long-term average Housing Starts would be offset by the “undershoot” on the way down. But given the housing deficits, it is possible that there would not be any “undershoot” on the way down. This pattern is as shown in Chart 3. If this happens, there would an additional value from the portion above the long-term average.
I estimated that this ‘above the long-term average portion” would be equivalent to another USD 9 per share. For this valuation, I assumed that this portion would result in additional gross profits but without additional SGA. I also took the Optimistic Scenario as per Chart 3.
If I incorporate the additional values from items 1 and 3, we have the following valuation picture:
Chart 5: Valuation
Notes
- EV with g = Earnings value with 4.3 % growth
- Optimistic EV = EV with g with improvements in SGA and incorporating the “excess” component.
The point is that there is at least a 25 % margin of safety if you assumed that these upsides materialize. But this is viewing Lennar as a form of growth stock. You are assuming that it can grow earnings by reducing its SGA margins. You are betting on its investments in the PropTech companies. And you expect the Housing Starts pattern to change. I would not bet on them.
Besides if you want to value Lennar as a growth stock, you would have to assumed that there would be future acquisitions. My perspective is that of a long-term value investor where growth is organic.
Conclusion
Lennar is the leading homebuilder in the US. It reached this stage due mainly to acquisitions. Moving forward growth would be organic.
The homebuilding sector is a cyclical one with a “stable” long-term average Housing Starts. While there is currently a housing deficit, what this meant is that the current Housing Starts will overshoot the long-term average. But it will eventually peak and mean revert.
There is a 0.90 correlation between Lennar’s revenue and the Housing Starts. When the Housing Starts mean revert, I would expect Lennar’s revenue to also mean revert. Any revenue growth will probably be due to the long-term growth in the house price rather than volume growth.
While it is a good company based on its fundamentals, Lennar is not an investment opportunity based on the current price. This is because there is no margin of safety for the EPV or the Earning Value with growth based a cyclical model.
However, there are potential upsides. But if you are a conservative value investor, you should not bet on them.
Editor’s Note: The article is from H.C. Eu who blogs at Investing for Value. He is a self-taught value investor and has been investing in Bursa Malaysia and SGX companies for more than 15 years. His value investment experience has been enhanced by both his Board experiences and his contacts with controlling shareholders of many Bursa Malaysia’s listed companies. These have given him a unique opportunity to be able to analyse and value companies differently from other research houses. If you enjoyed this piece, you can find similar pieces and other value investing tips in his blog.


