
Qualivian Investment Partners commentary for the third quarter ended September 2021, providing an investment thesis for Vitec Software Group AB (STO:VIT-B).
Q3 2021 hedge fund letters, conferences and more
Bull Market: A period of rising prices that leads many investors to believe that their IQ has risen at least as much as the market value of their portfolios. After the inevitable fall in prices, they will learn that both increases were temporary.” – The Devils Dictionary by Jason Zweig
Overview
Qualivian Investment Partners is an investment partnership focused on long-only public equities. We own a concentrated portfolio of 15–25 understandable companies with wide moats, long reinvestment runways, and outstanding capital allocation. Since we expect them to compound capital at a mid-teens rate, we hold them for an extended period. We are seeking investors who are aligned with our long-term investment time horizon. We do not short securities. We do not use leverage. We do not use derivatives. We are not macro investors. We believe that only a relatively small number of exceptional companies are worth investing in over the long term.
Our Formula:
Long-Term Orientation + Long-Term Investors + Focused Portfolio + Quality Compounders = Maximizing Chance for Outperformance
Our investors should understand how we invest so they make the right decision. We encourage investors who agree with our long-term horizon and philosophy to contact Aamer Khan ([email protected]) at 617-970-9583 or Cyril Malak ([email protected]) at 617-977-6101.
Qualivian Performance in Q3 2021
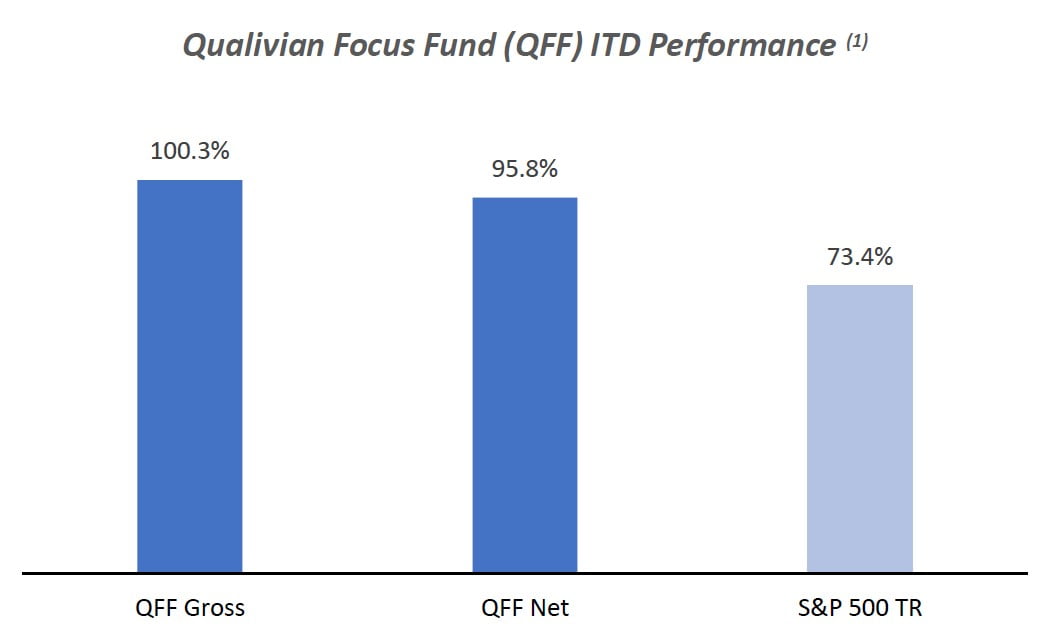
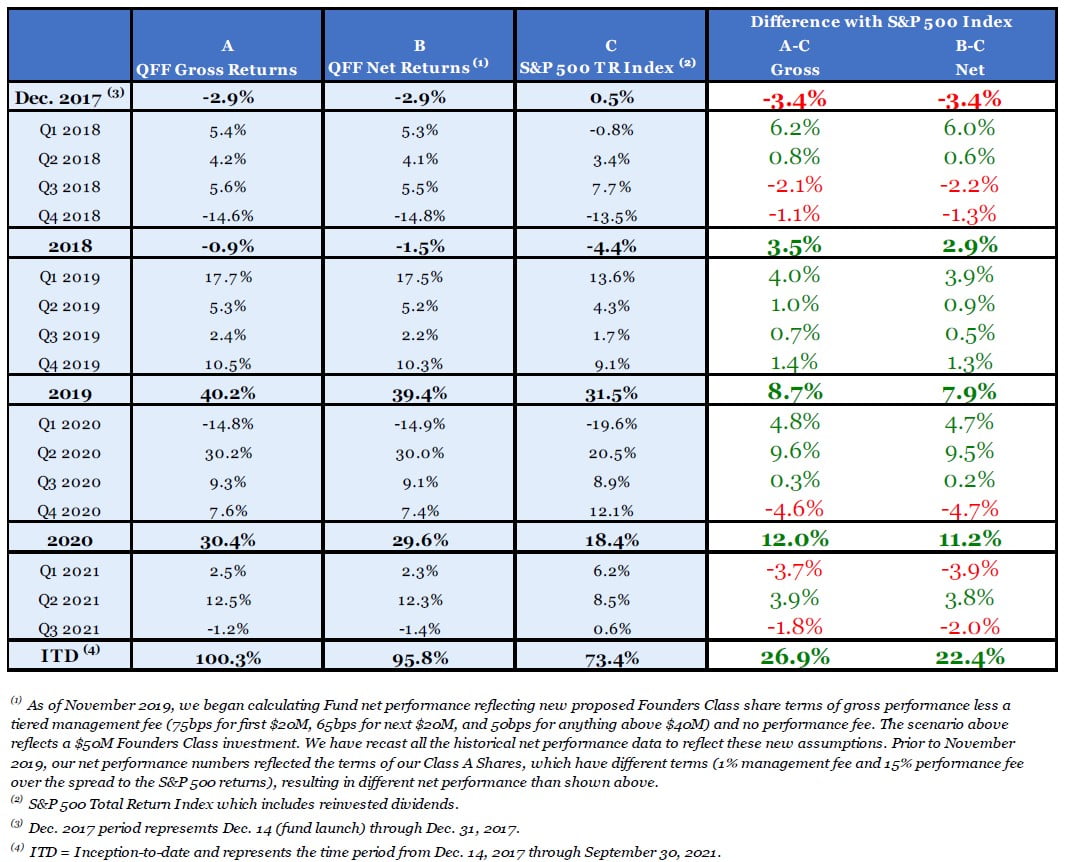
Since inception (December 14, 2017) to end of Q3 2021, we have returned 100.3% and 95.8% on a gross and net basis respectively, outperforming the S&P 500 Total Return index by 26.9% and 22.4%, respectively.
In Q3 2021, we underperformed the S&P 500 by 1.8% and 2.0% on a gross and net basis, respectively. We were negatively impacted by the rotation to more cyclically sensitive sectors in Q3 2021, like Oil and Gas, Banking, and Industrials.
For our top 3 and bottom 3 contributors in the quarter, please refer to Appendix 2.
Portfolio Changes
We did not make any changes to the portfolio in Q3 2021.
How Many Investment Models Do You Have?
Even the most outstanding novelists cannot create more than a handful of genuinely different literary characters in their stories. All their characters are iterations of a few archetypes. Three or four is the limit even for a master writer.
The same holds true in chess. Research has shown that chess masters do not think in terms of individual moves but in terms of recurring patterns like connected vs disconnected pawn structures, fortresses around the king, bishops of opposing colors, etc.
Lesson: We tend to shoehorn complex situations into a few familiar patterns.
This applies to investment management also.
Successful investors focus on a few investment models which they look for and develop competence in analyzing. They also know which parts of the market these investment models can be found in. These models occur repeatedly in investing. These investment models are not sector specific. They often occur in different and across sectors.
By focusing on these few models, investors can:
- process the firehose of investment information,
- funnel it into a much smaller set of promising stocks, from which
- they construct their portfolio, and
- tune out other stocks.
Most important of all, successful investors know that their power alley consists of (1) recognizing these investment models and (2) knowing which areas of the market they occur in. They leave stocks outside their power alley alone, no matter how compelling they may appear.
Some examples of distinct investment models are:
- Platform marketplaces (AMZN and ETSY)
- Low-cost disruptors (Costco)
- Natural oligopoly (Mastercard/Visa, Copart)
- Serial acquirers (Watsco, Vitec, Pool, Tyler, Constellation Software)
Contrast this with the behavior of average investors: They have no power alley. They have no filter through which to view the investing universe. They lack discipline. Their buy or sell decisions are based on a mixture of incremental information, sentiment, tips and media hype. And the stocks they own typically underperform.
We at Qualivian focus on a few models. We now discuss one:
Serial Acquirers
What Are Serial Acquirers?
They are firms that perceive acquisitions to have a higher return potential than returning cash to shareholders or reinvesting in existing businesses. Making acquisitions is a core element of their business model.
Why Serial Acquirers May be Underappreciated and Undervalued
Organic Growers Are Preferred by Most Investors: Many investors reflexively avoid serial acquirers because of a strong preference for organic versus acquisition-led growth. This is reinforced by the belief that most acquisitions destroy shareholder value and are motivated by empire building. However, all serial acquirers are not the same and should not be painted with the same broad brush. This creates an investment opportunity for those investors willing to investigate further.
They Don’t Fit into Neat Sector or Style Categories: Many investment analysts focus on a particular sector like energy, financials, or software. Similarly, portfolio managers tend to focus on a style, like value, core, or growth. Serial acquirers often don’t fall into a single category.
Investment analysts and portfolio managers only come across them occasionally and do not develop the skills to understand them.
Complexity: Serial acquirers are harder to analyze than less acquisitive firms because the repeated acquisitions add another moving part to the existing operating business of the firm. The acquisitions often distract analysts from the performance of the underlying business. For example, one serial acquirer that we own, Watsco, steadily increased its operating margin from 5.8% to 10.0% over the past decade despite many acquisitions in that period. Analysts who focused on the acquisitions missed out on the underlying increase in operating margin via operational improvements and the synergies that Watsco has learned to generate from its acquisitions.
Modeling Is Difficult Due to Uncertainty About Growth from Future Acquisitions: Acquisitions are the known unknown. Analysts often ignore what they can’t model. Moreover, they tend to factor in linear growth into their models. It makes the math easier. Acquisition-driven models, by their nature, have sporadic nonlinear growth spurts and slowdowns that are not easily modeled. Consequently, these firms get less attention from the analyst community.
Success Factors for Serial Acquirers
Acquisition Arbitrage: The best serial acquirers are acutely aware of the mix of cash and stock in financing acquisitions. They engage in acquisition arbitrage. They only use their own stock for acquisitions if their company’s valuation is more highly valued than that of the target after accounting for a control premium. This makes the acquisition economically accretive. Otherwise, they use cash.
Large Total Addressable and Fragmented Market: Having many targets in a large market gives the serial acquirer a long growth runway and the ability to build or maintain scale economies.
Adding Value to Acquisitions: This can be done by:
- Generating cost synergies by consolidating back offices.
- Cross selling to other businesses owned by the acquirer.
- Sharing best practices.
- Changing the financial incentives.
- Introducing best in class marketing techniques. Many of these firms neglected developing a sales culture because management was primarily focused on engineering or manufacturing.
Avoiding Competition in Industries where Private Equity is Active: Serial acquirers that operate in industries where private equity competes for targets are less likely to outperform. Competitive auctions tend to drive target prices to levels where an acquisition could be destructive to shareholder value. Private equity tends to be more active for larger targets and in industries with stable, recurring revenue. It is less interested in smaller targets. This is why we are often attracted to serial acquirers that typically engage in smaller acquisitions where most of their deals are negotiated and not auctions.
Serial Acquirer Models
Investment opportunities exist in each of the three models described below-. Many of the listed examples in each model have outperformed the market over an extended period.
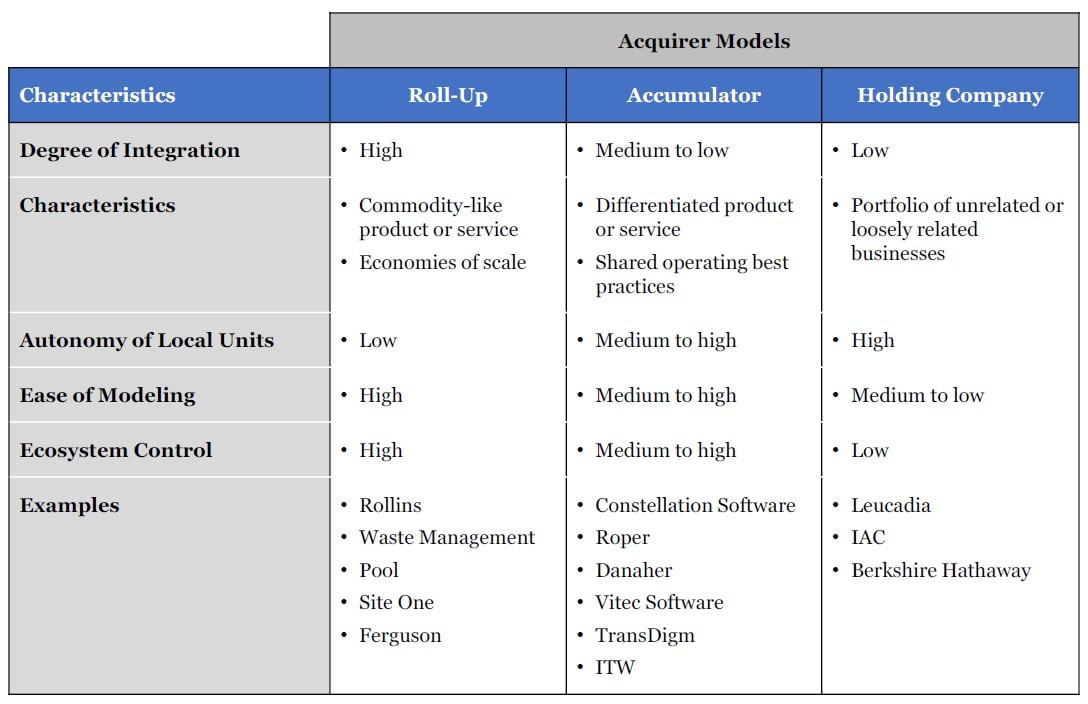
- The Accumulator model often has successful serial acquirers with the following characteristics:
- the industry is fragmented,
- the serial acquirer can integrate acquisitions better than the competition due to a managerial or technological advantage, and
- it can perform acquisition arbitrage using its highly valued stock which it uses to make accretive acquisitions of less highly valued targets.
- The Rollup model is particularly dependent on economies of scale. The biggest player is often the best investment. However, the lower complexity of rollups versus the other two categories means it is more likely to be tracked by analysts.
- The Holding company model is almost totally dependent on the capital allocation skills of management since these companies target businesses in different industries with little integration.
Revisiting Founder-Led Businesses and Why We Like Them
In our Q1 2021 investor letter we talked about our attraction to founder-led companies and referenced a study by Bain and Co. that demonstrated over the past 15-years such companies delivered superior shareholder returns. We have several companies where the founder or the founder’s protégés is leading the business.
Businesses led by founders often benefit from their:
- Clarity of vision/mission
- Entrepreneurial spirit and passion, and
- Coherent and cohesive culture.
Clarity of Vision/Mission
Founders are mission-driven, with a purpose and desire to solve a real problem. They devote their time and energy to solving the problem they are fixated on. They are not in it for the money—it is not about the compensation, prestige, or fame.
Entrepreneurial Spirit and Passion
Founders not only embed a core vision for their companies to organize around but they imbue their organizations with an entrepreneurial spirit that permeates all levels of the organization. This is a defining characteristic of a successful founder-led business. The entrepreneurial drive typically atrophies when the founders have left and been replaced by professional management. This often leads to bureaucratic malaise resulting from hierarchical reporting structures.
Coherent and Cohesive Culture
In an organization led by a passionate founder, employees at every level are motivated and understand how their jobs/roles in the organization tie into the overall mission/purpose of the organization. The founder must be a proselytizer who is able to not only define the problem but also to explain to employees and investors why it is societally beneficial to solve it. The financial reward is simply a byproduct of getting the job done…not the primary motivation.
Founder Protégés
Often, we find similar traits in companies that have recently transitioned from founder to non-founder successors from within the organization. Successors who have worked alongside those founders for years know the ins and outs of their businesses and understand the founder-originating culture better than any other hired CEO. The clichéd example of this phenomenon is Tim Cook who worked very closely under Steve Jobs at Apple and who understood that the core defining culture of the company was to design superior consumer technology products (and services under Cook) whose design principles bring the “best user experience to its customers through innovations in hardware and software that leapfrog the competition.”
Many of our portfolio companies are led by founders or their protégés.
Vitec Software Group
One of the names on our shopping list is Vitec Software Group AB (STO:VIT-B), listed on the Stockholm Stock Exchange. This company illustrates several of the themes we have discussed. Vitec is a serial acquirer of Nordic-based vertical software companies. It owns 30 vertical businesses in areas like education, local administration, health, and real estate. Vitec was founder-led since inception (1985) to 2020. The founders Lars Stenlund (Chairman) and Olav Sandberg own 7.8% of the outstanding shares but control 43% of the voting rights in the firm.2
Vitec Investment Thesis
- Return on capital, culture, and shareholder orientation drive results over the long run. Over shorter periods (less than three years) returns are driven by changes in market sentiment, fashion, and economic cycles. Vitec checks the boxes for long-term returns.
- High barriers to entry and switching costs keep profitability of its acquired firms high:
- Vitec focuses on firms that have high market share in niche verticals and whose size tend to be small.
- The customization of the software, its lock in, and the small size makes it unattractive for competitors, private equity firms, or venture capital firms to enter the market.
- Vitec has a long track record of outstanding capital allocation and creating value from their acquisitions through sharing of best practices, cross selling, and having a long-term owner orientation.
- Vitec’s value creation is demonstrated via their systematic increase in operating margins, Revenue per Share (RPS), EPS, and FCF/share:
- Operating margins increased from 10.5% in 2011 to 17.2% in 2020.
- RPS, diluted EPS, and FCF/share have compounded at 12.4%, 21.7%, and 25.5% over the past 10 years respectively.
- Another metric popularized by Mark Leonard, the CEO of Constellation software, Return on Invested Capital (ROIC) + Organic Revenue growth, is a proxy for intrinsic value growth over time when a company’s FCF is being invested in value-generating acquisitions. Vitec’s ROIC of 12% and organic revenue growth of 3-5% give us an insight into prospective future returns if the management team is doing its job correctly investing in value-generating acquisitions.
- Vitec’s value creation is demonstrated via their systematic increase in operating margins, Revenue per Share (RPS), EPS, and FCF/share:
- The existing Vertical Software Market businesses (see below) should continue to grow at the GDP growth rate of 3-5% per annum. The majority of future returns should come from value-creating acquisition activity. Vitec should be able to continue to deploy its free cash flow into new targets and obtain its historical 15-20% rates of return. There are at least 400 vertical software firms in the Nordics of which 100 fit Vitec’s criteria so that Vitec can continue to grow at its historical rates for the foreseeable future.
Vertical Software Market (VSM): VSM is distinguished from horizontal software companies (e.g., Oracle, SAP, MSFT, and CRM which automate corporate functions) in that:
- It is tailored to a specific narrow market segment (e.g., pharmacy management, church administration, municipal accounting, building and facility management) and is designed to meet its customers’ needs more closely than horizontal software. Often it is explicitly designed to meet the requirements of a particular geographic market (Sweden, Denmark, Norway, or Finland or even smaller local geographies within those countries). Switching costs are high since replacing software is disruptive. This makes customer churn less likely.
- It competes with internally developed software but is cheaper since its development cost can be spread over many customers.
- Little capital is required for maintenance and growth of existing customers, making revenue growth highly accretive to earnings. The scalability of software leads to high operating leverage and margin expansion.
The barriers to entry for the vertical software markets are higher than for horizontal software because the markets tend to be smaller and more specialized.
The Vitec Business Model
Vitec buys well-managed vertical software companies with products established in mature markets. Specific acquisition criteria are:
- Vitec must know the target and its management well from previous meetings, sometimes occurring over several years. It must be confident that their values and culture are aligned.
- Targets must have a high degree of recurring revenue or can be transitioned to such a model.
- The target must offer software in the form of standardized proprietarily developed products aimed at a particular vertical market. This often implies the customers of the firm are locked in and will have difficulty replacing the software. This gives Vitec pricing power and recurring revenue.
- Acquisitions must directly contribute to an increase in Vitec’s earnings per share. Consequently, it is vital that the company demonstrate solid profitability and positive cash flows at the acquisition date. They do not invest in future expectations.
- Target companies may have hit a growth slowdown, or its founders are looking for an exit.
How Vitec Adds Value
Vitec introduces post-acquisition changes to acquired units via a well-honed and repeatable merger integration process. These include:
- Vitec intends to keep the units permanently. It does not rank its units on a forced curve and discard lower ranked units as a policy. Vitec does not play corporate gin rummy. It sells a unit only if it has made an irreparable mistake. This gives the business units an ownership mentality so they can focus on long-term value creation rather than worry about being sold after a few years. Contrast with private equity or venture capital owners who intend to monetize ownership within 7-10 years.
- Vitec gives each acquired unit local autonomy and clear incentives to meet targets. The unit is monitored using key metrics that steer its strategic focus toward a high percentage of recurring revenues. This often means that the acquiree moves from a license model to a subscription model if it hasn’t already.
- Vitec often buys founder-led businesses which tend to have a long-term orientation permeating their culture and systems.
- Vitec introduces a sales and marketing culture to the acquired firms that are typically run by entrepreneurs who are experts in software design but who are not strong marketers.
- Where it makes sense to do so, Vitec cross-sells the target companies’ software solutions to other Vitec clients.
- Finally, Vitec’s management consistently shares best practices across business units.
Financials and Valuation
- Vitec has compounded RPS (Revenue per Share) at 13.9% and 12.4% CAGR over the past 5 and 10 years respectively.
- Similarly, the company has compounded EPS by 13.2% and 21.7% over the past 5 and 10 years respectively.
- Most impressively, the company has been able to grow FCF/share compounded annually at 24.6% and 25.5% over the past 5 and 10 years respectively.
- Valuation: at 11X P/S, 48X NTM P/E, 3X PEG ratio, and an LTM FCF yield of 2.4%, it appears the market appreciates the qualities we see in Vitec as well, so it remains on our monitor list. If given a better entry point, Vitec will be under our serious consideration.
Ending Thoughts
We look forward to continuing to share our thoughts on our investment approach, and to keep you abreast of our performance and changes to the portfolio. If you would like additional information about Qualivian, please refer to Appendix 2 for links to prior Investor letters, our investor presentation, and an interview Aamer did with Insider Monkey. In the meantime, if you have any questions, please feel free to reach out to us at the links below.
With best wishes,
Aamer Khan
Co-founder
Cyril Malak
Co-founder
Appendix 1: Qualivian Focus Fund Quarterly Performance Table
Appendix 2: Top 3 and Bottom 3 Contributors
Our top three contributors in Q3 2021 were Alphabet (GOOGL), O’Reilly Automotive (ORLY), and Microsoft (MSFT). Our bottom three contributors were Mastercard (MA), Amazon (AMZN), and PayPal (PYPL).
Top 3 Contributors:
Alphabet
Alphabet Inc (NASDAQ:GOOGL)’s Advertising revenue jumped 43% year over year to $53.1 billion, easily beating Wall Street’s forecasts. Despite adding nearly 6,000 workers to its rolls during the quarter, its spending stayed relatively in check, allowing operating income to surge 88% year over year to a record $21 billion, well above consensus estimates. The company’s operating margin came in just over the 32% mark for the first time in at least a decade. Free cash flow hit a record $18.7 billion in the quarter, up 61% year over year. Revenue for both YouTube ads and Google Cloud each jumped more than 40% year over year. We remain very confident in Alphabet’s ability to continue to compound its intrinsic value at 15%–20%+ for the foreseeable future.
O’Reilly Automotive
O’Reilly Automotive Inc (NASDAQ:ORLY) reported another very profitable quarter, highlighted by a 6.7% increase in its third quarter same store sales, despite the incredibly strong 16.9% increase it generated in the prior year, managing to still beat street estimates on a difficult comparison in Q3. Diluted earnings per share increased by 14% increase in diluted earnings per share to $8.07, an impressive feat when one considers the company’s 39% plus EPS growth in Q3 of last year. We continue to be impressed by ORLY’s management team and their focus on out executing the competition and on delivering excellent product availability and customer service during a difficult period for retailers challenged by supply-chain constraints and exploding freight costs.
Microsoft
Microsoft Corporation (NASDAQ:MSFT)’s FQ1 2022 (CQ3 2021) results came in nicely ahead of street expectations, with revenues of $45.32B beating consensus estimates of $44.00B and EPS of $2.27 vs the street’s $2.08 estimate. MSFT delivered broad-based strength as Productivity & Business Processes, Intelligent Cloud, and Personal Computing all came in ahead of expectations. Furthermore, FQ2 2022 guidance for revenues for Productivity and Business Processes, Intelligent Cloud, and more Personal Computing were also ahead of consensus, particularly Cloud with Azure growth guidance beating the street. We continue to regard MSFT as one of the best run, high quality enterprise and consumer software companies with the ability to compound intrinsic value at double digits for the foreseeable future.
Bottom 3 Contributors:
Mastercard
Mastercard Inc (NYSE:MA)’s Q3 2021 earnings results delivered revenues of $4.99B and EPS of $2.37 both ahead of the street’s $4.95B/$2.19 estimates. High margin cross border transaction volumes were better than expected as various countries started to reopen their borders to foreign travelers. Management guided Q4 2021 solid net revenue growth of low 20%. MA has gotten caught up with the shift in street sentiment on the payment sector which began in Q3, partly as a result of the huge rally in these names in 2020 likely resulting in many traders booking profits in these higher valuation names and rotating into more cyclically sensitive sectors in the latter half of 2021, and partly because continued supply chain issues may result in a more muted eCommerce holiday season which could impact volumes in Q4. Our investment thesis in MA (and our other payment fintech names) remains intact, and we believe that MA can continue to deliver strong double-digit revenue and earnings growth over the next 3-5 years.
Amazon
Amazon.com, Inc. (NASDAQ:AMZN)’s Q3 results and Q4 guide came in mixed. Q3 revenues of $110.81B were slightly below street estimates of $111.55B but EPS of $6.12 were markedly below consensus at $8.90 on higher costs (wage and freight) hitting operating margins, 4.4% vs consensus at 4.9% and last year’s 6.4%. Management is expecting the cost pressures to continue into Q4 and issued a weaker than expected revenue forecast for the upcoming holiday quarter, given supply-chain issues and expected resurgence in consumers shopping in stores at the expense of online this holiday season. We view the cost pressures as temporary that will abate, while Amazon’s AWS cloud services growth and margin improvement and N. America retail acceleration post-reopening will be more sustainably positive for the company going forward.
PayPal
Paypal Holdings Inc (NASDAQ:PYPL) reported slight misses on revenues ($6.18B vs $6.23B Street estimates) and Transaction Processing Volumes ($310B vs $312.4B estimates), while beating slightly on EPS ($1.11 vs $1.07 consensus estimates). PYPL’s results this quarter were mixed at best, and, furthermore, guidance for Q4 was not stellar with both Revenue and EPS slightly below consensus. Much like MA above (and the other digital payments companies in the space), the stock’s stellar performance in 2020 has presented very difficult comparisons for PYPL and has required a bit of a reset in the latter half of 2021 as management comes out with slightly more conservative guidance. We remain bullish on PYPL’s long-term prospects as the secular trends of eCommerce and paper-to-digital payments conversion continues to play out over the coming years.


