
Horizon Kinetics letter for the month of April 2018, titled, “The Failure Of The ETF Phenomenon: 20 Years Of History, And The Market Has Spoken.”
Q1 hedge fund letters, conference, scoops etc, Also read Lear Capital
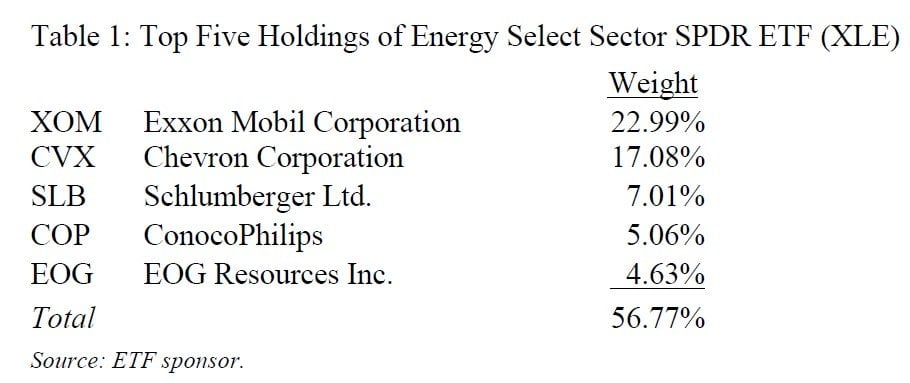
Here is an interesting oddity of the ETF phenomenon. The largest ETF in the energy field is the SPDR Energy Select Fund (XLE), with about $18.3 billion in assets under management. For the 12 months ended March 31, 2018, the return was -0.39%. A year earlier, on March 31, 2017, West Texas Intermediate oil (WTI) was trading for $50.54 per barrel, as noted by the United States Energy Information Agency. On the last day of trading in March 2018, WTI traded at $64.87 per barrel. This is an increase of 28%, and it is fairly self-evident that most energy company profits will rise enormously when the first-quarter 2018 profits are reported in relation to the first quarter of 2017. Yet, the XLE shares trade at essentially unchanged prices.
Here are the top five holdings:
More than half of the fund is composed of five stocks. If ExxonMobil were merely an energy stock, the phenomenon of unchanged prices in a time of a dramatic increase in energy prices would be incomprehensible. Yet, ExxonMobil is not merely an energy stock. It is a significant presence in many indexes, of which we will only mention a few.
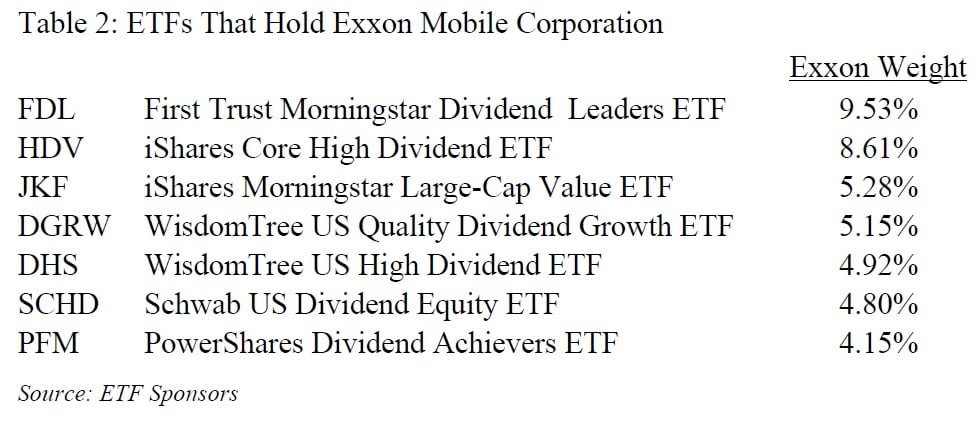
From the list of ETFs that include the company, we discover that ExxonMobil can be a growth stock, it can be a value stock, it can be a quality stock, it can be a yield stock. ExxonMobil can be many things, because being something is apparently in the eye of the beholder.
At the end of March 2017 when oil was at $51 a barrel, Exxon traded at $81 a share, and at the end of March 2018 with oil higher, at $64 a barrel, Exxon traded lower, at $73 a share. This is because the ExxonMobil shares in their utility for indexation purposes as a bond-substitute in dividend yield ETFs, in dividend growth ETFs, etc. – separate from ExxonMobil as an energy business – are worth less money since the 10-year Treasury yields more at the end of March 2018 than it yielded at the end of March 2017.
Exxon is forecasted to earn $4.81 a share in 2018. At the end of March 2018, the shares were trading at a P/E of 15.8x. The estimates are based on the presumption of a $60 per barrel oil price for 2018. As of April 13, 2018, WTI trades at over $67 a barrel and North Sea Brent is trading at over $72 a barrel.
Assume that in March 2017, an active portfolio manager with profound knowledge of the energy industry correctly forecasted a substantial increase in oil prices and overweighted the portfolio with energy stocks. The self-evident result would have been underperformance. Of course, it should be stated that the ExxonMobil share price did not substantially decline as energy prices declined from over $100 a barrel in 2014 to about $40 a barrel at the low. This is because even then Exxon was classified, for indexation usage, as more than simply an energy stock or a dividend stock. One cannot purchase such shares that are in heavy demand, due their great trading liquidity, by a broad variety of indexes apart from the company’s industry sector, without being cognizant of changes in central bank policies.
The result of indexation over the long term is that large cap liquid shares, and even small cap liquid shares, especially those that pay substantive dividends, primarily reflect central bank policies, rather than fundamental business conditions, even over the long term. Consider the following table.
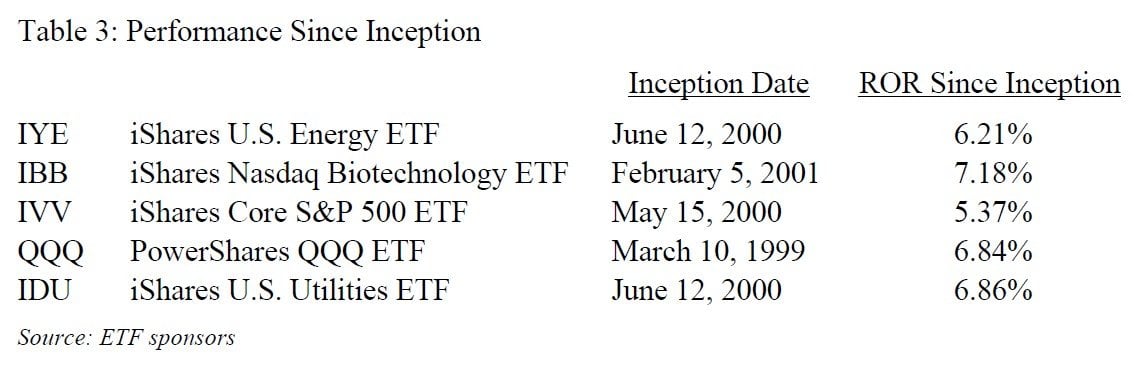
The iShares U.S. Energy ETF has had a 6.21% annualized return since its inception on June 12, 2000. The iShares Nasdaq Biotechnology, with a completely different focus, had a February 5, 2001 inception, slightly different than the IYE date but in the same realm. Its return since inception is 7.18%. Now let us take the S&P 500, a more diversified index. The iShares Core S&P 500 ETF (IVV), with an inception date of May 15, 2000, had a return since inception of 5.37%. The PowerShares NASDAQ 100 QQQ, which is composed primarily of technology stocks and biotechnology stocks, has a 6.84% return since its inception on March 10, 1999. The iShares U.S. Utilities ETF (IDU) has nothing to do with energy or biotechnology. Its return since the June 12, 2000 inception date is 6.86%.
They all have more or less the same rate of return. The differences in rates of return are more attributable to differences in inception date than to the fundamental attributes of the companies in the funds. The companies in question have sufficiently liquid shares that they are subject to excess demand as raw material for indexation’s needs. So much so that they have become denatured or commoditized – stripped of their industry- and business-specific idiosyncrasies. They reflect, rather, the flows of funds into and out of stocks, which in turn is clearly a function, at these interest rate and valuation extremes, of Federal Reserve policy. They have become mechanisms – however inadvertently – of policy transmission. They’re no longer companies that have prices that are a function of fundamental values.
See the full PDF below.


