Alpine Capital Research commentary for the first quarter ended Mar 30, 2018; titled, “Quantifiable Absolute Returns.”
Q1 hedge fund letters, conference, scoops etc, Also read Lear Capital
Volatility has returned to financial markets in 2018, yet precipitous price declines have not. Daily volatility is higher, but the market is near break-even for the year. Underneath the surface, some securities have declined, giving rise to a few more ideas to research. Yet to keep the state of the financial markets in perspective, if this was the beginning of a bear market, we’d still be in the first inning with one out.
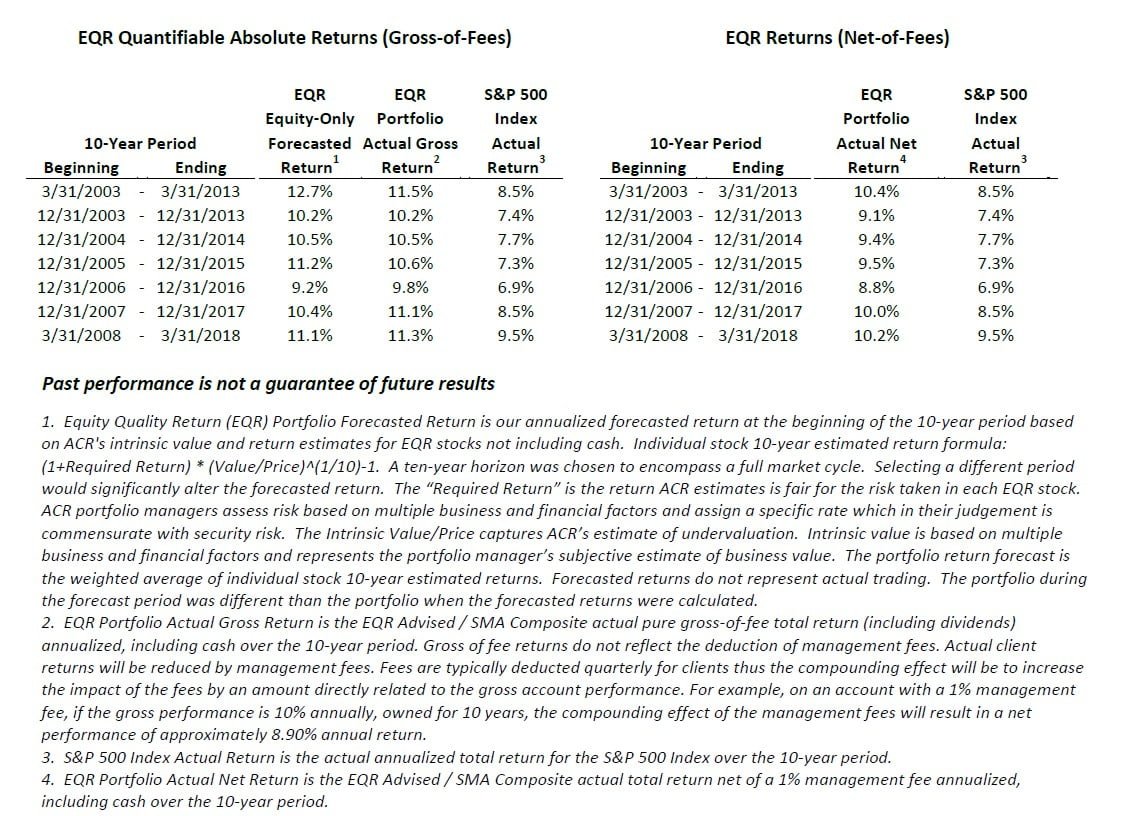
ACR welcomes bear markets because they provide us with attractive buying opportunities to deploy our cash. ACR investors also need not fear for their current holdings in a bear market, assuming our valuations were performed well up-front. A perfectly executed valuation mathematically quantifies an asset’s future investment return – valuation and return are two sides of the same coin. To test the quality of an historical valuation, valuation parameters can be plugged into a formula to forecast a future return, which can then be compared to the actual future return. ACR has maintained this data for our Equity Quality Return (EQR) stock strategy since March 2003, and we thought this would be interesting information to share with you.
The table shows that our forecasted ten-year EQR return at the beginning of the period is very close to the actual EQR return earned in the subsequent ten years. A few observations.
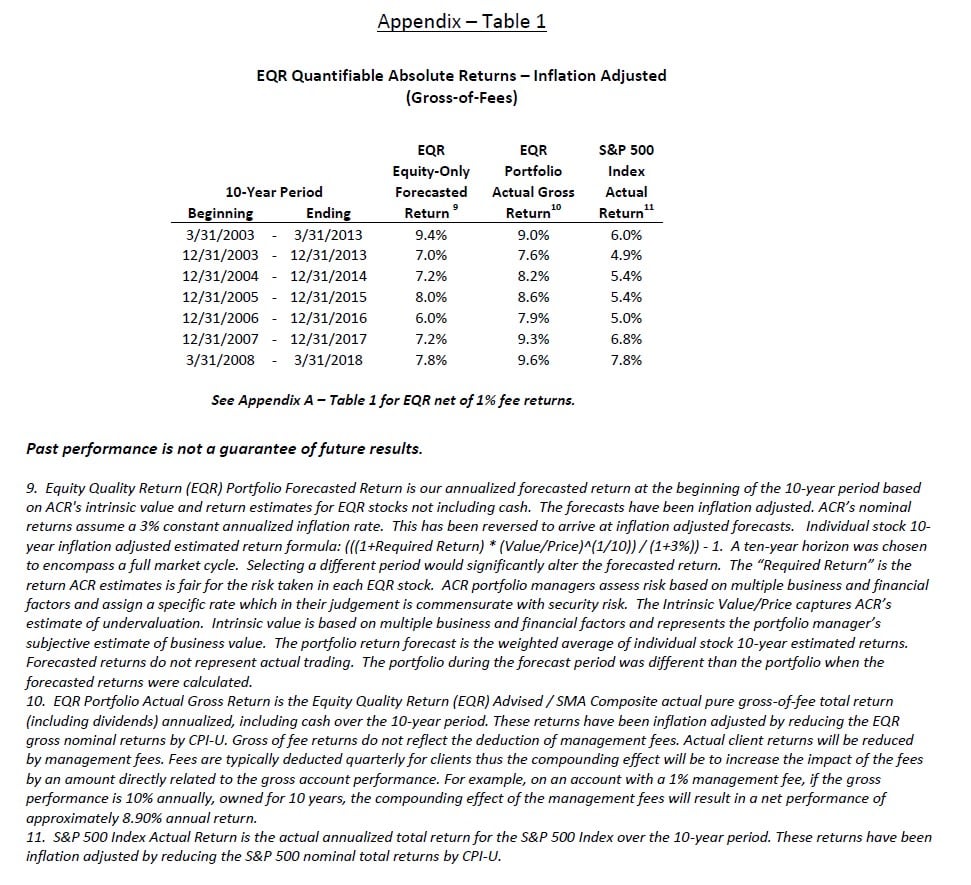
The actual return compares more favorably to the forecasted return after inflation. The ACR investment team has not lowered its nominal required return for the lower general inflation rate experienced in recent years. ACR’s required return generally reflects 3% inflation. As inflation turned out to be lower, ACR portfolio managers did not explicitly reduce our required return accordingly. As a result, our forecasted return has been somewhat inflated in nominal terms, whereas an investor’s actual purchasing power was only reduced by the lower actual inflation rate. A comparison of forecasted and actual returns reveals this dynamic. (See Appendix – Table 1).
EQR’s forecasted return does not include cash; EQR’s actual return does include cash. Since cash has earned such a low return in recent years, one might wonder how our actual return with cash could be better than our forecasted return without cash. One reason is that our average holding period was less than ten years. In other words, we realized value quicker, which generated a higher stock return that offset the lower cash return. The question of whether our cash added value on a risk-adjusted basis is more difficult to answer. We are exploring various methodologies for addressing this question and will share the details if we find a credible result.
There is nothing magical about a ten-year period; a full cycle is the relevant period for evaluating results. Ten years was chosen for simplicity of presentation and because it is usually long enough to encompass a full cycle. Interestingly, unless we have a bear market this year, the full cycle will extend beyond ten years, a relatively rare occurrence. ACR defines a full cycle as a peak-to-peak period which includes a price decline of over 20% and a subsequent price increase above the previous peak.
While the forecasted return has been a good barometer for the actual return, we are more conservative when estimating future capital market returns. ACR’s philosophy rests on the margin of safety principle. We therefore adjust our forecast return lower for planning purposes because we don’t want to cut it close (see our January 2018 commentary for a full discussion on “margin of safety”). Private client wealth planning goals, endowment and foundation spending rates, and pension return on plan asset assumptions, all rely on sound capital market return assumptions. ACR is very diligent about getting these numbers right. Your ACR client relations representative can provide additional details.
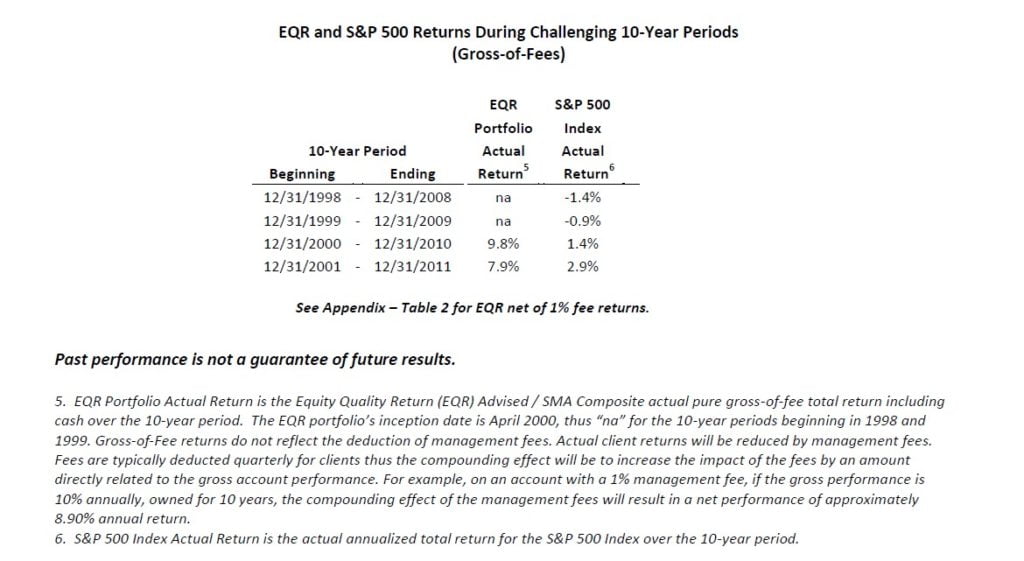
The ending years in the previous table occur during highly buoyant markets. Market returns, even over longer periods, can look very different during less favorable markets. ACR believes that today’s historically high valuations of over 30x cyclically adjusted earnings could produce significantly lower future market returns. The data support our view. The last time the market was valued this high was from 1998-2001. Subsequent ten-year stock market returns from this period were poor, as shown in the following table.
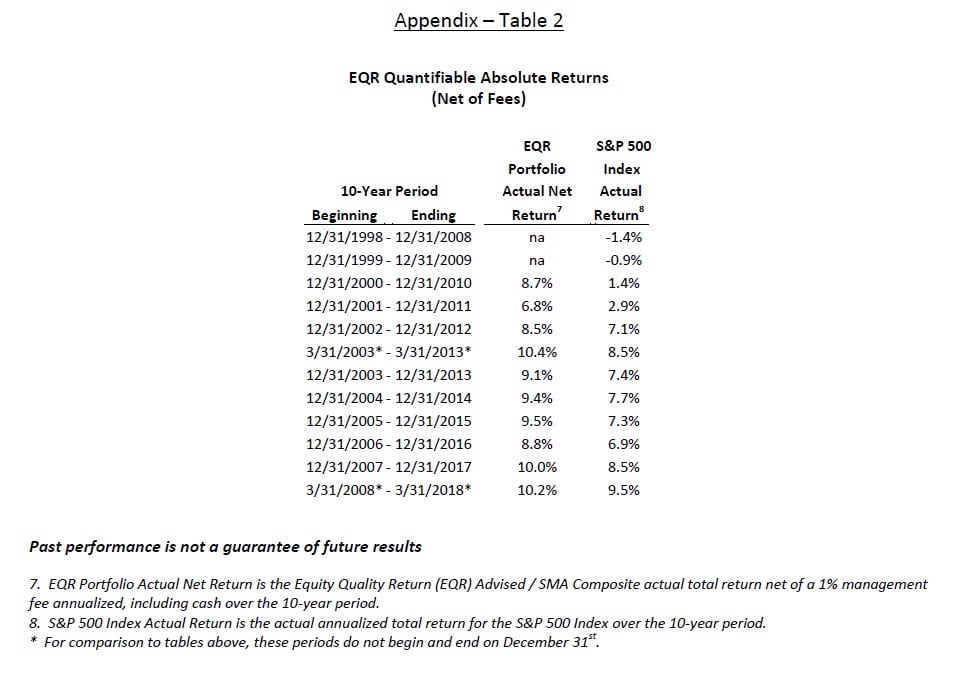
Investment returns during challenging ten-year periods highlight the meaning of the term “absolute” in the title of this commentary. ACR’s objective is to seek satisfactory absolute returns over a full market cycle. As it turns out, our absolute valuation discipline produced a satisfactory result, even during periods when the market did not. As shown in the previous table, markets do not always provide a satisfactory return over a full cycle. A return of 2% per year would have beat the market during the 2000-2010 period, but we would not consider this “relative” return satisfactory on a standalone basis.
In a market like today’s, which implies lower future returns, ACR will not waiver from our absolute return valuation discipline. With the benefit of experience and data on our side, we are unafraid to under-perform the market in the short-term when we are confident of the continued success of our strategies at achieving their valuation forecast returns in the long-term. We greatly appreciate your patience during this period of elevated prices.
Nick Tompras
See the full PDF below.


