The longer inflation remains subdued, the longer this expansion lasts. The question here is simple – Are equities over- or undervalued with current inflation values? Here’s a look.

Q2 hedge fund letters, conference, scoops etc
(For bottom-liners – with the today’s inflation readings close to 3%, stocks will be teetering for the next couple of years. That is, unless inflation subsides.)
| Country | Y/Y CPI | Y/Y STOCK MARKET | Month |
| United States | 31-01-50 | ||
| United States | 28-02-50 | ||
| United States | 31-03-50 | ||
| United States | 28-04-50 | ||
| United States | 31-05-50 | ||
| United States | 30-06-50 | ||
| United States | 31-07-50 | ||
| United States | 31-08-50 | ||
| United States | 29-09-50 | ||
| United States | 31-10-50 | ||
| United States | 30-11-50 | ||
| United States | 29-12-50 | ||
| United States | 23.3113633 | 31-01-51 | |
| United States | 23.89402281 | 28-02-51 | |
| United States | 20.61635525 | 30-03-51 | |
| United States | 10.25096 | 21.33826559 | 30-04-51 |
| United States | 10.08047 | 11.74022021 | 31-05-51 |
| United States | 9.686971 | 16.03462293 | 29-06-51 |
| United States | 9.556025 | 23.14231137 | 31-07-51 |
| United States | 8.792596 | 24.61382395 | 31-08-51 |
| United States | 9.00335 | 19.79148259 | 28-09-51 |
| United States | 8.683008 | 16.59481801 | 31-10-51 |
| United States | 8.760331 | 14.79349736 | 30-11-51 |
| United States | 8.751027 | 14.36156656 | 31-12-51 |
See the full list of inflation stocks here.
Starting with the U.S.
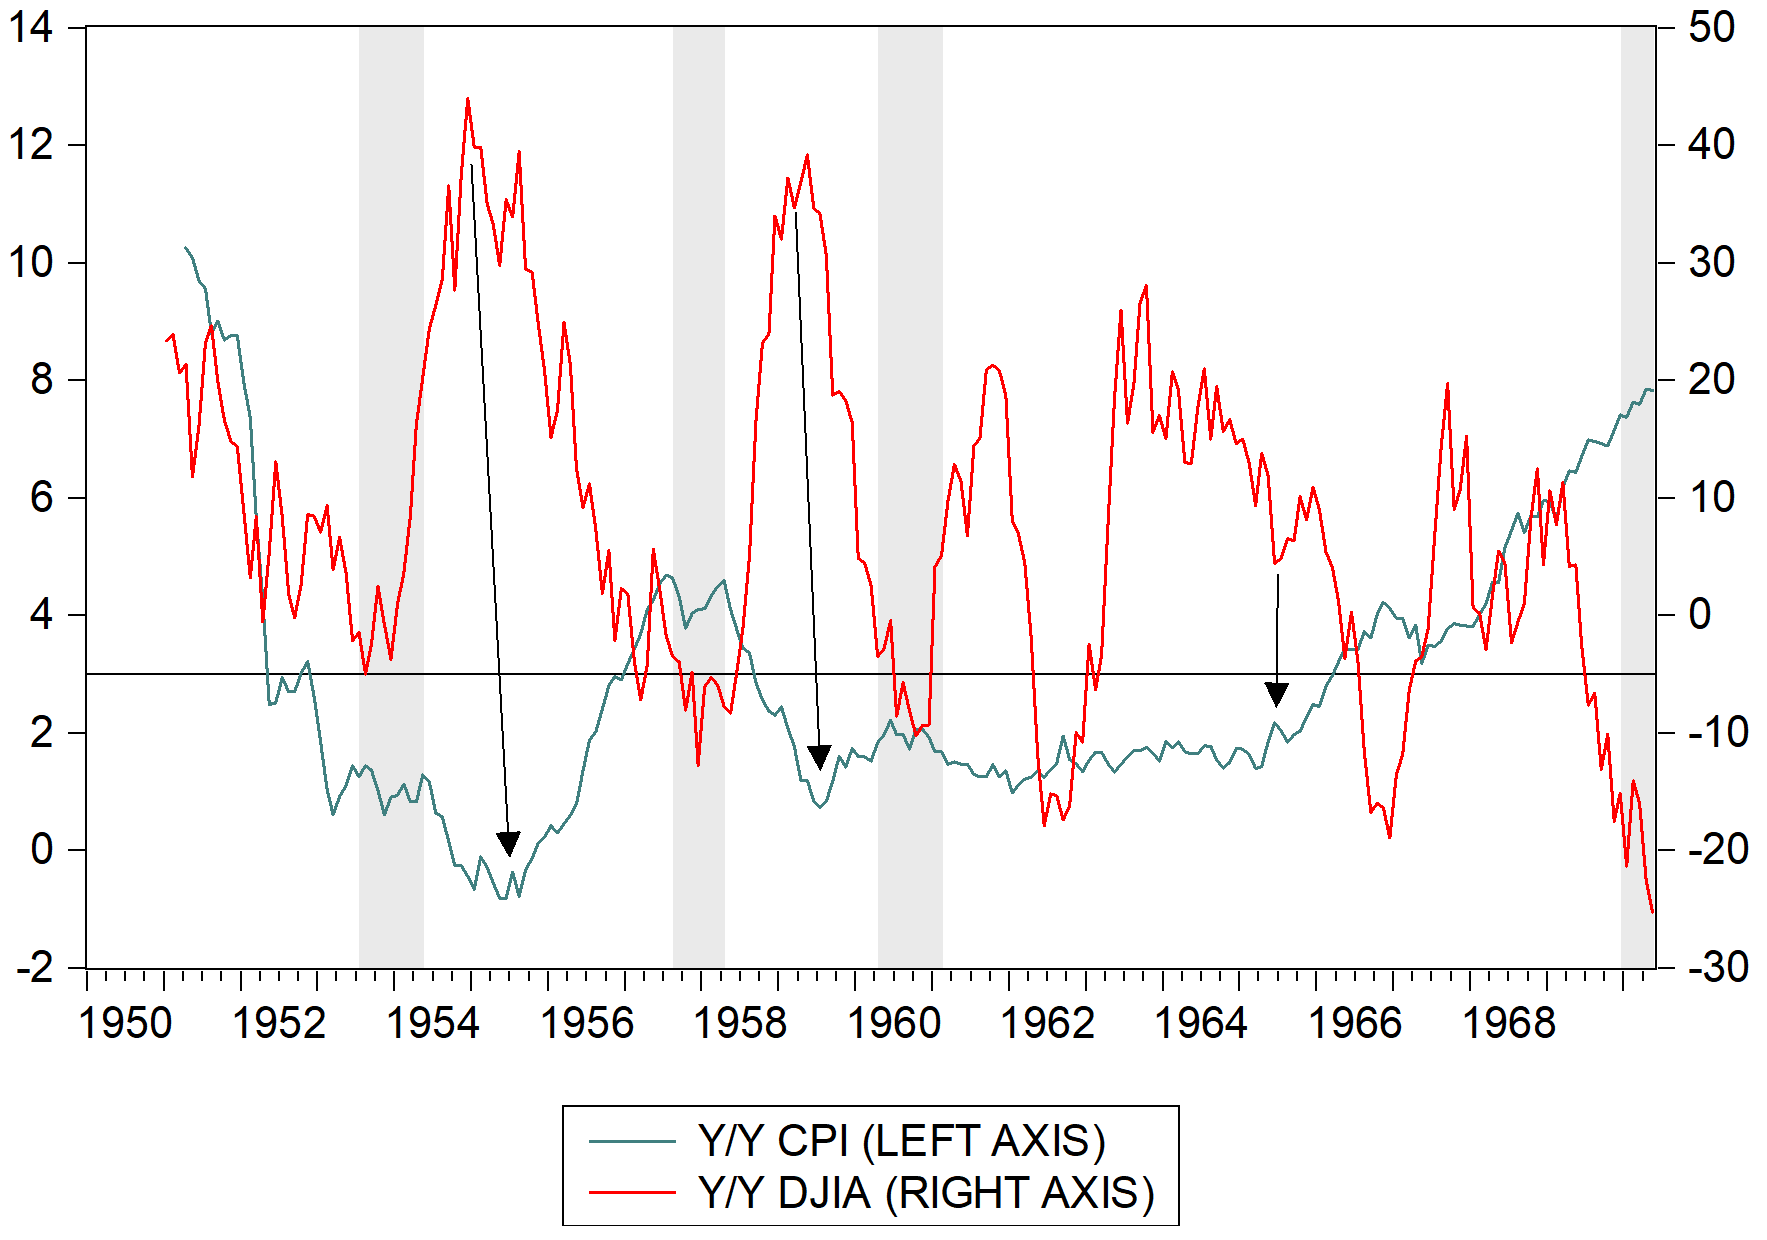
Inflation is almost always bad for stocks. Here’s a look at the U.S. relationship between the two in the 50s and 60s. When inflation bumped above 3%, as it is close to doing now, equity markets didn’t respond well. In fact, an inflation bottoming was a bad signal for stocks (arrows).
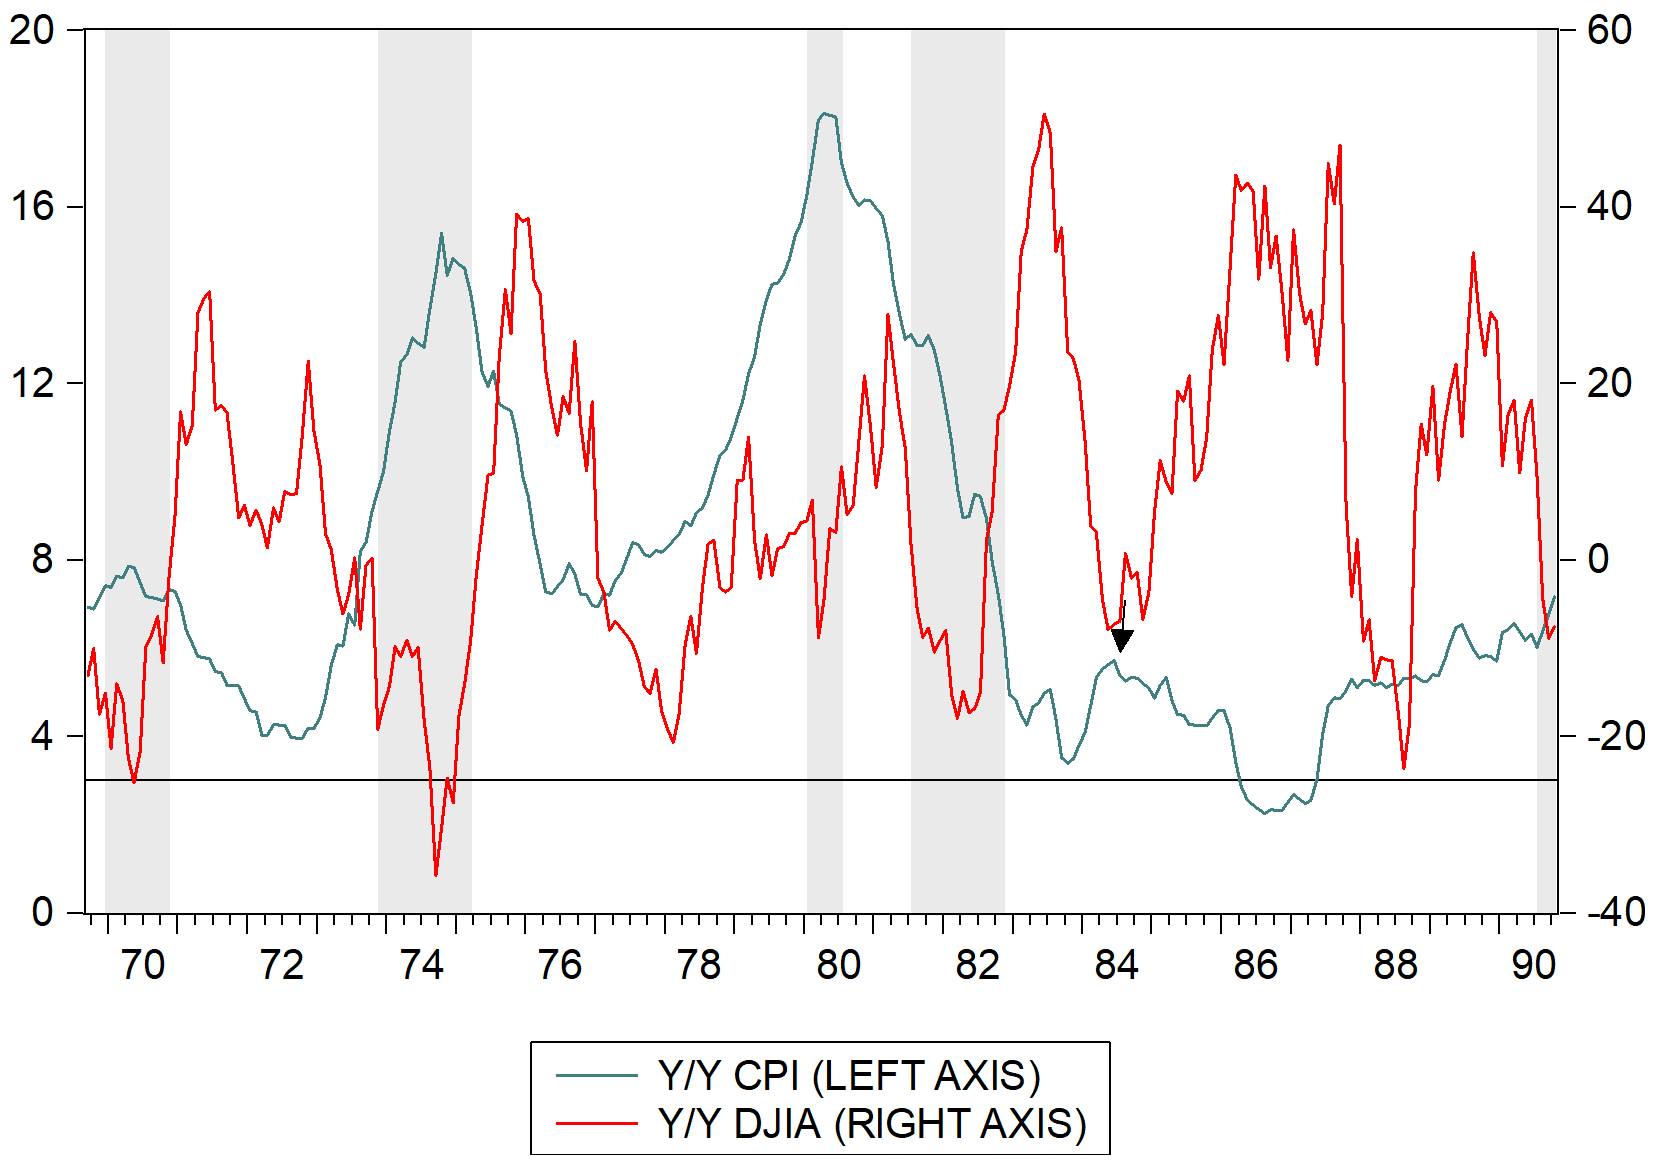
The 70s and 80s had inflation above 3% for most of the two decades. Markets spent more time in the negative. The one experience when inflation dropped below 3%, the equity markets boomed.
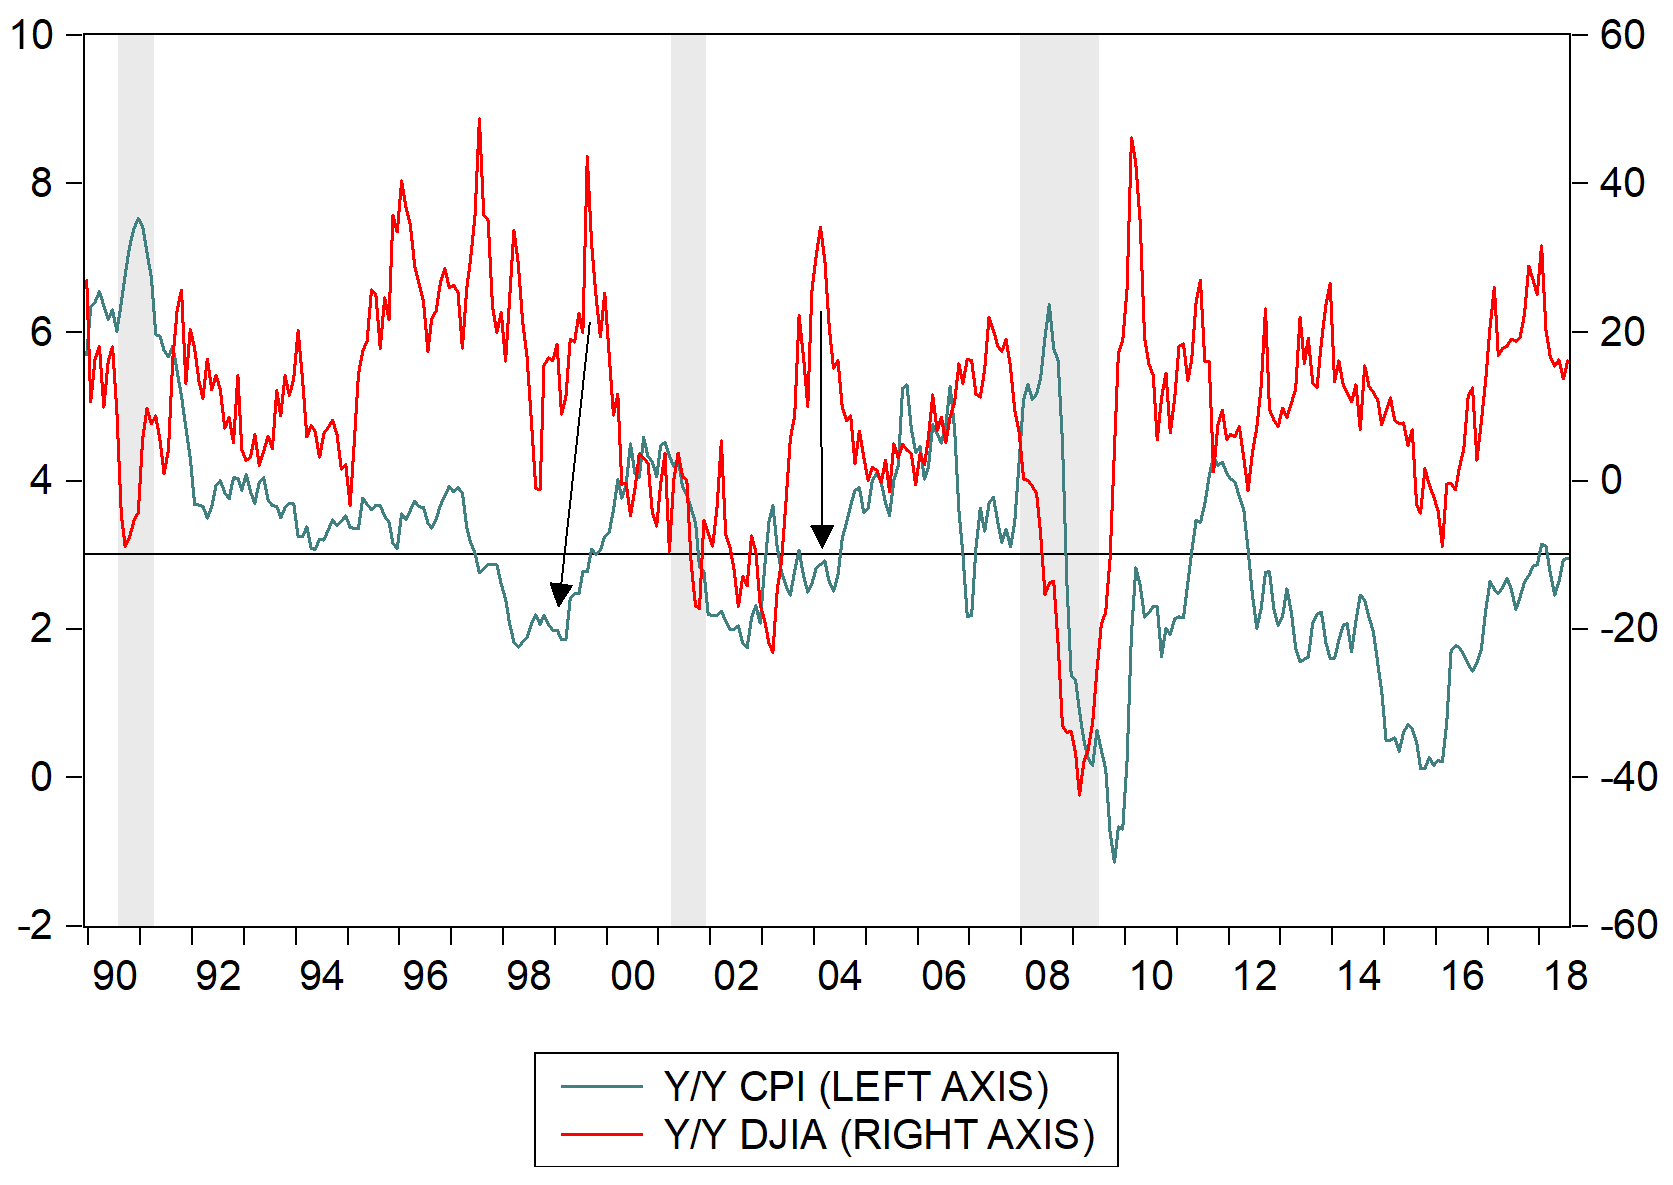
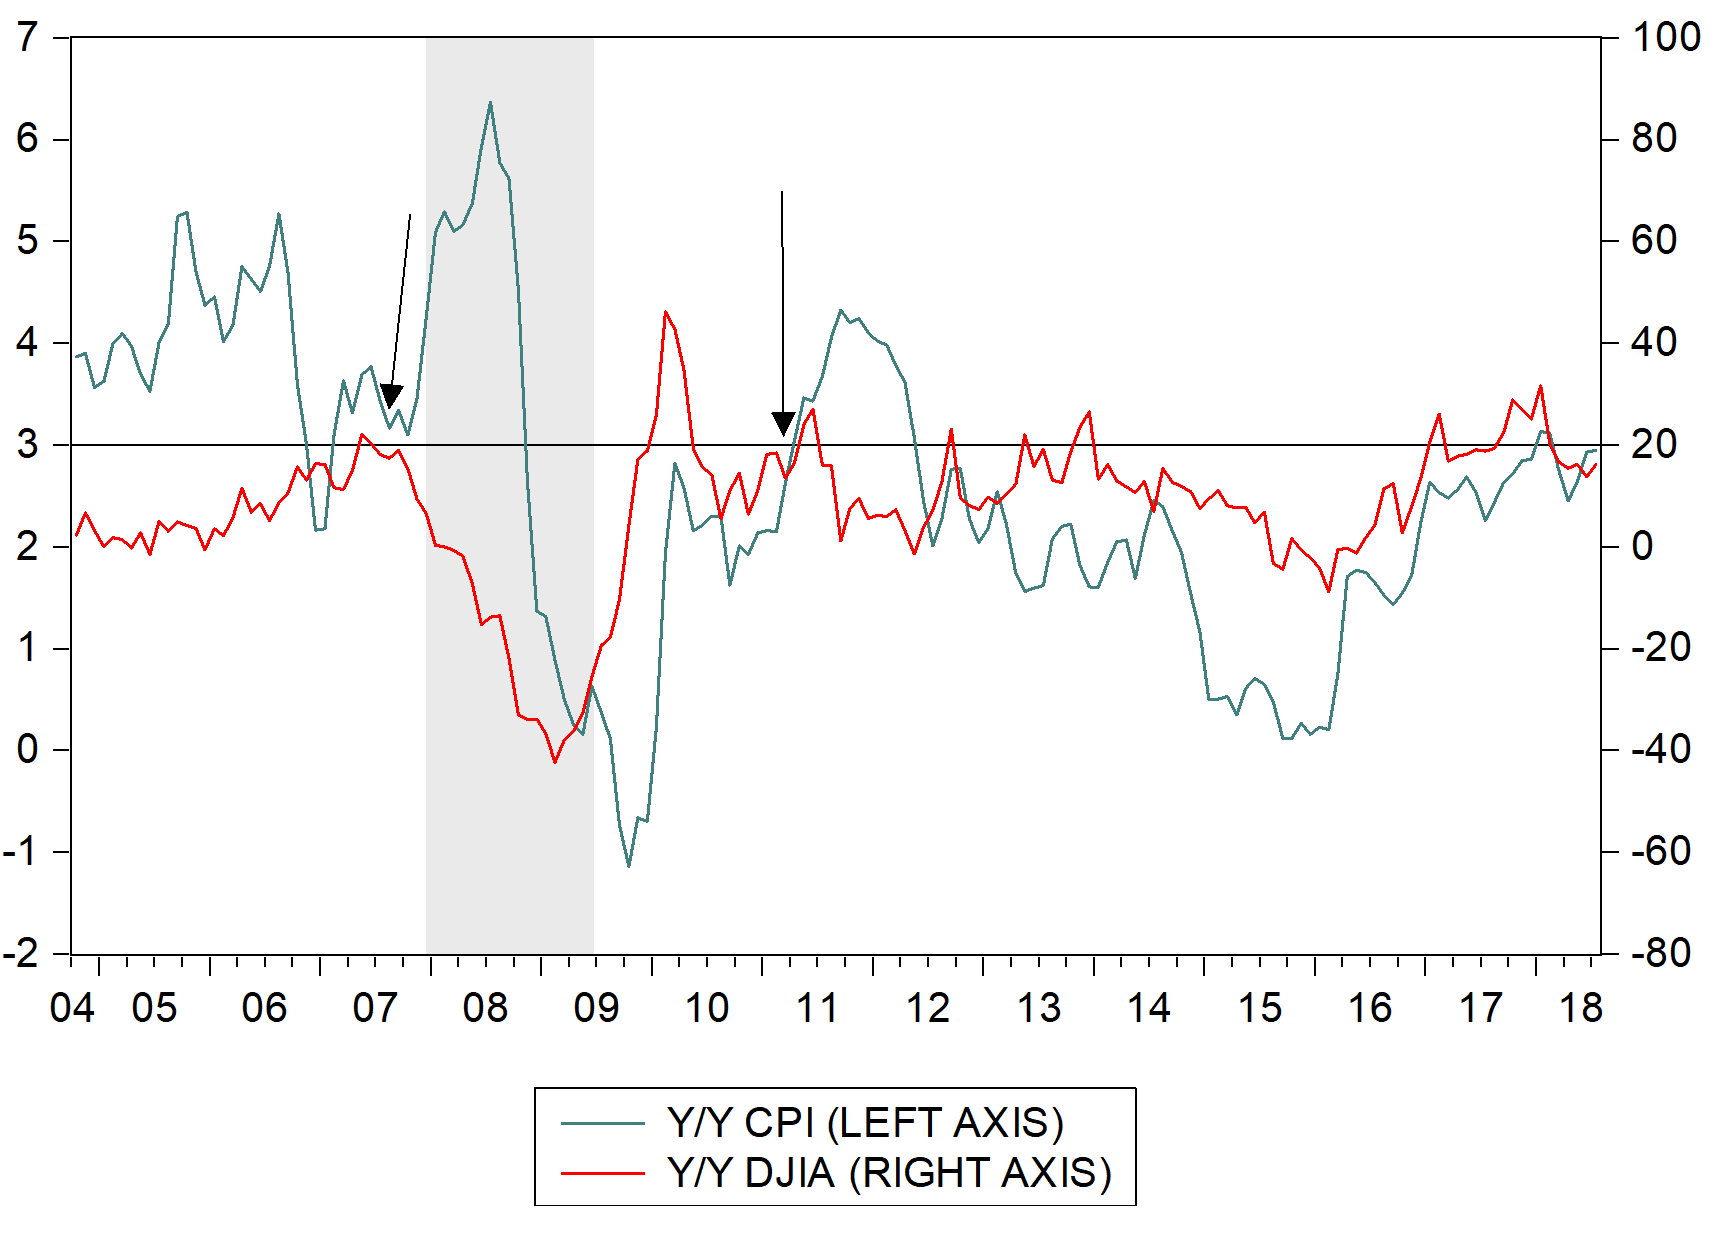
The 1990s to today experience is less conclusive. Except for two periods of a clear inverse relationship, inflation and stocks moved more closely together.
The U.S. Experience Bottom-Line
The just-shown three charts are nice, but what does the relationship show?
Below is the linear, correlation picture. The simple correlation line indicates that an inflation rate of 3% should have a DJIA of +35% year-over-year. Now, that’s an incredibly healthy return for 3% inflation. What gives? Well, the result stems mostly from the high-inflation years of the late 1970s/early 1980s.
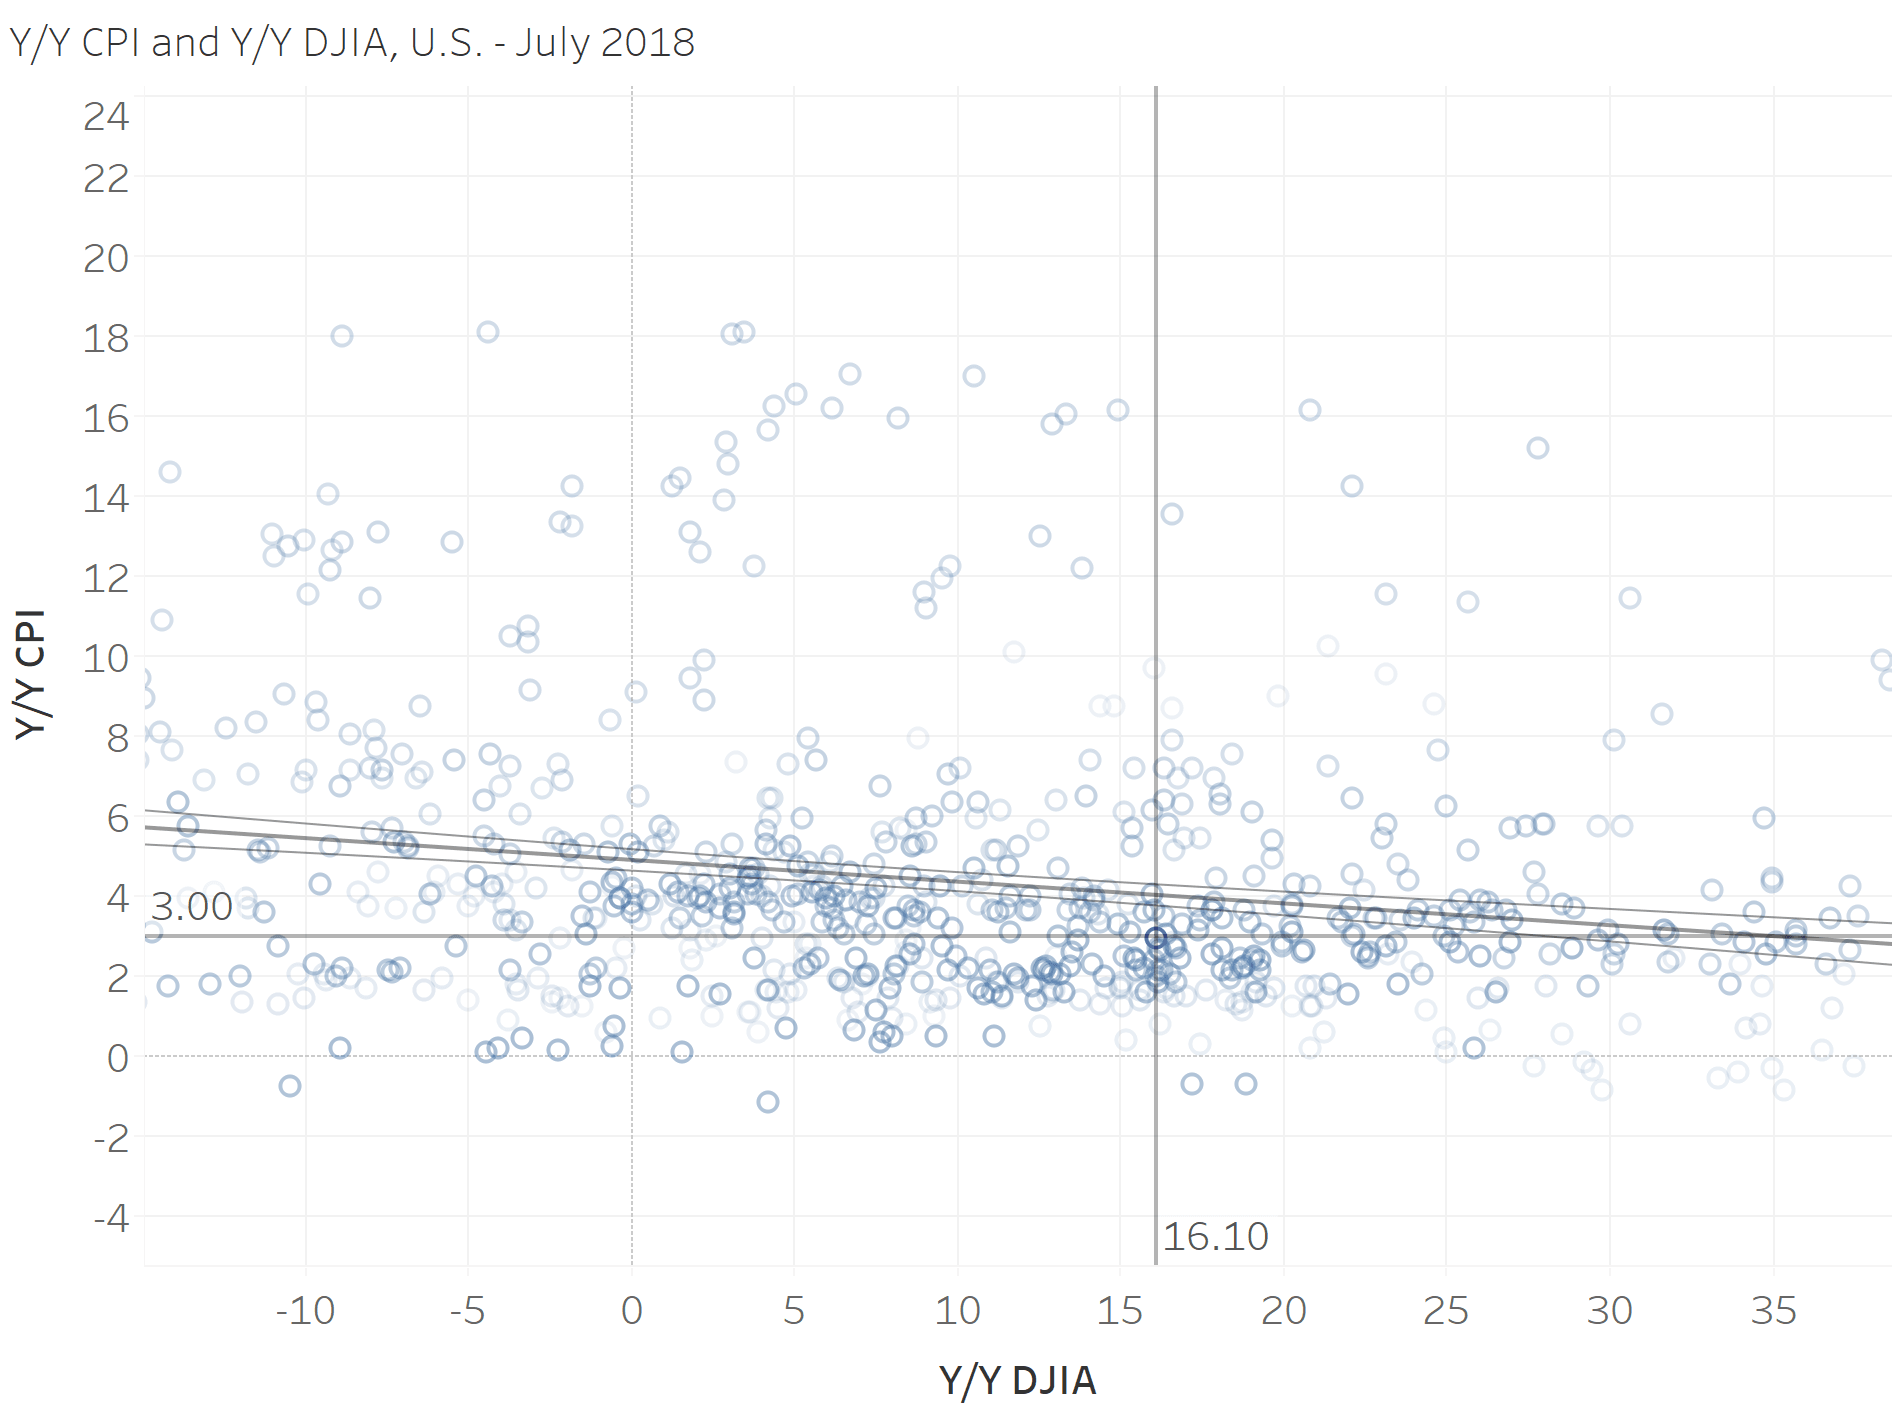
When constricting the period to the 1990s to today, the picture is different. See below.
Here’s the 1990s to today experience.
Curiously, the two measures – inflation and the return of the Dow Jones Industrial Average – are almost completely independent.
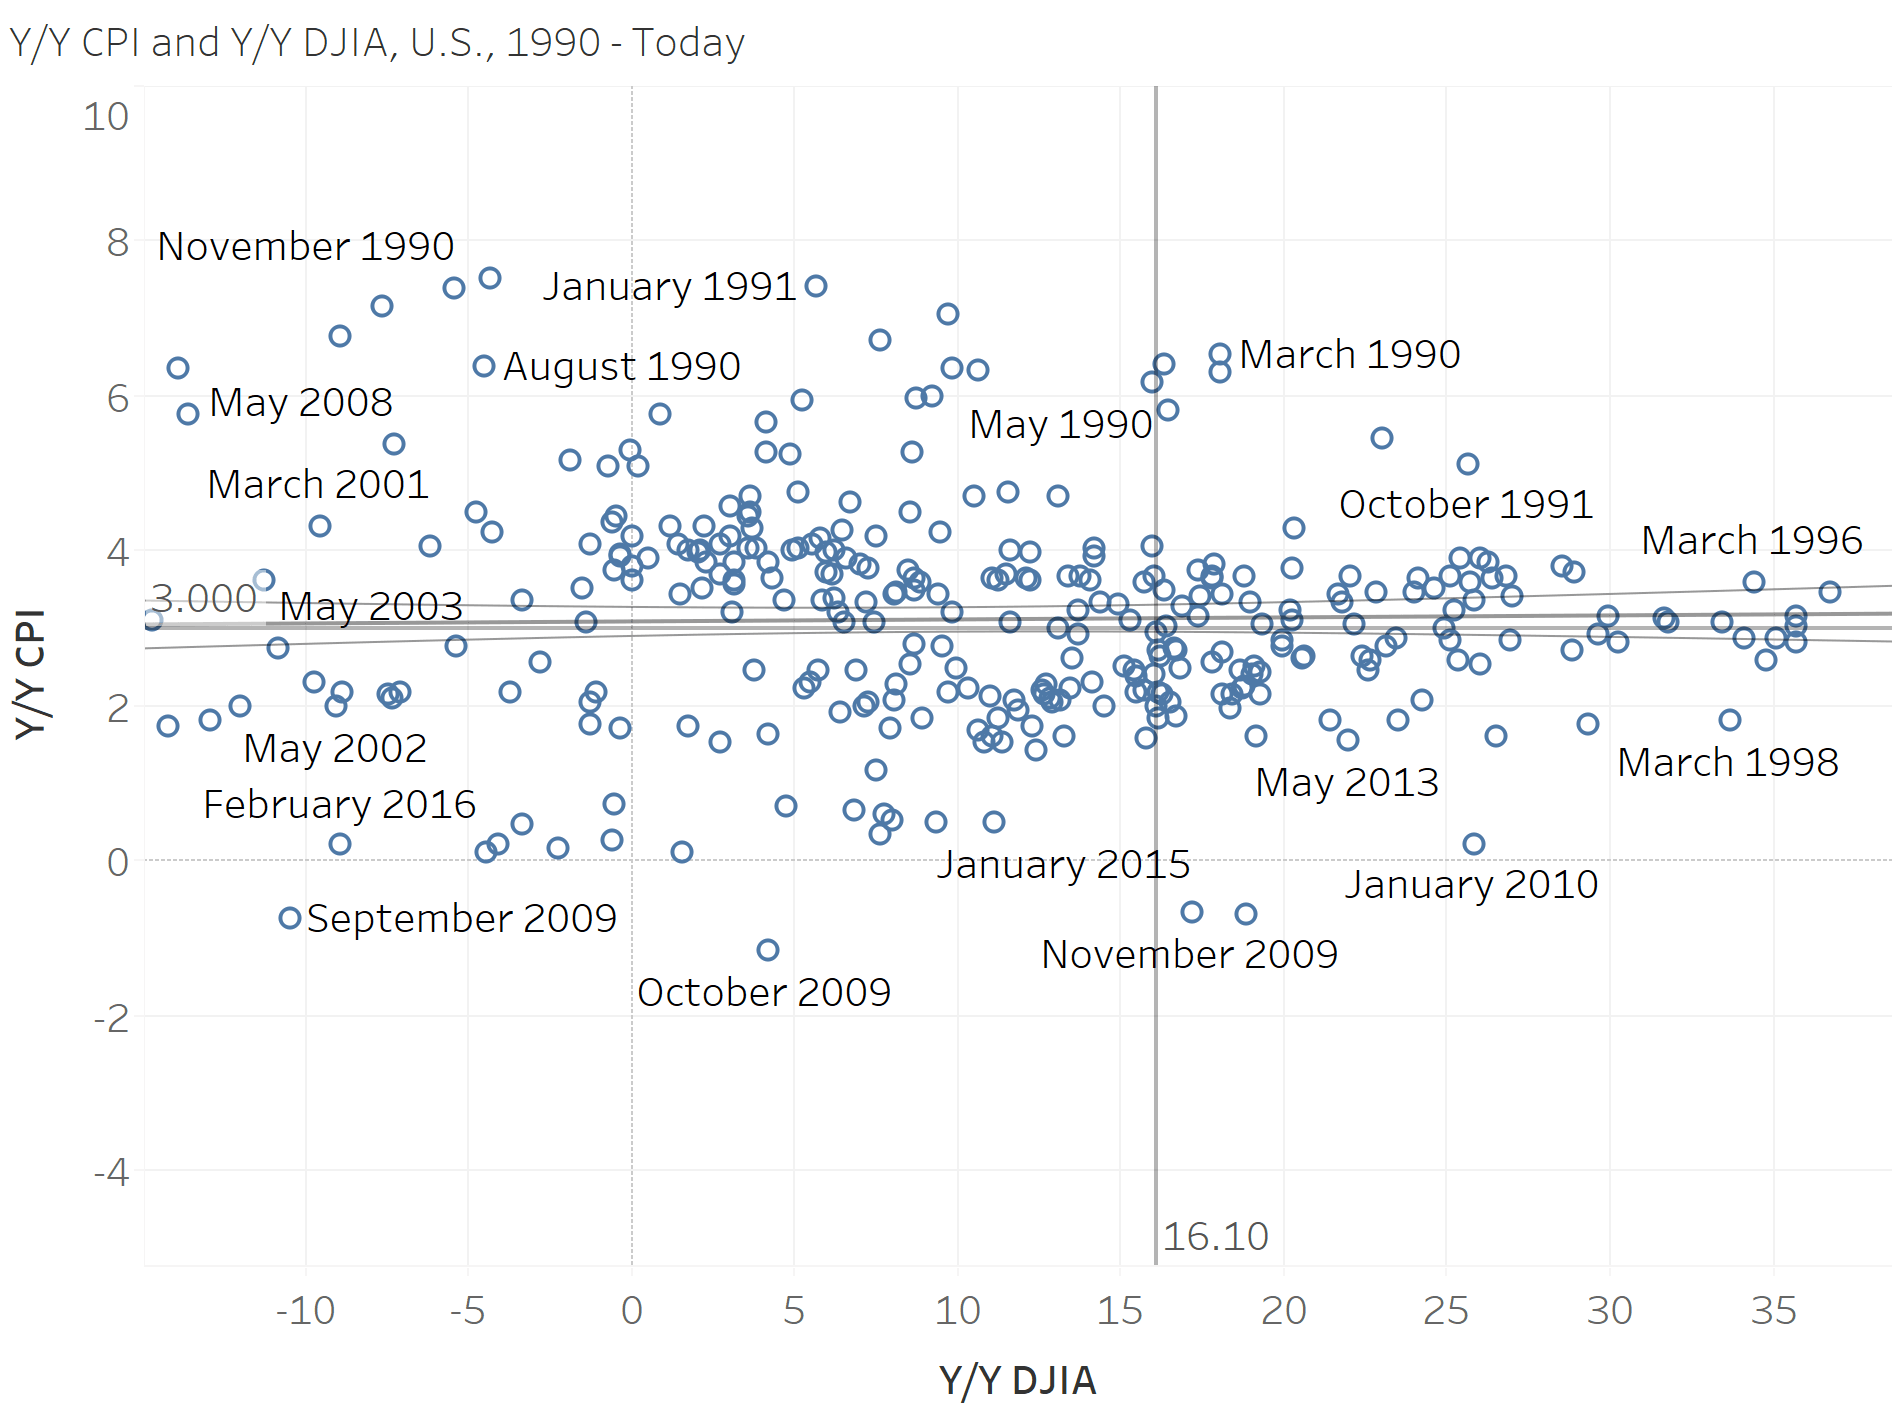
So then, are equities undervalued in light of the current inflation picture?
The answer is probably at the 3% threshold. The past two times when inflation bumped above 3%, stocks twittered between flat and negative returns.
The Global Picture
What about the international picture?
The global picture is fuzzier. Fitting an 8th order polynomial gives a downward sloping picture. With global inflation around 2%, one would expect equity markets to be up around 4%. In this case, global equity markets, up around 15%, global equities may be overvalued.
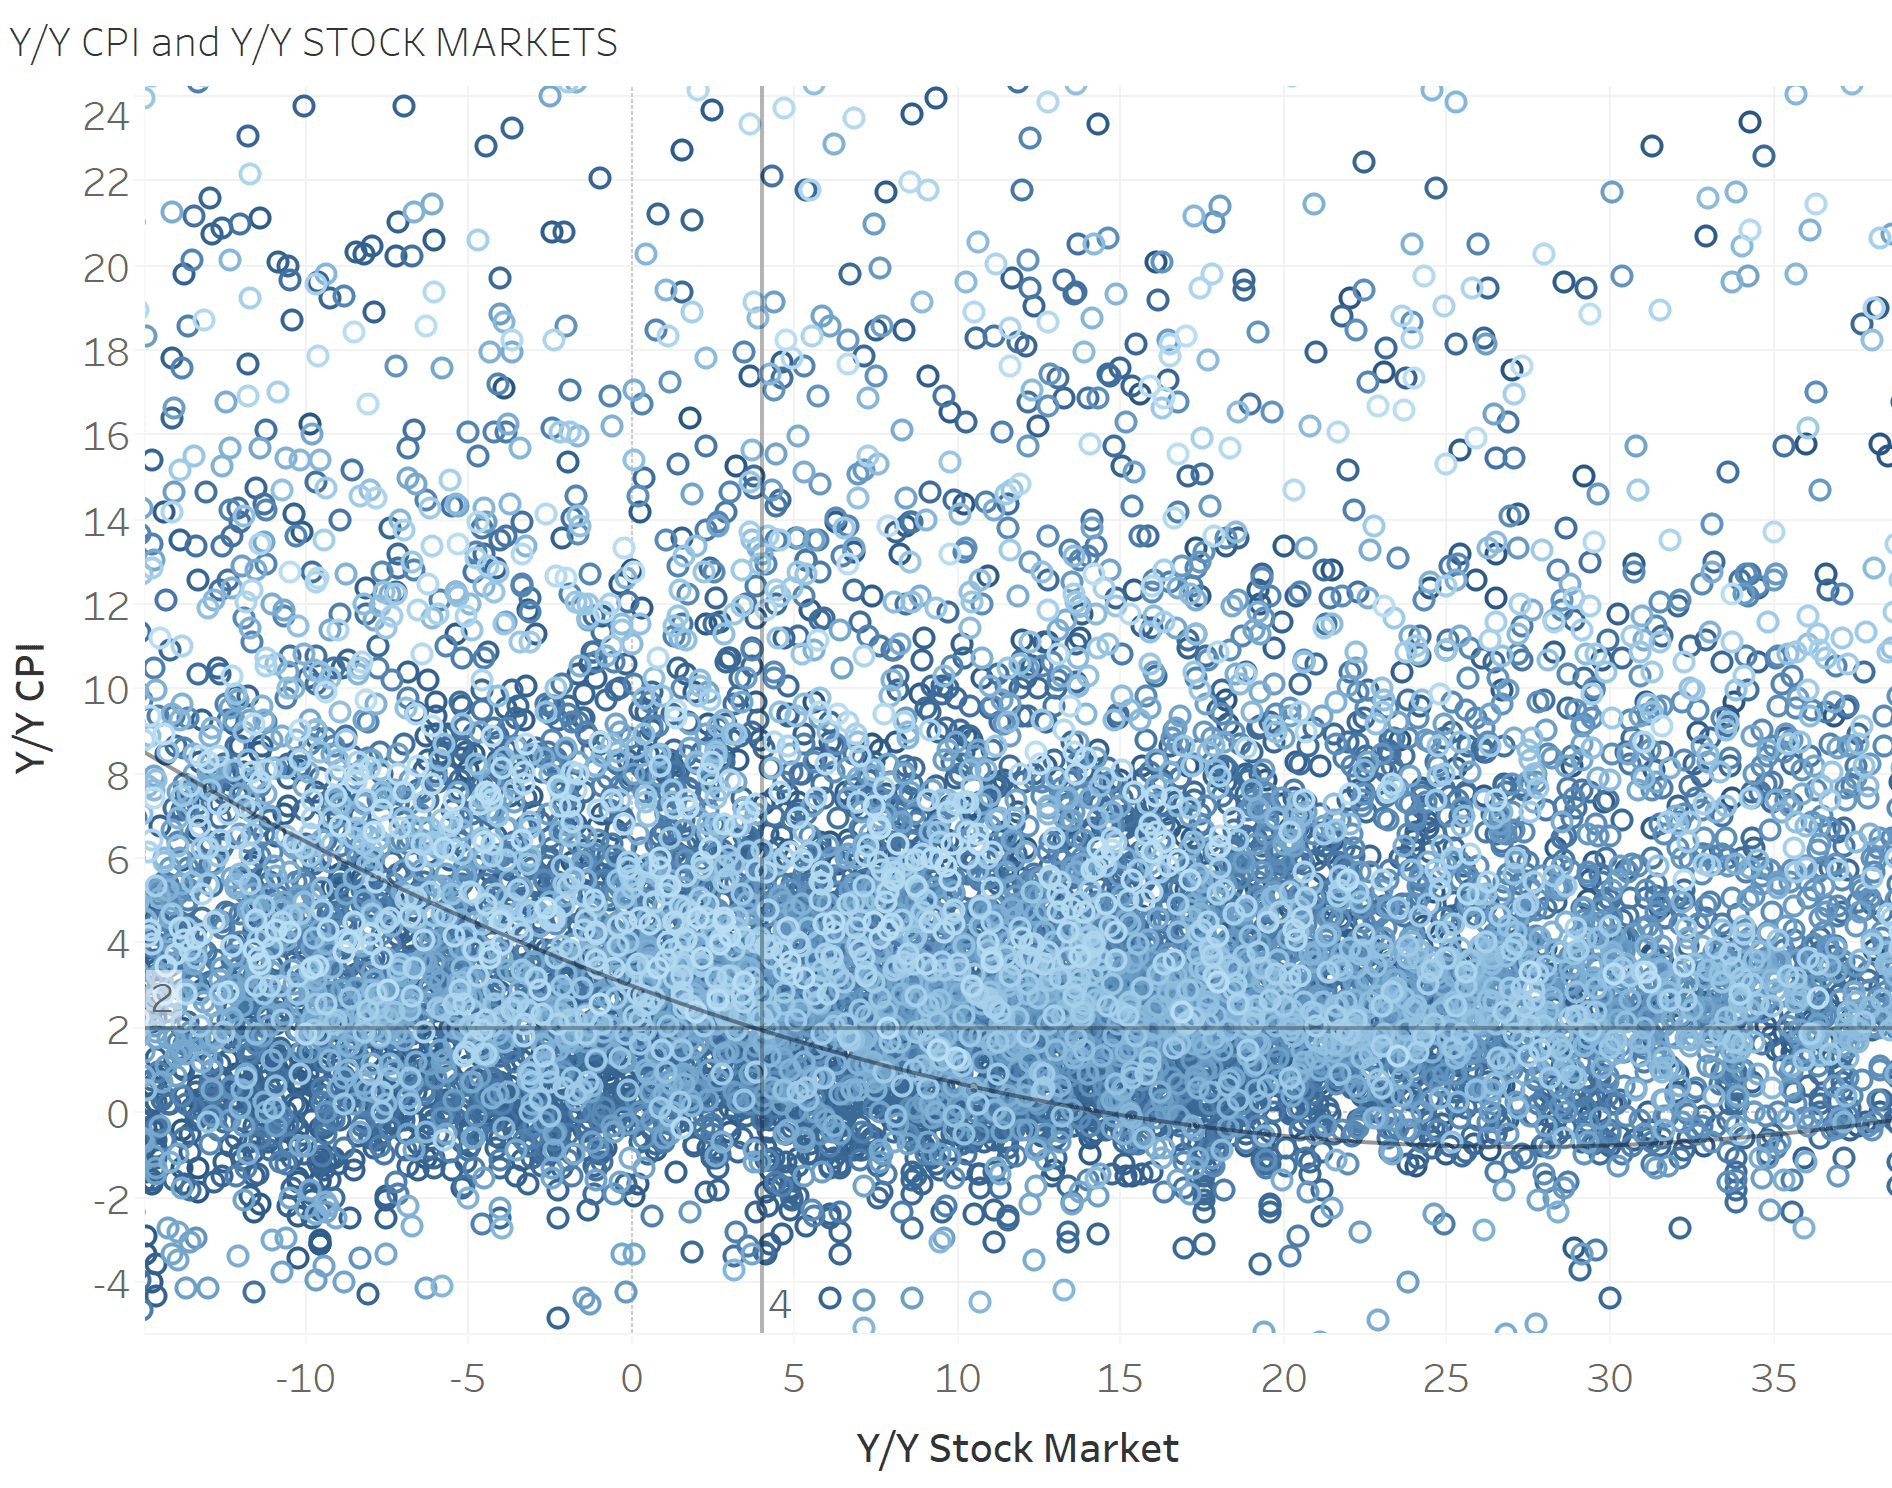
Is fitting an 8th order polynomial a useful exercise? No.
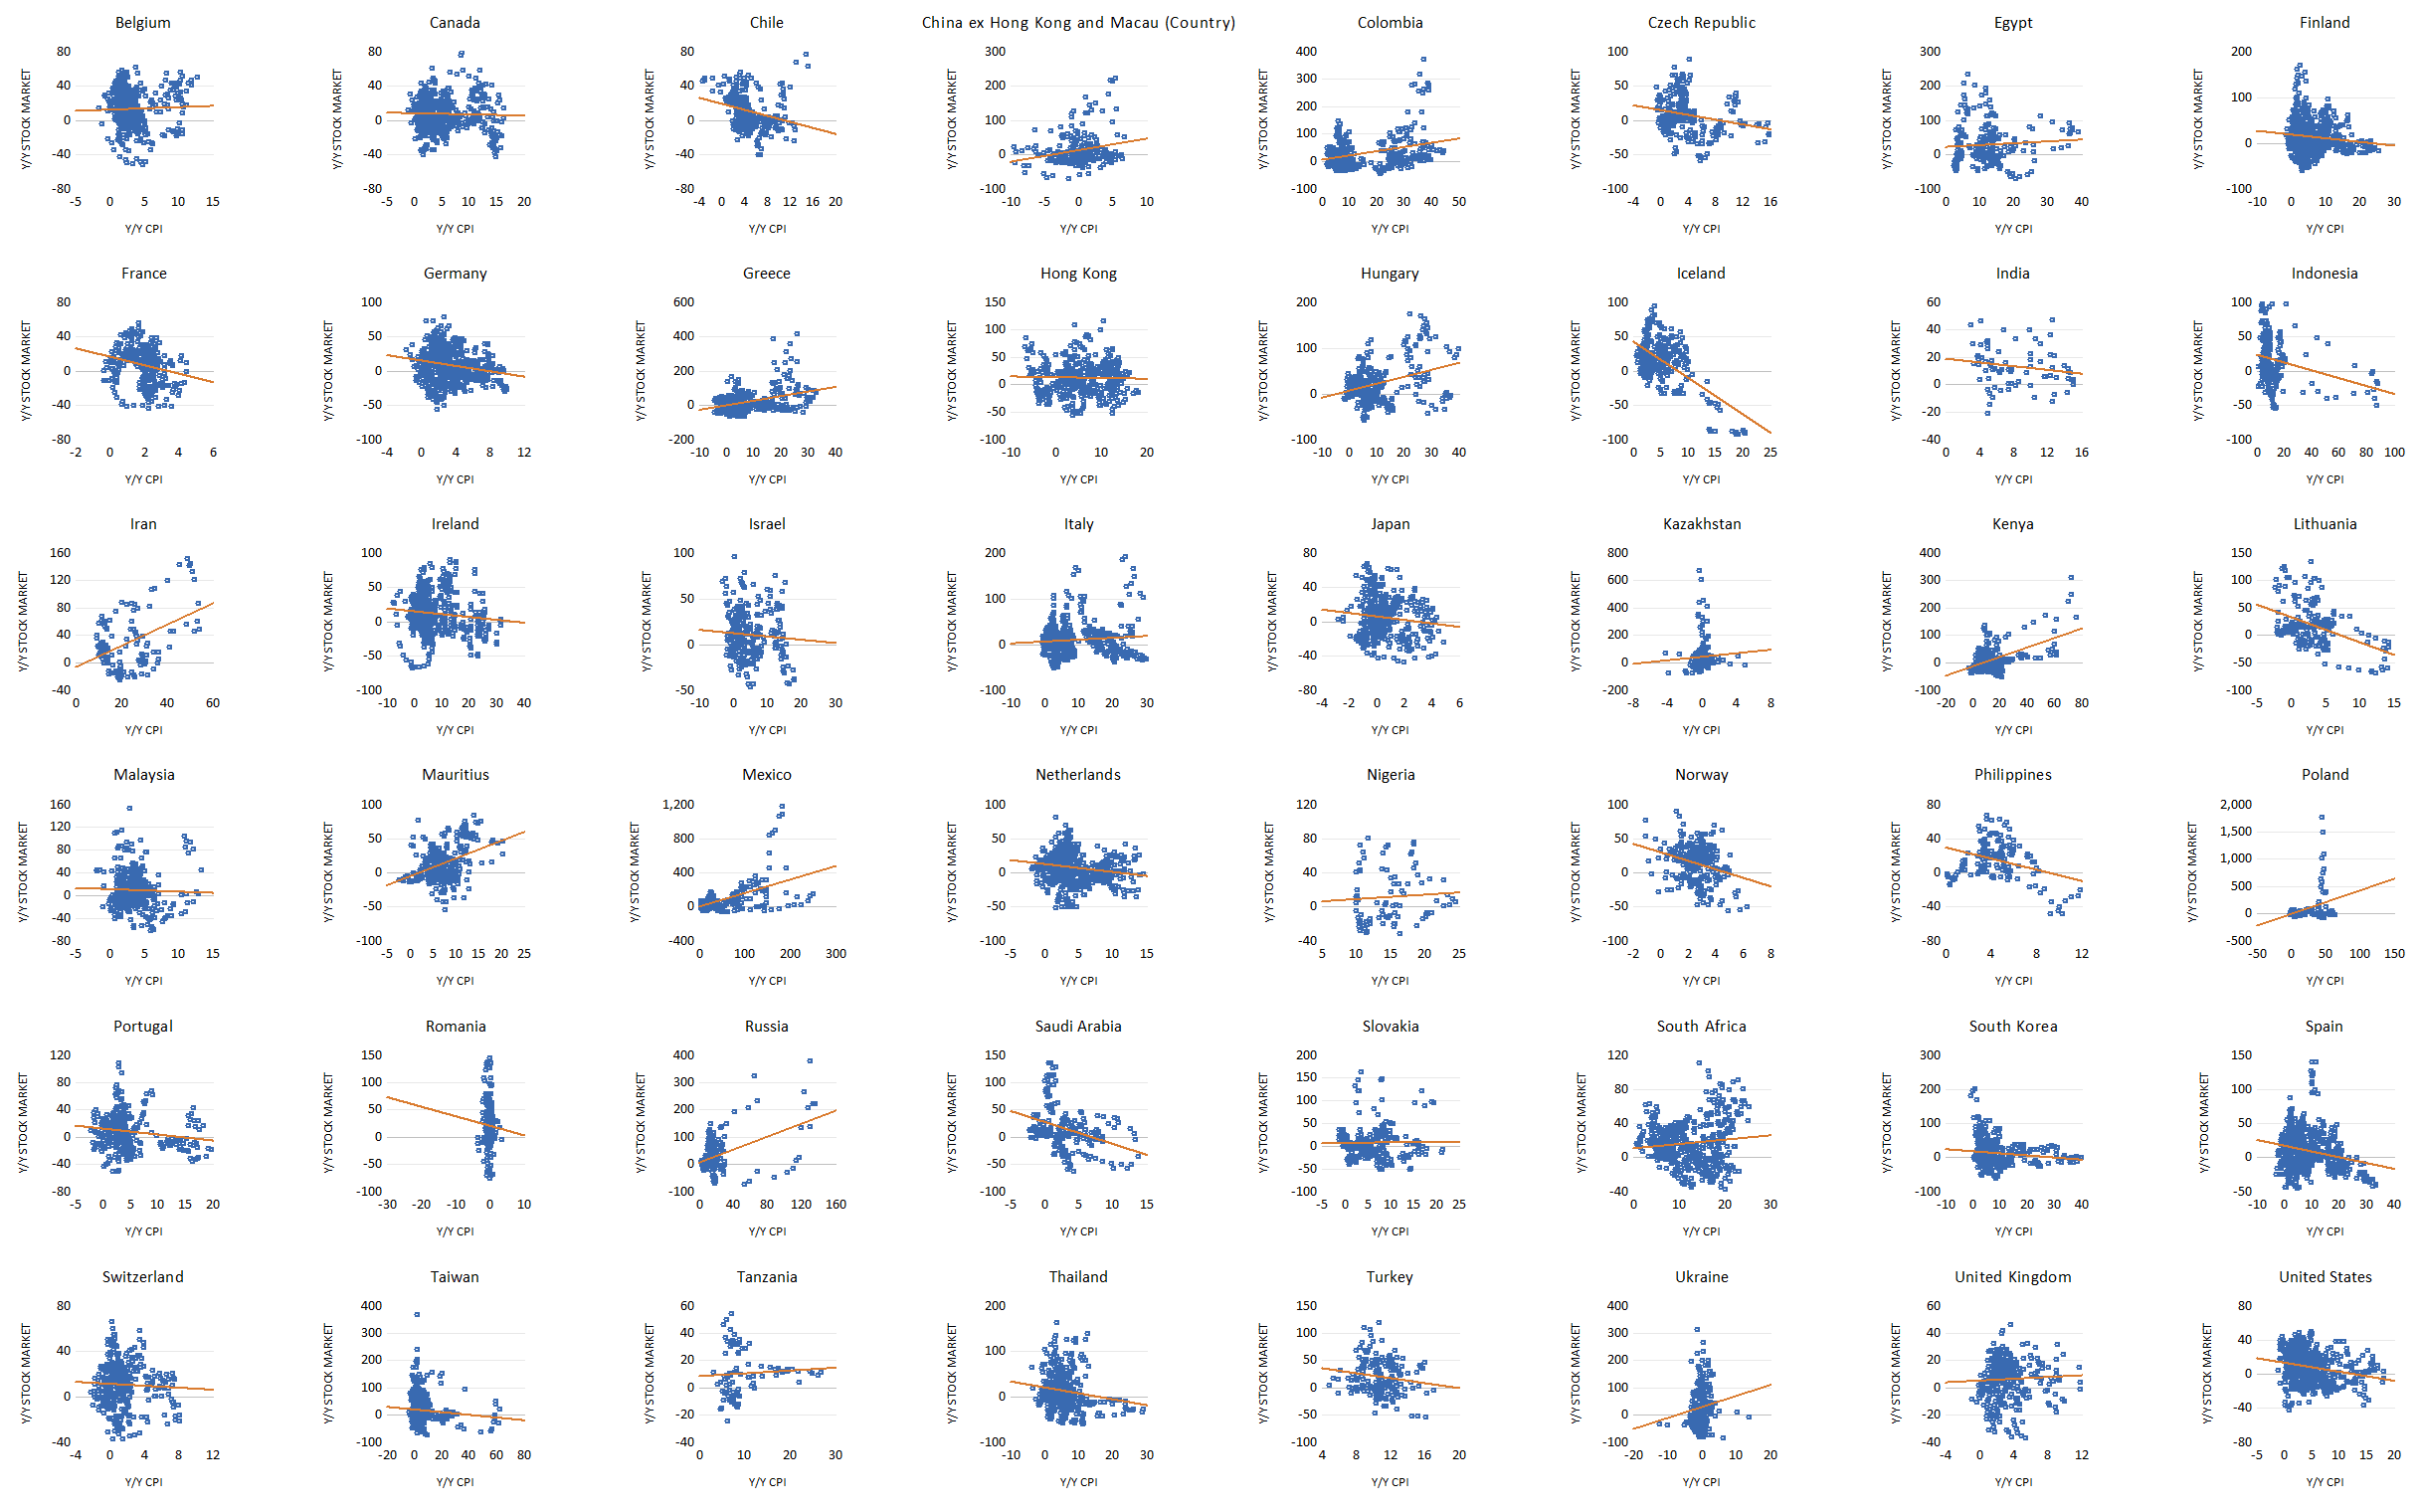
The relationship between the two is more graceful. The following is a scatterplot of the connection for selected countries. Unsurprisingly, there’s little consistency.
If you’d like the data behind these figures, and all our upcoming data points discussions, subscribe to our newsletter. It comes with a complete sharing of all the data behind each article.
Conclusion
The relationship between stock market performance and inflation is delicate. Analyzing the connection requires a refined approach to analytics. With this acknowledged, the raw correlating relationship suggests that if an “inflation boom” can be put-off, a stock market boom is on the horizon. And, to note again, if you’d like the data behind these figures, and all our upcoming data points discussions, subscribe to our premium service. It comes with a complete sharing of all the data behind each article.


