One of the biggest challenges when trying to determine whether or not to invest in a company is determining the financial strength of each company. Enter the Piotroski Score; this simple rating scale helps you determine a company’s financial strength.
Value investors love this rating scale as it gives you a good initial insight into all aspects of the financial statements. It utilizes the income statement, balance sheet, and the cash flow statement.

Q3 hedge fund letters, conference, scoops etc
As you will see, the Piotroski score is a pretty simple device to seek out great, undervalued companies.
This score helps you find companies that are profitable have improving margins, don’t employ any accounting tricks, and have strengthing balance sheets.
Let’s dive in and take a look at what the PIotroski Score is and how do we put it to use.
What is the Piotroski Score?
The Piotroski Score is a range of values between 0 to 9, with 9 being the highest score possible. Based on nine criteria used to determine the strength’s of a companies financial position, this score uses this range to help decipher the best value stocks.
The Piotroski score, named after Chicago Accounting Professor Joseph Piotroski, who devised the scale. All of this according to the specific aspects of the companies financial statements.
The focus is on the company’s accounting results, specifically over the last few years. For every criterion met, the company is then awarded one point. And likewise, every criterion not met is awarded a zero.
The points are then added up to determine which company is the best value stock.
Sounds pretty easy, huh?
Piotroski Criteria
Let’s break down the criteria into their different categories.
Profitability
- 1. Positive return on assets in the current year (1 point)
- 2. Positive operating cash flow in the current year (1 point)
- 3. Higher return on assets (ROA) in the current period compared to the ROA in the previous year (1 point)
- 4. Cash flow from operations is greater than ROA (1 point)
Leverage, Liquidity, and Source of Funds
- 5. Lower ratio of long-term debt to in the current period compared value in the previous year (1 point)
- 6. Higher current ratio this year compared to the previous year (1 point)
- 7. No new shares were issued in the last year (1 point)
Operating Efficiency
- 8. A higher gross margin compared to the previous year (1 point)
- 9. A higher asset turnover ratio compared to the previous year (1 point)
How the scoring works.
If a company has a score of 8 or 9, that is considered a good value. If on the other hand, the company comes in with a score of 0-2, it is considered a poor value stock.
Breakdown of Terms
Let’s take a look at some of the terms and break them down a little bit.
- Return on Assets – this percentage shows us how profitable our company’s assets are in generating revenue. Read more about this formula here.
- Operating Cash Flow – this refers to the cash brought in from normal operations. It is the cash before any investment or financing activities. You can find this number on the cash flow statement.
- Long-term debt – It is debt that is due more than 12 months in the future — the debt owed to either banks or bondholders, where some companies will issue bonds to investors and pay interest on the bonds. You can find this number on the balance sheet under the current liabilities section.
- Current Ratio – this ratio is mainly used to give you an idea of the company’s ability to pay back its short-term liabilities with short-term assets. We use the balance sheet to locate these numbers. The current ratio is a great indicator of a company’s liquidity.
- Gross Margin – this ratio is the difference between revenue and cost of goods sold divided by the revenue. Expressed as a percentage, gross margin we want to see as a higher number. The more a company retains on each dollar of sales, to help service its other costs and other debt obligations.
- Asset Turnover Ratio – this ratio is an efficiency ratio that measures a company’s ability to generate sales from its assets by comparing net sales with average total assets. In a word, this ratio shows you how well a company can use its assets to create sales. These numbers are found on both the income statement and balance sheet.
Piotroski Score in Action
Ok, we have spent some time looking at what the Piotroski Score is, what some of the terms are and why it exists.
Now let’s start to put it into practice.
The first company I would like to use to set this up is going to be Johnson & Johnson, a nice stable, mature company that is a dividend aristocrat. Their ticker symbol is JNJ and their current price, as of December 19, 2018, is $127.61.
Another note, all numbers will be listed as millions unless otherwise stated.
To start to put this all together, we are going to pull some numbers from the 10-k from 2017. I like to use the 10-ks where ever possible as these numbers are audited and in theory the most accurate. You can use either TTM or the 10-q if you are comfortable with those.
First I will show examples of where each number comes from so you can find these for yourself.
- Net Income
- Cash Flow from Operations
- Revenue
- Gross Profit
- Average Total Assets
- Total Assets
- Long-Term Debt & Capital Lease Obligation
- Total Current Assets
- Total Current Liabilities
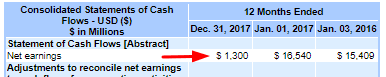
Net Income will come from the cash flow statement.
Net income = $1,300
Cash Flow from Operations will also come from the cash flow statement.
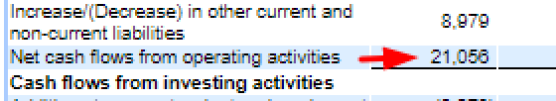
Cash Flow from Operating Activities = $21,056
Up next is revenue
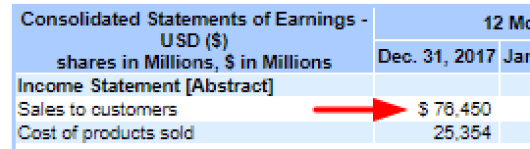
Johnson & Johnson revenue = $76,450
Gross profit will be next, located in the consolidated statements of earnings. Calculated as Revenue – Cost of products (goods) sold. Located on the earnings statement, but it is always good to know how to calculate the number.
Gross profit is the sales minus the cost of goods to produce, which will leave you with your gross profit.
The lower the cost of goods sold, the higher the gross profit. The lower number can be great, provided the products sold do not erode in quality.

Gross Profit = $51,096
Average Total Assets is going to be calculated by taking the last five years of total assets from the last five years of 10-ks and then dividing this number by five.
The total assets are located on the balance sheet. I will show you where to find the first one, and then I will pull the numbers together for us from the previous year’s balance sheets.
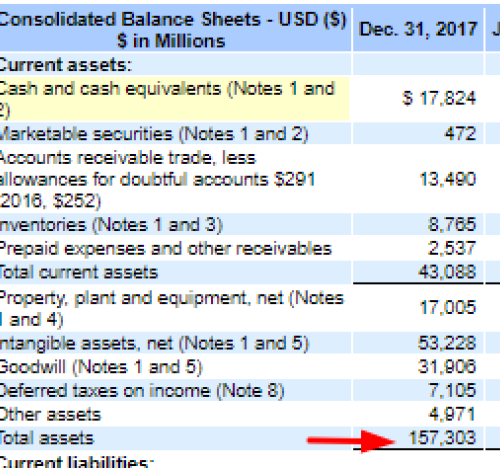
Total assets for year-end 2017 = $157,303
- 2016 = 141,208
- 2015 = 133,411
- 2014 = 130,358
- 2013 = 132,683
Taking all five of these years and adding them up and then dividing by five we get:
157303 + 141208 + 133411 + 130358 + 132683 / 5
Average Total Assets over the past five years = $138,993
Total assets at the beginning of the year. We will find this number again on the balance sheet.
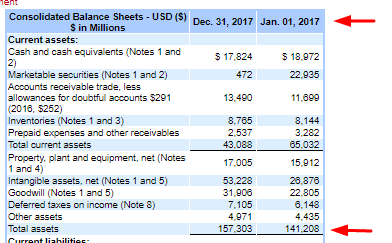
Total assets at the beginning of the year = $141,208
Next up, Long-term debt & Capital Lease Obligations. You can find long-term debt on the balance sheet under the current liabilities section.
In the case of Johnson & Johnson, all long-term debt & capital lease obligations are listed under long-term debt.
You can classify long-term debt as any debt that is due longer than twelve months.
If you are curious about the length of any of these notes and their amounts, you can find more information under the notes to financial documents.
In this case, it is Note 4. Check it out; it is pretty interesting.
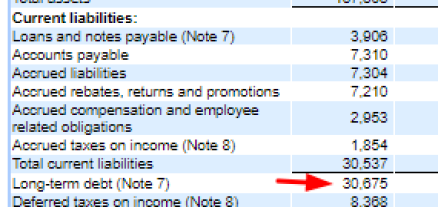
Long-term debt = $30,675
Next, we will find the total current assets. Total current assets again are found in the balance sheet.
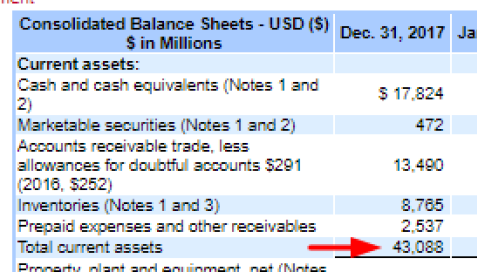
Total current assets = $43,088
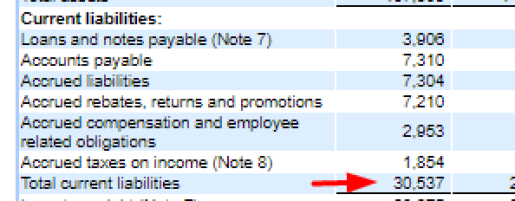
And lastly, we need to find total current liabilities which we can find on the balance sheet.
Now that we have assembled all the numbers that we need to start answering our questions to find out if our company is in good shape financially using the Piotroski score.
Profitability
Question 1: Return on Assets
Johnson & Johnson Net Income for 2017 was positive at $1,300
Score = 1
Question 2: Cash Flow from Return on Assets
Johnson & Johnson’s current Cash Flow from Operations was positive at $21,056
Score = 1
Question 3: Change in Return on Assets
Compare this year return on assets to last year’s return on assets.
ROA ( This year ) = Net income / Total Assets ( Dec 2017)
ROA = 1300 / ( 141,208 + 157303 ) / 2
ROA = 0.87%
ROA (2016) = 16540 / ( 133411 + 141208 ) / 2
ROA (2016) = 12.05%
Return on assets for 2016 was higher than 2017, 12.05% to 0.87%.
Score = 0
Question 4: Quality of Earnings
Compare cash flow from return on assets to return on assets.
Johnson & Johnson current net income was $1300. Johnson & Johnson’s current cash flow from operations was $21,056. So $21,056 is greater than $1300.
CFROA > ROA = Score 1
Funding
Question 5: Change in leverage
Compare this year’s leverage ( long-term debt divided by average total assets ) to last year’s leverage.
Leverage ( 2017 ) = long-term debt / total assets
Leverage = $30,675 / $157,303
Leverage = 19.50%
Leverage (2016 ) = $22,422 / $141,208
Leverage = 15.87%
Johnson & Johnson’s leverage for 2017 was 19.50%, and their leverage for 2016 was 15.87%.
Therefore 2016 is lower than in 2017. Thus the leverage was higher this year.
Score = 0
Question 6: Change in Working Capital ( Liquidity )
Compare this year’s current ratio ( current assets divided by current liabilities ) to last year’s current ratio.
Score 1 if this year’s current ratio is higher, 0 if it is lower.
Current Ratio (2018) = Total Current Assets / Total Current Liabilities
Current Ratio = $43,088 / $30,537
Current Ratio = 1.41
Current Ratio (2016) = $65,032 / $26,287
Current Ratio = 2.47
Johnson & Johnson’s current ratio of this year is 1.41, their current ratio for 2016 was 2.47. This year’s current ratio is lower.
Score = 0
Question 7: Change in Shares in Issue
Compare the number of shares in issue, to the number in issue last year. Score 0 if there is a larger number of shares in issue this year, one otherwise.
Johnson & Johnson’s number of shares in issue this year 2017 was 2682.53. Their number of shares in issue in 2016 was 2706.51. There were more shares issued in 2016.
Score = 1
Efficiency
Question 8: Change in Gross Margin
Compare this year’s gross margin ( Gross Profit divided by sales ) to last year’s. Score one if this year’s gross margin is higher, zero if the gross margin is lower.
Gross Margin (2017) = Gross Profit / Revenue
Gross Margin = $51,096 / $76,450
Gross Margin = 66.83%
Gross Margin (2016) = $50,205 / $71,890
Gross Margin = 69.84%
The gross margin for 2017 was 66.83, and the gross margin for 2016 was 69.84. Thus, the gross margin for 2016 was higher.
Score = 0
Question 9: Change in asset turnover
Compare this year’s asset turnover ( total sales for the year divided by total assets at the beginning of the year ) to last year’s asset turnover ratio.
Score one if this year’s asset turnover ratio is higher, zero if the turnover ratio is lower.
Asset Turnover (2017) = Revenue / Total Assets at the beginning of the year.
Asset Turnover = $76,450 / $141,208
Asset Turnover = 54.13%
Asset Turnover (2016) = 71,890 / 133,411
Asset Turnover = 54.88%
Johnson & Johnson’s asset turnover ratio for 2017 was 54.13%. Their asset turnover ratio for 2016 was 54.88%. The asset turnover ratio for 2017 was lower than the ratio for 2016.
Score = 0
Evaluation of the Piotroski Score
- Q1 = 1
- Q2 = 1
- Q3 = 0
- Q4 = 1
- Q5 = 0
- Q6 = 0
- Q7 = 1
- Q8 = 0
- Q9 = 0
Total score = 4
Good or high score would be 7, 8, or 9. A bad or low score would be 1, 2, or 3.
Johnson & Johnson has a score of 4, which is very typical of a stable, mature company. During the last 13 years, Johnson & Johnson’s score has seen a high of 8, a low of 4 and a median of 6.
Overall the Piotroski score helps illustrate what we probably already know about this company that they are a stable, mature company that might have periods of growth and increasing free cash, with periods of stability and little to no growth.
Let’s try another one, huh?
After doing a quick stock screen on my favorite screener, finviz, I found a company that was interesting.
Oshkosh Corporation. If you are not familiar with them, here is a little info about them.
Oshkosh Corporation, formerly known as Oshkosh Truck, is an American industrial company that designs and builds specialty trucks, military vehicles, truck bodies, airport fire apparatus, and access equipment. The corporation also owns Pierce Manufacturing, a fire apparatus manufacturer in Appleton, Wisconsin.
They have a market cap of $4.22 billion, a P/E ratio of 9.74 and pay a dividend of $0.99 annually.
Ok, now that we know a little bit about the company let’s take a look at their Piotroski score.
This time I will gather the information and walk you through the questions. The numbers will be gathered from the 2018 10-k.
- Net Income = $472
- Cash Flow from Operations = $436
- Revenue = $7706
- Gross Profit = $1356
- Average Total Assets = $4806.26
- Total Assets at the beginning of 2018 = $5099
- Long-term Debt = $818
- Total Current Assets = $3270
- Total Current Liabilities = $1690
Question 1: Return on Assets
Oshkosh Corp’s current Net Income is $472, which is positive.
Score = 1 point
Question 2: Cash Flow on Return on Assets (CFROA)
Oshkosh Corp’s current cash flow from operations was $436, which is positive.
Score = 1 point
Question 3: Change in Return on Assets
Return on Assets 2018 = Net Income / Total Assets
ROA 2018 = 472 / 5294
ROA 2018 = 8.91%
Return on Assets 2017 = 286 / 5099
ROA 2017 = 5.61%
Oshkosh Corps ROA for 2018 was higher at 8.91%, than 2017 at 5.61%.
Score = 1 point
Question 4: Quality of Earnings
Compare cash flow return on assets to return on assets.
Oshkosh Corps Net Income for 2018 was 472, compared to its current Cash Flow from Operations which was 436.
Because the Cash Flow from Operations was below the Net Income, 436 < 472.
Score = 0 point
Question 5: Change in Leverage
Compare this year’s leverage ( long-term debt divided by total average assets ) to last year’s leverage.
Leverage 2018 = 818 / 5164.72
Leverage 2018 = 15.83%
Leverage 2017 = 807.9 / 4837.02
Leverage 2017 = 16.70%
Oshkosh Corp’s 2018 leverage at 15.83% was lower than the leverage of 2017 at 16.70%.
Score = 1 point
Question 6: Change in Working Capital
Compare this year’s current ratio (current assets divided by current liabilities) to last year’s current ratio.
Current Ratio 2018 = Current assets / Current Liabilities
Current Ratio 2018 = 3269.9 / 1690.1
Current Ratio 2018 = 1.93
Current Ratio 2017 = 3039.8 / 1683.1
Current Ratio 2017 = 1.81
Oshkosh Corps current ratio for 2018 was higher at 1.93, compared to the 2017 number of 1.81.
Score = 1 point
Question 7: Change in Shares in Issue
Compare the number of shares in issue to this year to the number in issue last year.
Oshkosh Corps number of shares in issue is 73.7, compared to last year’s share in issue of 76.1. There is a smaller number of shares in issue this year.
Score = 1 point
Question 8: Change in Gross Margin
Compare this year’s gross margin (gross profit divided by sales) to last year’s gross margin.
Gross Margin 2018 = Gross Profit / Revenue
Gross Margin 2018 = 1356 / 7706
Gross Margin 2018 = 17.60%
Gross Margin 2017 = 1174 /6830
Gross Margin 2017 = 17.18%
Oshkosh Corps gross margin in 2018 was 17.60%, which is higher than 2017 of 17.18%. Thus, this year’s gross margin is higher.
Score = 1 point
Question 9: Change in asset turnover
Compare this year’s asset turnover (total sales for the year divided by total assets at the beginning of the year) to last year’s asset turnover ratio.
Asset Turnover 2018 = Revenue / Total Assets at the beginning of the year 2018
Asset Turnover 2018 = 7706 / 5099
Asset Turnover 2018 = 1.511
Asset Turnover 2017 = 6830 / 4514
Asset Turnover 2017 = 1.513
Oshkosh Corps turnover ratio for 2018 was 1.5111, which was lower than 2017 of 1.513 because last year’s turnover ratio was higher.
Score = 0 point
Piotrosk Score for Oshkosh Corp 2018
- Question 1 = 1 point
- Question 2 = 1 point
- Question 3 = 1 point
- Question 4 = 0 point
- Question 5 = 1 point
- Question 6 = 1 point
- Question 7 = 1 point
- Question 8 = 1 point
- Question 9 = 0 point
Piotroski Score for Oshkosh Corp 2018 = 7
Remember that a good score would be 7,8, or 9.
This is a good or high score and indicates that Oshkosh Corp is in a good situation financially.
Final Thoughts
After all the analysis of the Piotroski score, hopefully we have established that this is a great tool to help us determine the financial health of any company we are interested in.
I love that it examines all aspects of the financial statements and utilizes different metrics to help us find the “truth”.
The nine questions that we use are pretty straightforward and there is no higher math involved in any of the questions.
This is a process that is highly underutilized and can be very useful for you in your quest to uncover great companies.
The two examples that we used showed how some more mature companies are doing and this process would work just as well with new, upcoming growth companies as well.
Some additional resources for you. If you are the type that likes to use automation there are a few Piotroski score screeners out there. The one that I like the best is here.
Also a few other great articles that outline this process as well are from Old School Value and Seeking Alpha article
These are great articles that help outline the Piotroski score in additional detail and were very helpful to me as I was writing this article.
As always, please use these formulas and processes as a part of investment research and do not buy any company based solely on one result.
Thanks as always for reading and I hope you found something useful in this article and it can help you on your quest.
If you have any questions or comments, please reach out. I am here to help.
Take care,
Dave
Article By David Ahern, Intrinsic Value Formula


