The key yield curve has inverted, shouting loudly that a recession is coming – and with it, better times for gold.
I activated the high-degree recession alert! I’ve been writing about the downturn for some time, but in October, another important indicator flashed a red light. As you can see on the chart below, the key yield curve has inverted.

Q3 2022 hedge fund letters, conferences and more

Earlier this year, the spread between 10-year and 2-year US Treasury bonds (the red line) turned negative. In April, it timidly fell below zero for a while, but in July it did it again and with greater boldness, remaining since then in negative territory. Commenting on this event, I wrote:
This is a very important development, as it strengthens the recessionary signal sent by the April curve. The previous reversal was very brief and shallow – and thus not very reliable. But the second inversion within just four months implies that dark clouds are indeed gathering over the US economy.
I also added one important caveat about drawing too far-reaching conclusions about the recessionary prospects:
The more important spread between 10-year and 3-month US Treasuries hasn’t yet turned negative. However, it has flattened significantly since May, plunging to a level close to zero, and – after the next hikes in the federal funds rate – it could invert as well.
Well, this is what happened last month. As the chart above shows, the spread between 10-year and 3-month US Treasuries (blue line) fell below zero on October 18 (to -0.03%) and later on October 25 (to -0.4%), joining the club of negative spreads.
The inversion of this yield curve is a huge development, as it strengthens the recessionary signals sent by the 10-year and 2-year curves in April and June. Please remember that the 10-year and 3-month spread is believed to offer the highest accuracy and predictive power among all possible bond yields.
As the chart below shows, this spread has turned negative before each recession in the 1982-2020 period (the research conducted by the New York Fed confirms this feature also for the earlier years, until 1968).
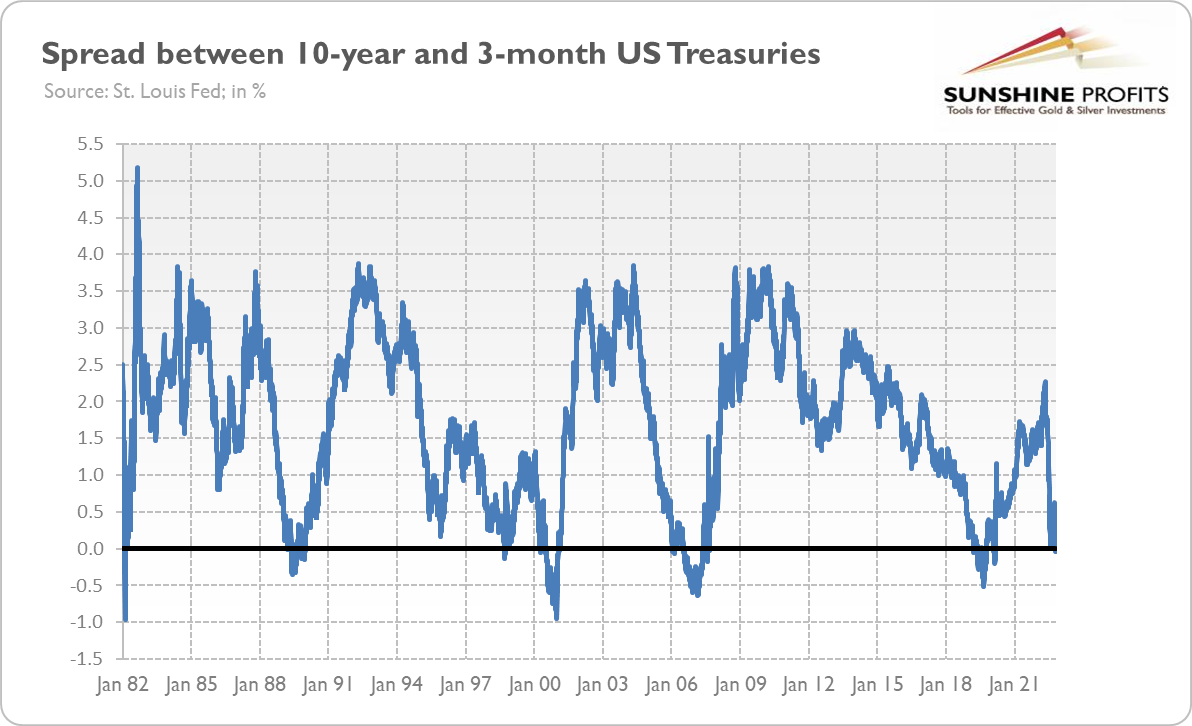
It means that each US economic downturn in the last five decades has been preceded by the inversion of this yield curve, and each fall below zero has been followed by the recession.
In other words, as the inversion in this particular yield curve correctly predicted each of the last eight recessions without giving any false alarms, it makes it the most reliable recessionary indicator in modern economic history. It’s true that investors don’t have a crystal ball, but the yield curve is the next best thing they can use.
What’s also important is that the reason behind the recent inversion is not the decline in long-term yields but the increase in the 3-month Treasury yield, as the chart below shows. To be precise, both yields have risen recently, but the short-term yields simply climbed higher. Why?
Well, the Fed’s tightening cycle and input price inflation made entrepreneurs and investors scramble for the funds needed to finish their investment projects. As they compete for liquidity and the Fed hikes the federal funds rate, short-term interest rates go up.

Implications For Gold
What does it all mean for the gold market? Well, the increase in the bond yields won’t help the gold prices – it can actually send them lower. However, the recessionary signal sent by the yield curve is clearly bullish for gold.
If the predictive power of the yield curve remains in force, a recession is very likely to arrive by the end of 2023, as it historically used to follow the inversion of the yield curve after four quarters (or sometimes more).
Hence, gold should also shine at some point in the near future. As the chart below shows, inversions of the yield curve have not only preceded recessions but also rallies in gold prices.
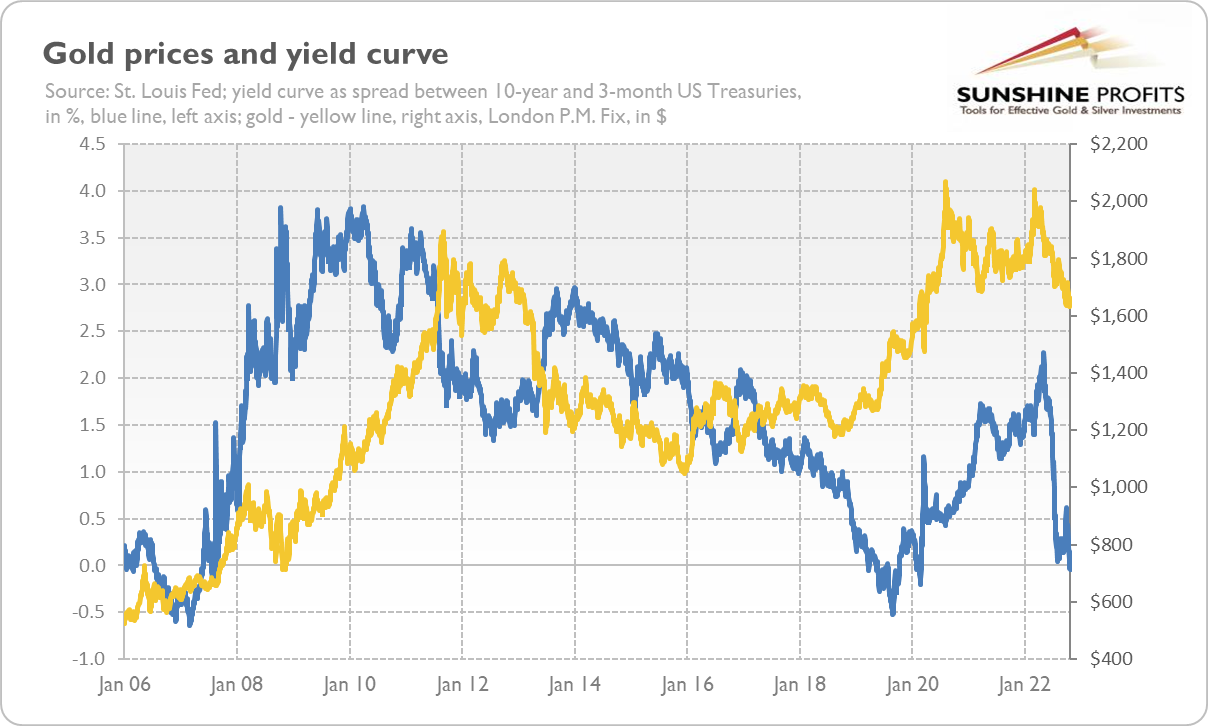
To be clear, what is positive for gold is not the inversion of the yield curve. Gold goes up together with the steepening of the yield curve, which happens when short-term rates decline. It occurs when the Fed smells a recession and starts to cut interest rates.
In other words, gold needs the Fed’s pivot to reverse its downward trend. It’s a matter of time – some analysts believe that the January hike will be the last in this cycle – a recession is already on the way.
The adoption of a more neutral stance by the Fed, which is quickly approaching, should allow gold to catch its breath and prepare for the future rally.
Thank you for reading today’s free analysis. We hope you enjoyed it. If so, we would like to invite you to sign up for our free gold newsletter. Once you sign up, you’ll also get 7-day no-obligation trial of all our premium gold services, including our Gold & Silver Trading Alerts. Sign up today!
Arkadiusz Sieron, PhD
Sunshine Profits: Effective Investment through Diligence & Care.


