
As the white metal hangs on for dear life, the fundamentals continue to grow more ominous.
Unveiling the Reality
Although fears of a banking crisis helped propel silver north of $26, we warned the good times would not last. We wrote on Apr. 6:
While silver has been a major beneficiary of the ‘bank crisis means rate cuts’ narrative, this is 2021/2022 all over again. When the crowd attempts to front-run a recession, it negates the recession due to the stimulative effect of lower long-term interest rates. That’s why sentiment surrounding silver has gone from euphoric to catastrophic several times over the last two years, and we believe another shift should occur over the next several months.
To that point, not only have rate-hike expectations increased dramatically, but the Fed’s balance sheet is ~$1 billion away from hitting a new cycle low.
Please see below:
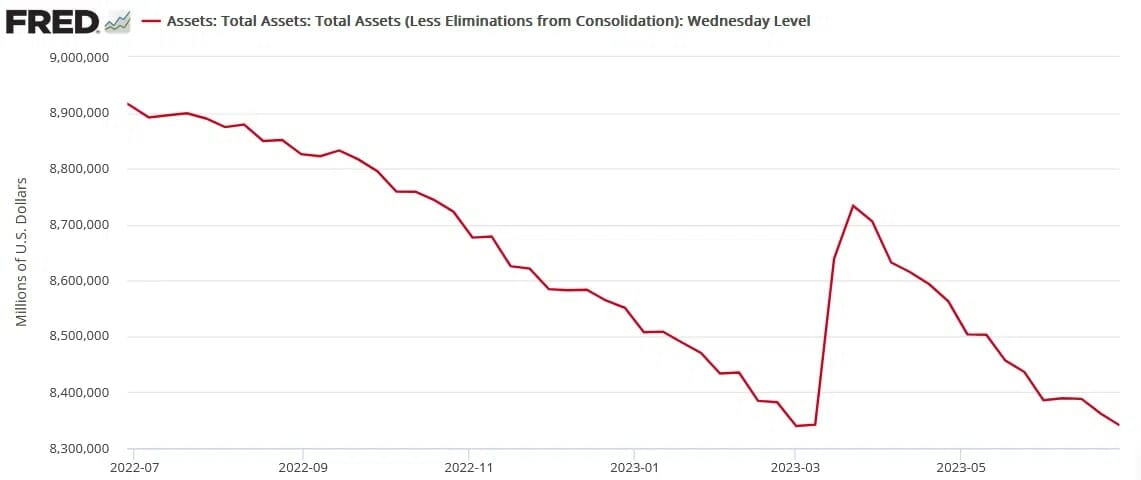
To explain, the metric has declined significantly from its bank-run peak, and the Jun. 29 update shows how investors’ QE dreams have become a nightmare. As such, while we warned that disappointment would confront gold, silver, and mining stocks, our medium-term thesis continues to unfold as expected.
Labor Lessons
Despite prophecies of a crashing U.S. labor market, employment growth has defied expectations for over 12 months. And with The Conference Board’s Consumer Confidence Index increasing from 102.5 to 109.7 on Jun. 27, the data does not support a dovish pivot anytime soon. The report stated:
“23.7% of consumers said business conditions were ‘good,’ up from 19.7% last month. 16.3% said business conditions were ‘bad,’ down from 16.7%.”
In addition:
“46.8% of consumers said jobs were ‘plentiful,’ up from 43.3%. 12.4% of consumers said jobs were ‘hard to get,’ slightly lower than 12.6% last month.”
Consequently, The Conference Board’s labor differential remains highly elevated, and continued resilience is bullish for the U.S. dollar and real interest rates.
Please see below:
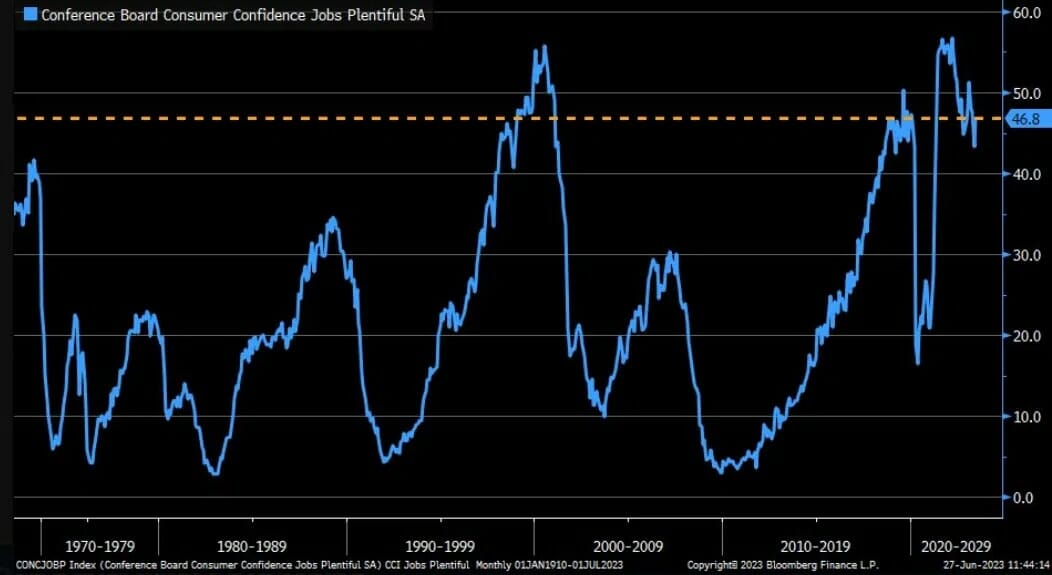
To explain, the blue line above tracks The Conference Board’s jobs are “plentiful” metric. If you analyze the right side of the chart, you can see that the latest reading is still well above its historical norm. As a result, abundant employment opportunities are bullish for wage and output inflation, and interest rates need to rise to rebalance supply and demand.
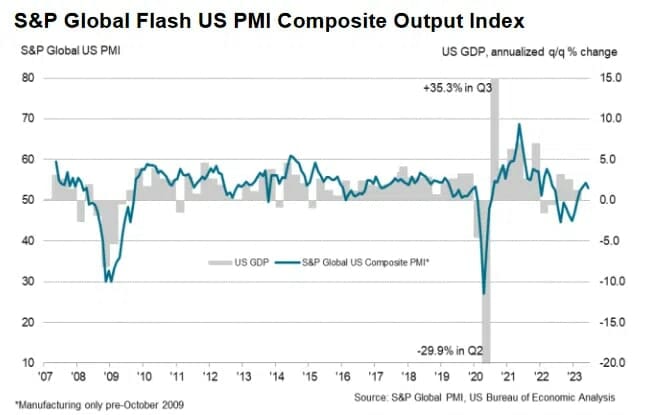
As further evidence, S&P Global released its U.S. Composite PMI on Jun. 23. The headline index declined from 54.3 in May to 53 in June but remains in expansion.
Please see below:
Regarding services, the report stated:
“Services firms continued to hire amid greater new orders. That said, the rate of job creation eased to the weakest since January amid challenges replacing voluntary leavers. In response to problems hiring sufficient new staff, the level of outstanding business at service providers increased in June.
Regarding manufacturing:
“Greater success in finding suitable candidates allowed firms to expand their workforce numbers in June, despite concerns surrounding future demand conditions. The rate of job creation slowed slightly but remained among the fastest in a year.”
So, with “voluntary leavers” the primary problem for service providers and manufacturing firms increasing their headcount “among the fastest in a year,” the U.S. labor market is nowhere near the crisis levels that would support rate cuts and QE.
Furthermore, the report added:
“Following a loss of momentum in May, price pressures gained intensity in June. The rate of cost inflation across goods and services picked up to a robust pace. The reigniting of cost inflationary pressures was driven by the service sector amid increased wage bills.”
Thus, while output inflation did not follow suit, the latter often lags input inflation. In other words, if U.S. businesses continue to confront higher cost inflation, they will inevitably raise their selling prices, as they did in 2021 and 2022. As a result, the Fed needs tighter financial conditions to curb this behavior, which means lower stock prices, higher interest rates, and a stronger U.S. dollar.
Speaking of which, while the S&P 500 ignores the significant liquidity drain, sentiment should shift in the months ahead.
Please see below:
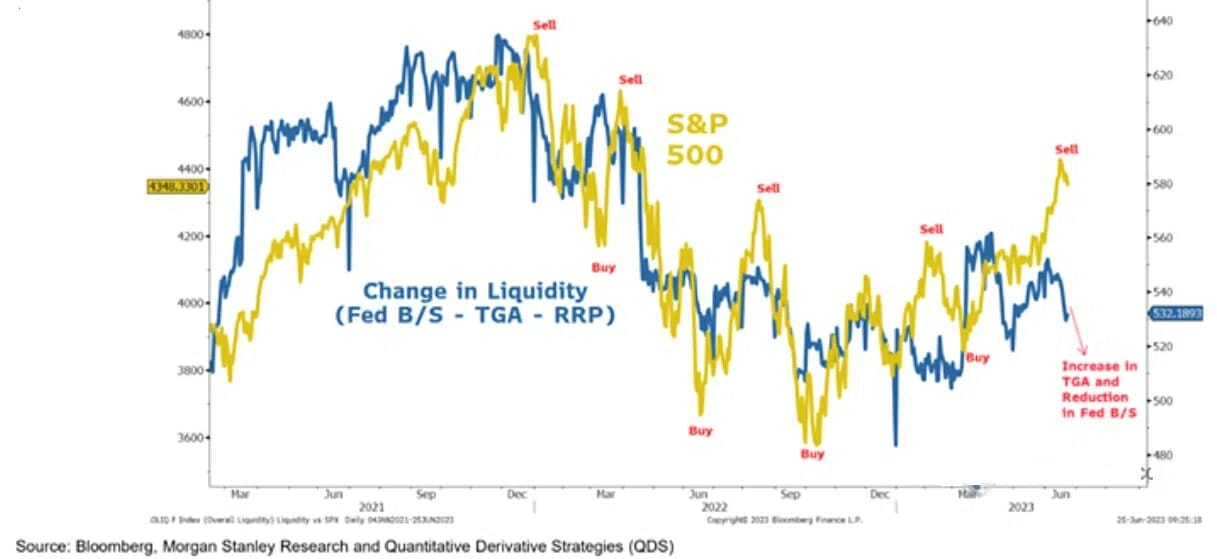
To explain, the gold line above tracks the S&P 500, while the blue line above tracks the combined liquidity generated from the Fed’s balance sheet, the Treasury General Account, and the reverse repo facility. If you analyze the connection, you can see that the S&P 500 is highly sensitive to liquidity injections and withdrawals.
More importantly, the blue line’s descent on the right side of the chart shows how the current liquidity drain has been ignored by the S&P 500. Yet, with the tightening of financial conditions poised to persist, the blue line should continue its decline, and it’s likely only a matter of time before the S&P 500 follows suit.
Overall, commodities prices have been hammered, and assets like copper and oil have suffered mightily. Consequently, a stock market wake-up call could be the next catalyst to upend the PMs and help increase the gains from our GDXJ ETF short position. All in all, their medium-term outlooks remain profoundly bearish.
Do you think the liquidity drain will continue and eventually hurt the S&P 500?
Alex Demolitor
Precious Metals Strategist


