
What a difference a day can make! Everything was just SO bearish, and now… Well, some things changed.
They changed quite profitably, as we just took profits off the table with GDXJ at $33.26. And right now, it seems that long positions might actually be justified from the risk-to-reward point of view.
How come? Because no market moves up or down in a straight line, regardless of the bigger trend. And when things get too excessive on one end of the spectrum (bullish or bearish), the odds are that we’ll see a countertrend move. That’s just how markets work. Because that’s just how emotions work.
Once the fear or greed gets extreme, they burn themselves out – everyone who was ready to make a transaction based on that emotion at a given point in time, has already done so, and now the price is likely to reverse. That’s how markets always worked (as long as they are free to a considerable extent), as that’s how emotions always worked. And since humans will continue to be driven by emotions, this behavior won’t change anytime soon.
The difficult part is to detect the moments where the emotions get excessive. Fortunately, we have technical analysis, with all its sub-parts, techniques, and indicators, and it’s helpful in detecting the extremes. One needs to know where to look, though.
Junior Miners Fall, Silver Rises
For instance, during yesterday’s trading, something very odd happened in the case of the junior mining stocks and in the case of silver, and it was particularly visible in the first part of the session.
While silver jumped up considerably, junior miners were down. Yes, those things happen every now and then, but they usually happen at the end of a rally. And right now, both markets are after a few-week-long decline. So, what really happened? Was it normal? Or was something excessive, and it actually meant something that we could use in our trading decisions?
One of the great ways to check a given market’s (works with ETFs or stocks, too) relative performance is to look at its ratio and how it performs. Then, we can analyze if the ratio itself is doing something regular or something meaningful. And we can estimate how effective it was to follow any indications that this ratio gave us.
Let’s do exactly what with the junior miners to silver ratio. To get an apples-to-apples comparison (with the same closing hours), I’m going to use the GDXJ and SLV ETFs.
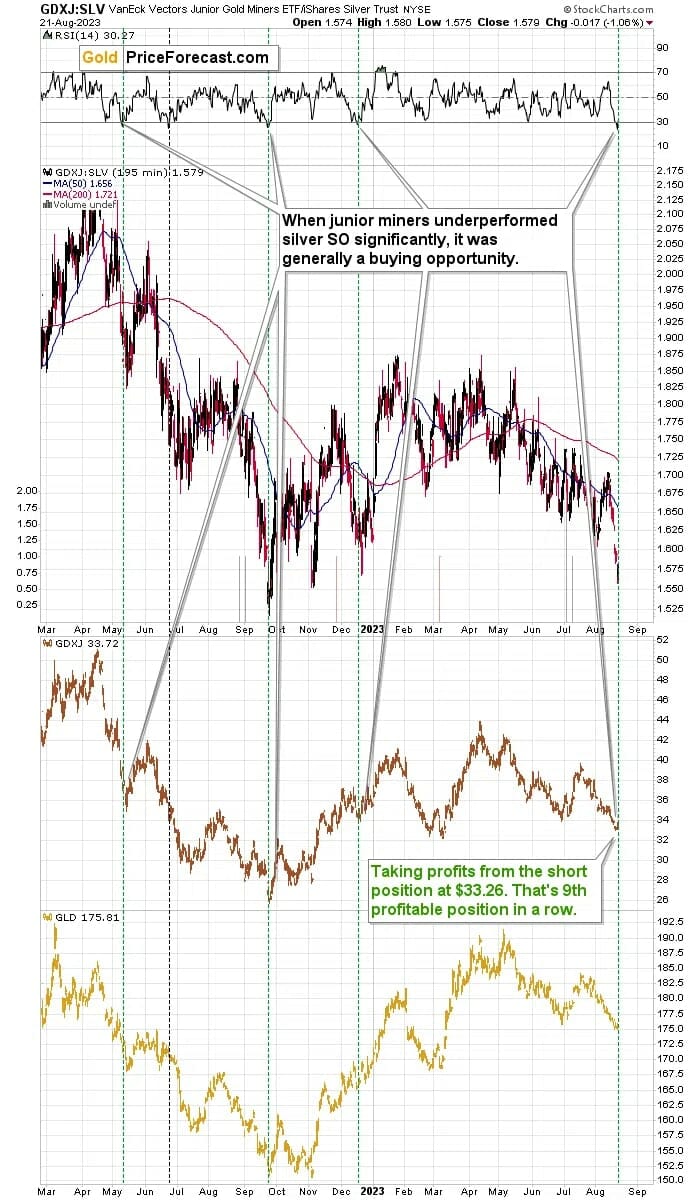
Yes, the drop in the ratio was excessive – that’s clear at first sight. But was it too excessive?
Yes! That’s what the RSI indicator is showing us. Indicators are a very useful way to detect if what we see now is normal or if it’s something that’s likely too much (or too little). In essence, they are mathematical transformations of price movements (sometimes volume is taken into account) so that they isolate what’s most important.
What’s important in our case is that the RSI moved below 30 in a clear manner. That happened only a couple of times in the recent past and in almost all cases (3 out of 4), sizable rallies in the GDXJ followed.
That’s what happened at the May 2022 bottom, at the September 2022 bottom (which was also the yearly bottom), and at the December 2022 bottom. And it’s likely to happen also this time.
There was one time – in the second half of June 2022 – when the move below 30 in the RSI triggered only a tiny and brief upswing, but that was when gold was about to slide, and the USD Index was about to soar.
The vertical green line shows that it was right before the USD Index shot up higher after a brief consolidation.
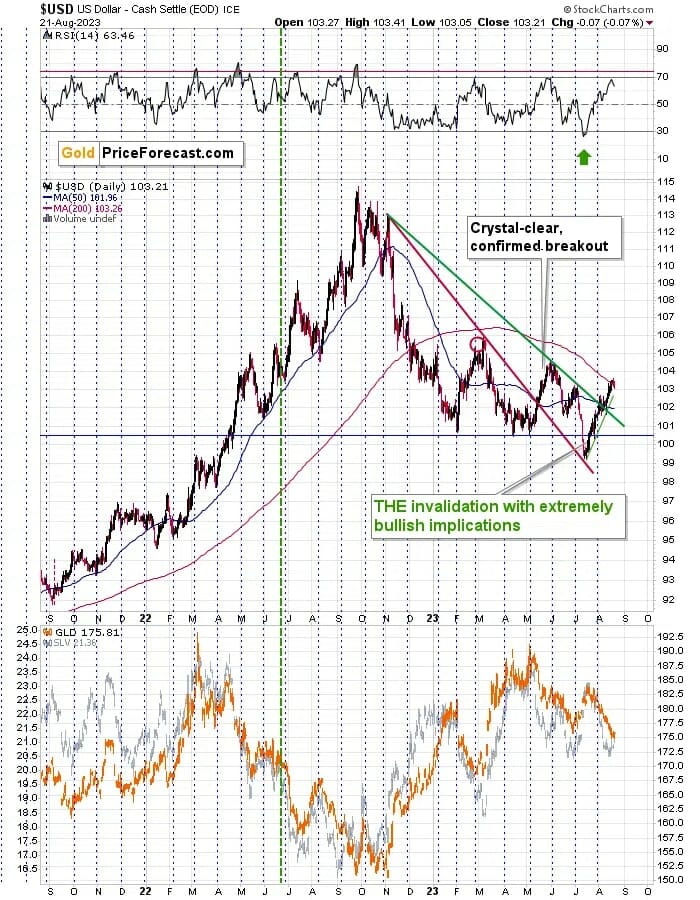
Right now, the USD Index is after a short-term rally, and the RSI based on it just (almost) touched the 70 level. Back in June 2022, the RSI was close to the middle of its trading range. Consequently, those two situations are not alike, and thus, the link between now and then is not really strong.
Therefore, the odds are that the excessive move lower in the GDXJ to SLV ratio (dramatic underperformance of juniors as compared to silver price) is truly a very bullish development, just like it was in the three cases that I mentioned above.
There are other factors that are also in play right now and that can help us pinpoint the target price for this rally, but the GDXJ to SLV ratio alone is a major factor contributing to the current bullish outlook (for the short-term only, but still).
Thank you for reading our free analysis today. Please note that the above is just a small fraction of the full analyses that our subscribers enjoy on a regular basis. They include multiple premium details such as the interim targets for gold and mining stocks that could be reached in the next few weeks. Subscribers also get intraday follow-ups whenever the situation requires them. We invite you to subscribe now and read today’s issue right away.
Sincerely,
Przemyslaw K. Radomski, CFA
Founder, Editor-in-chief


