
All investments are an exchange of cash flows. Cash flow out from the investor at the start of an investment is made in exchange for cash flows that typically come back to the investor in the future. Future cash flows are uncertain to varying degrees and present a challenge for those trying to decide whether the initial outgoing cash flow is a wise investment decision.
Check out our H2 hedge fund letters here.
A bond, for example, returns cash flows via regularly scheduled coupon payments and ultimately the scheduled return of the par value (we hope). Mortgage-backed bonds are significantly more complex to evaluate than regular bonds because an investor doesn’t know exactly when the par value will be returned. Pre-payment decisions made by individual homeowners mean that portions of the par value are returned at varying times and in varying amounts. Equities are also complex to analyze because, like mortgage-backed bonds, all future cash flows are of uncertain quantity. Additionally, unlike plain bonds, the timing and quantity of the final cash flow of an equity investment is unknown at the start and the timing is usually at the discretion of the investor. In the case of non-dividend-paying equities, the only return cash flow will occur when the position is liquidated, akin to a zero-coupon bond, but with an unknown date associated with the return of an uncertain principal amount.
Regardless of their complexity, all financial investments can be valued using the same Value Equation:
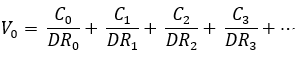
V0 is the value we assign to the investment today
Ci is the expected cash flow to us in period i
DRi is the discount rate used to bring the cash flow in period i to a present value
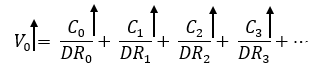
When analysts typically value equities, most of their intellectual energy is focused on forecasting the Cis. These may be dividends, which are actual cash flows to investors, or proxies for future dividends and cash flows, reported as forecasts of earnings, free cash flows, and similar metrics indicative of growing or declining shareholder equity. It’s not difficult for investors to access these estimates as many are publicly available with little or no cost. And investors and institutions of sufficient size often produce their own internal estimates.
However, this focus on the expected cash flows means that relatively little attention is being paid to the discounting of those future cash flows. The impact of errors in discounting can be immense and, therefore, much greater attention to their estimation is warranted.
Typically, analysts will discount future cash flows of equities using an equity risk premium to the “risk free” interest rate. The equity premium for one company will often be driven by a scaling up, or down, of the perceived risk premium assigned to the broad equity market combined with that company’s cost of debt. In normal practice, these discount rates are used to compare the expected cash flows from one stock to those of another stock having similar discount rates – similar risk, to determine which is more valuable. In fact, the expected cash flows of any financial instrument can easily be compared to another financial instrument if they have equivalent discount rates. Higher cash flows for the same discount rate mean the investment is worth more today.
Similarly, the same cash flows discounted at a lower rate mean that the expected cash flows are more valuable today.
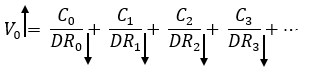
Without getting into too much of the math, the typical estimates of the discount rates to apply to individual equities are driven by past stock price behavior and have an inherently embedded assumption of future behavior mimicking the past. But what if the future isn’t the same as the past? And what if discount rates aren’t stable over time? There is clearly more forecast risk the farther you go out into the future and most investors have long holding period assumptions built into their investment process. So, again, it seems that more effort to understand future risk is warranted.
If traditional methods for estimating discount rates fail to reflect an emerging risk to future cash flows, the stock will be overvalued today. Similarly, if the risk profile of a company is improving, but backward-looking risk estimates are used to calculate discount rates, a bargain will be missed.
In my company’s work, we use the term “governance” to describe the likelihood that an organization can realize its goals. It is both an assessment of the framework for organizational execution of plans as well as a cultural indicator of an organization’s ability to be resilient – to shift focus or to re-shape itself in the face of challenges. Better governed companies are less risky and the expectations of their future cash flows, therefore, should be discounted at lower rates than poorly governed organizations. All else equal, better-governed companies are worth more.
But the quality of governance at specific companies is not always clear. Service providers like MSCI, Sustainalytics, TruValue Labs, and others attempt to quantify and rate “governance” for investors to incorporate into their analysis. My company, perhaps by virtue of my graduate schooling in Economics during the late 1980s, thinks that the market might additionally provide us with some indications of how companies are governed based on what people are paying for future uncertain cash flows relative to other investment opportunities. Our so-called Market-Implied Governance Metric sometimes stands in stark contrast to the governance rating agency assessments. What is one to do in these cases?
It would be nice if we could simply say that the ratings agency approach is correct, or that “the market” has spoken and is correct. But, if you have ever owned a stock that dropped in value by 20% or more in one day because of a surprise event, you know that no approach is universally accurate and that the efficient market god can disappoint.
Governance analysis helps us to have a different look at the risk to future cash flows. Resilient companies are more likely to provide dividends, earnings, or free cash flows for significantly longer periods of time. According to the Value Equation, that means those companies are worth more today. Poorly governed organizations, though, are brittle and their future cash flows might cease entirely. Without awareness of this risk, the realization of a large downward movement in value might be even more surprising. When you see an unusually large decline in a company’s stock, it is because the assessment of both the magnitude of future cash flows and the uncertainty around those future cash flows has changed for the worse. That situation is more likely to occur when a company is poorly governed.
So, what does this mean for portfolio construction? Perhaps surprisingly, this challenge is not unlike the challenge of forecasting cash flows for mortgage-backed bonds. The drivers of these estimates are different, but the concept is the same. In both cases, we’re trying to get a handle on how much risk there is to the market’s expectations of the timing and magnitude of future cash flows. Is a stock over- or under-valued based on this analysis? Are there better alternatives for our initial outgoing cash flow?
By comparing one company with substitute investments of equivalent sector, industry, financial ratios, etc., one can then compare them based on future risk – future discount rates. If the market is implying that risk is well below that indicated by peer comparison, perhaps there is an unappreciated vulnerability to future cash flows and a threat to the valuation of that company. If true, it would be wise to exchange those expected cash flows for similar expected cash flows at a lower-risk company.
And sometimes the markets get ahead of themselves in fear of risk, meaning that some companies are vastly undervalued because the market’s fear over the vulnerability of their future cash flows is too high. Perhaps a competitor recently had a significant problem, or there is some stigma assigned to their industry that should not apply equally to them. Having such insights can lead to discovered value.
Past examples include the banking sector in the immediate years following the Great Recession of 2008-2009. Not all banks had subprime mortgage exposures. And, more currently, concerns over the future of retail are perhaps being applied too broadly as some of the more resilient, well-governed retailers are re-shaping themselves for a different and better future than “retail” generally.
While it is dangerous to simply list one forward-looking example of this choice in markets (especially with an earnings announcement just days from now), I do so for illustration purposes here. For clarity, this example of a potential capital transfer is not a trade we have in our portfolio. Still, if you are long ICU Medical Inc (Ticker: ICUI), a capital transfer should be considered, and we have made a capital transfer between this company and the broad market.
ICU Medical Inc is a mid-cap Medical Supplies and Instruments company in which investors have become quite enamored, and also a bit complacent. The market’s assessment of the risk of ICUI has been steadily declining and the price risk realized by investors has been confirming that belief. As a mid-cap stock, it’s perceived risk in the marketplace is better than 63% of all companies in our models. But its prospective risk is worse than nearly all that we evaluate. This gap, between perceptions and our estimates of reality is higher than nearly all the companies in our evaluation universe, meaning that there is a pent-up vulnerability to large downside price movements. Overall, ICUI is given an “F-“ for Price Risk by our Sustainable Value Grade® models.
ICUI also receives an “F-“ for Financial Governance, an “F+“ for Value, and a “D-” for its Environmental, Social, and Corporate Governance (ESG, as measured by external rating agencies in our models).
The question to ask if you own stock in ICUI is whether you are being adequately compensated by your future expectations of cash flows for this less-than-stellar report card.
So, where might you find a better substitute?
One option is to look in the same industry. Luminex Corp (Ticker: LMNX), for example, receives average Sustainable Value Grades® for Quality, Price Risk, and Value, but its Financial Governance grade is “A+”, its ESG grade is “B+” and some key measures of the interaction between Quality, Price Risk, and Governance are better than 88% of the companies in our analysis universe.
For Medical Instrument and Supplies exposure, one might ask whether Luminex is a better place for your initial outgoing cash flow than ICUI.
However, Luminex has a market cap that is approximately 80% lower than ICUI. So, perhaps this shift in the cap spectrum is too great for your tastes. Jumping outside of the same industry, one can find companies like Ryder Systems Inc (Ticker: R) that is only slightly lower in market cap, has a Financial Governance grade of “A”, an ESG grade of “A”, a Price Risk grade of “A+“, and a Value grade of “A+”. This is not to suggest that a swap of ICUI for R is the right one in all circumstances, or at this immediate time. Alternative mid-cap substitutes include Williams Sonoma (Ticker: WSM), AGCO Corp (Ticker: AGCO), and Cracker Barrell Old Country Stores Inc (Ticker: CBRL), respectively from the Specialty Retail, Farm and Construction Equipment, and Restaurants industries.
We can find substitute expected cash flows with similar cap levels, similar ESG scores, similar price risk, and more. In almost all comparisons, there are better values for risk taken than ICUI. So, if you own stock in ICU Medical you should be very sure that your future cash flow expectations are correct. You may be right, but the models we have suggest that if you are incorrect, the market punishment will be much greater than the market reward for being correct. In other words, you may not be adequately compensated for the risk you have taken.
We can tell similar stories for Orbcomm Inc (Ticker: ORBC) and GTT Communications (Ticker: GTT) in the Telecom sector.
It is very important to note that our approach to portfolio construction is probabilistic, meaning that we don’t need to be right on everything, or even close to everything. Our incorporation of internal governance assessments, market-implied governance metrics, and rating agency assessments gives us an indication of the likelihood that one company is going to do better than another in comparison to current expectations. Over time and applied to a large number of companies, portfolio adjustments based on governance and valuation gaps suggest a higher probability of investment outperformance.
Governance assessments applied in this manner mean that “governance” becomes a proxy for risk and the indicated risk premium that should be demanded over the “risk free” rate in the Value Equation. Governance also gives us a proxy for the likelihood of growing and sustainable future cash flows. Governance is forward-looking and not dependent on the assumption that past market behavior of a stock relative to the broad market will be the same in the future. When trying to assess the value of future uncertain future cash flows, understanding the difference between what the market perceives about risk and what risk actually exists is essential.
Article By David R. Koenig, Founding Principal, The Governance Fund
Tickers mentioned: ICUI, LMNX, R, WSM, AGCO, CBRL, ORBC, GTT
Disclosure: Our internal portfolios continue to hold risk-transfer positions in ICUI, ORBC, and GTT, where these stocks are shorted and the capital is transferred to a broad market index long position.
About the Author – David R. Koenig is the Founding Principal of The Governance Fund, was responsible for developing risk management programs at three different companies, had risk oversight for all of the public mutual funds for one of the worlds largest banks, is the author of Governance Reimagined: Organizational Design, Risk, and Value Creation (Wiley, 2012), was awarded an inaugural M-Prize for Management Innovation, and was chosen as the recipient of the PRMIA Higher Standard Award for contributions to the risk management profession. He also manages the Directors and Chief Risk Officers group, a global association of board members and c-level executives from more than 115 countries whose work focuses on the governance of risk. His full bio is available at https://thegovfund.com/about-us.
Important Disclaimer
This report is provided solely for information.
This report is not an invitation or inducement to engage in investment activity, nor is it an offer to buy or sell securities, and does not constitute tax, investment or other advice. Neither this report nor the information contained in it should be relied upon.
The Governance Fund does not aim to provide advice which is appropriate to the individual circumstances of the private investor. Use of this report is not a substitute for obtaining proper investment advice from an authorized investment professional. While the information contained herein has been obtained from sources deemed reliable, neither The Governance Fund nor any party through whom the reader obtains this report guarantees that it is accurate or complete or makes any warranty or representation with regard to the results obtained from its use. In addition, the information contained in this report may become inaccurate as a result of the passage of time and should therefore be read for historical information only. Potential investors are urged to consult their own authorized investment professional.
The Governance Fund makes no warranty or representation that this report or its contents are current or that they have been updated based on changes in the economic market or other factors. In particular, but without limiting the preceding sentence, statements of fact or opinion made by The Governance Fund in this report may not be up-to-date and may not represent the current opinion of The Governance Fund.
When used in this report, the terms “we,” “our” or “us” mean, unless the context otherwise indicates, The Governance Fund Advisors, LLC.


