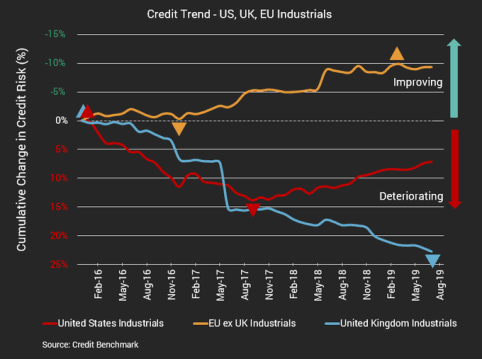
Highlights from the new data from Credit Benchmark, the financial analytics firm that assesses industrial credit risk using bank-sourced data.
That is industrial credit risk data for large US, UK, and EU firms. The most recent data show a relatively optimistic picture for US and EU industrial firms. US industrial credit risk has improved by 5% year-over-year, and EU has stabilized after recent improvement. But it’s a different story for UK industrial credit risk, which continues to worsen and is down 6% year-over-year. It’s been trending down for years and is now at its lowest point since Credit Benchmark began tracking this data. You can see this in the chart below.
[REITs]Q2 hedge fund letters, conference, scoops etc
Industrial credit risk analysis
It should come as no surprise, then, that forward-looking assessments of UK industrial credit risk are bad. As described the latest Credit Benchmark CCI data that I highlighted for you earlier this week, the UK CCI for September is 48.2, compared to 49.3 last month, dropping deeper into negative territory and suggesting a return to a downgrade trend. (A monthly CCI score of 50 indicates neutral credit quality, with an equal number of upgrades and downgrades made over the course of a month; below 50 means deterioration and above 50 means improvement.)
As background, Credit Benchmark brings together internal credit risk views from 40+ of the world’s leading financial institutions, whose analysts model risk to understand their own bank’s exposures. The inputs they collect are anonymized, aggregated, and published in the form of consensus ratings to give an independent view of credit quality and provide a rich set of analytics for benchmarking credit risk exposures. Consensus ratings are available for 50,000+ financials, corporate, and sovereign entities (as well as funds) globally across emerging and developed markets, and 75% of the entities it covers are otherwise unrated. It is similar to Moody’s, Fitch, and S&P, but different because it has data no other firm has.


