The current stock market correction offers a great example of two things: (1) how ridiculous investor–or market–psychology is; and (2) how dumb Wall St. products can be. I’ll also tell you why I don’t think the current market correction is anything to worry about. Actually, it was probably needed to prevent a bubble.
The Market Is Mad that Its Dream Came True
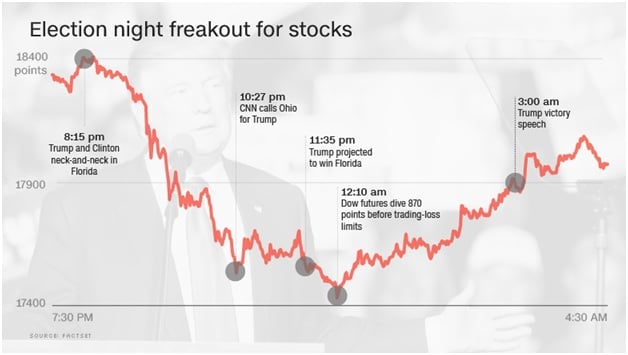
Let’s start with the ridiculous. Think back to election night. As the polling results started to come in and a Trump victory looked possible, and then likely, the market began to drop. It went down about 5% overnight.
In the morning and during that next the trading day, the market rose and finally finished up 1.1%. The market had decided that Trump was going to be the fiscal stimulus president. We were going to get “bigly” tax cuts! And infrastructure spending! And even more military spending!
Fast forward to today. We pretty much got that Trump. Huge corporate tax cuts, some small individual tax cuts, and a recent spending deal in Congress that looks to increase both defense and discretionary spending. The market’s dreams have come true; yet, now the market seems to be worried about the possibility of rising inflation because of said dreams.
Wall Street’s World of Dumb Products
The recent correction has also showcased the stupidity of one of Wall Street’s latest investment creations. While there are certainly legitimate uses for things like derivatives and futures (e.g., a farmer locking in prices for his upcoming soybean crop or an airline hedging fuel costs) there is no reason for most of the crazy stuff Wall St. dreams up to be in your investment portfolio.
There were several funds (called ETNs or Exchange Traded Notes) that allowed investors to make bets about whether or not the stock market was going to become more or less volatile. Over the past year, the market was quite calm and investors increasing made large bets that it was going to remain calm. (Don’t ask me why people thought that betting that the stock market, known for volatility over its history, would be calm was a smart idea.)
One of the funds that used to make that bet was the Credit Suisse VelocityShares Daily Inverse VIX Short Term ETN (ticker: XIV). This fund is so stupid that the prospectus even says that over the long term it will go to zero: “The long term expected value of your ETNs is zero. If you hold your ETNs as a long term investment, it is likely that you will lose all or a substantial portion of your investment.” Well, guess what? Last week’s market volatility made Monday the day that came true. The fund is now down about 95% from its highs and is being closed.
Part of the reason the market dropped so far so fast was likely due to the fact that a lot of investors and hedge funds had made bets on continued calm in the markets. They were now being forced to unwind those bets and essentially sell stocks. This wasn’t the only reason, but it was likely a strong contributing factor as to why the market went down so fast. The biggest issue probably was the question of inflation.
Inflation?
Will all this new spending create inflation that is high enough to disrupt the economy and the markets? Given the sheer size of the tax cut and the prospect of larger budget deficits, I think it’s prudent to expect inflation to increase, but I don’t think it will become problematic.
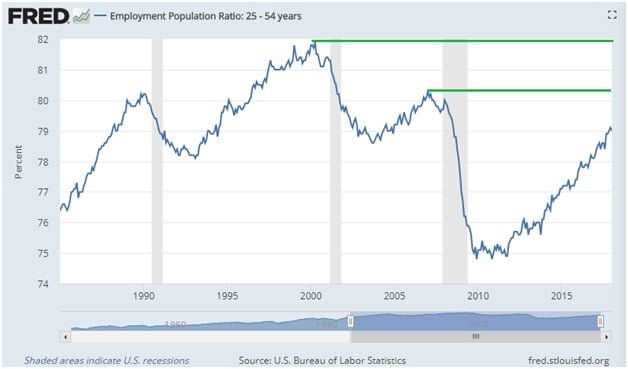
First off, we are not yet at full employment. The graph below shows the current rate of prime age (25 to 54) employment. We are still below our two previous economic cycle highs (shown in green).
It’s likely that the labor market can absorb another 3% of 25-54 year-olds going back to full time work until we need to start worrying about wage gains outstripping corporate profit growth (from a stock market perspective). Obviously, from a personal perspective, many people would welcome wages growing faster than corporate profits. Even then, a tight labor market may not be all bad. Consumer spending makes up about 70% of GDP. The more wages workers bring home, the more they have to spend. That spending is recycled back into corporations in the form of increased sales and profits.
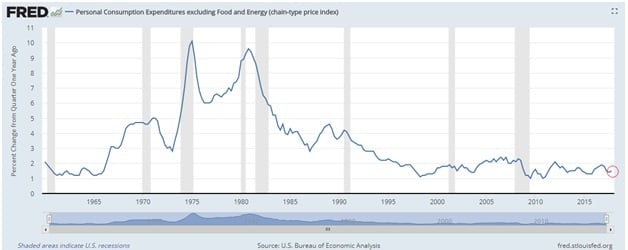
The worries about inflation picking up also seem curious in historical context. The chart below shows year over year percentage change in core inflation since 1950. See the little red circle. That highlights the slight uptick that the market is concerned about.
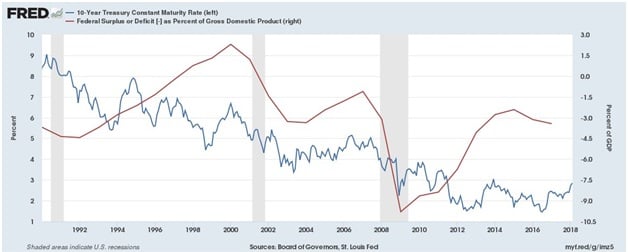
There’s also no historical link between interest rates and higher deficits. The chart below shows the 10 year treasury yield and the federal deficit (or surplus) starting around the Clinton years until present.
There is absolutely no correlation between anything. The expectation that higher deficits by themselves will drive higher interest rates is wrong. Additionally, most of the tax cut is focused at the corporate level and has a low fiscal multiplier. If history is any guide, then most of that money will be used to pay down corporate debt and fund dividends and share buybacks. Yes, some will be paid out to employees (see all the companies giving $1000 bonuses) but a vast majority of the money will not. For instance, a recent Morgan Stanley survey suggests about 13% of the tax cut money will end up as higher wages, which is in line with the .1 to .2 (i.e., 10% to 20% of the money driving consumption) fiscal multiplier that historical corporate tax cuts have generated.
What Should You Do?
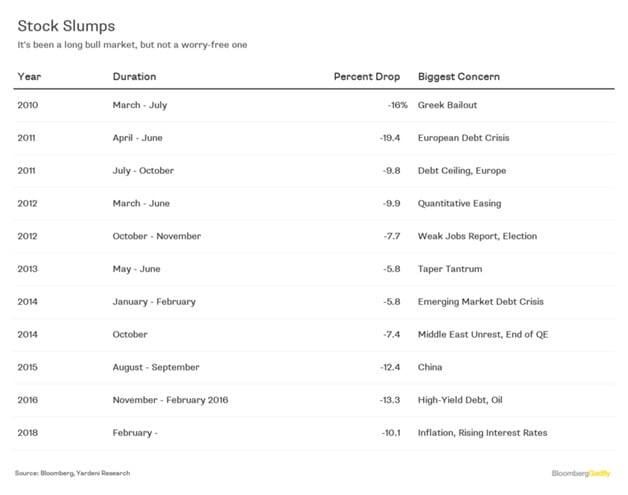
The short answer is nothing. In my opinion, the two-year run of a calm, quiet, rising market really risked creating a bubble. The last thing we needed was people thinking stocks can never go down, pouring all their money into the market, and turning it into a “Trump Bubble.” Sure, we would have all been much more comfortable if the market was up 15% from last year and was flat so far this year. Corrections, however, are a regular part of the market and nothing to fear. In fact, it’s amazing how many we’ve had in the current bull market. The graphic below from Bloomberg shows ten previous instances the market was down 5% or more.
With earnings estimates increasing and the prospect of continued economic growth, perhaps buoyed by higher deficits, there is nothing fundamentally worrisome in corporate America. The recent drop in the market puts valuations at a more reasonable level and serves to remind everyone that stocks are risky. Such corrections go a long way toward preventing investors from becoming complacent and help prevent a true stock market bubble from forming.
I know it’s strange to hear your investment advisor welcome a 10% market drop. I’d much rather my clients and I experience a run-of-the-mill 10% or 15% correction now, just like one of the other ten that we’ve had before and easily recovered from, than have a true bubble form that gives us all the experience of a 50% drop three years from now.
Over the coming weeks and months, I expect investors and the market to obsess about inflation and interest rates. Although the market has rebounded some, I expect continued volatility. We can be mentally prepared for another big drop here or there on some day when some economic news is released. The market tends to overreact both positively and negatively, so expect more ups and downs. Perhaps the market will bottom out 15% or even a bit more from its January highs. There is nothing fundamentally to worry about, and continued economic growth and strong corporate earnings will drive the market higher over the long term.
About Our Portfolios
The Capital Appreciation Fund and the Dividend Fund are innovative, investor friendly alternative to traditional actively managed mutual funds called a Spoke Fund ®. We can also customize portfolios for clients seeking less risk and volatility by including allocations to other asset classes such as bonds and real estate.
Spoke Funds are significantly less expensive and more transparent than a large majority of mutual funds. Both portfolios are managed for the long term using value investing principles. Fees for both portfolios are 1.25% of assets annually. That figure includes both our management fee and all trading costs. We try to minimize turnover and taxes as well in both funds.
Investor accounts are held in your name (we never take investor money) at FOLIOfn or Interactive Brokers*.
For more information visit our website.
*Some older accounts may be custodied at TradePMR.
Disclaimer
Historical results are not indicative of future performance. Positive returns are not guaranteed. Individual results will vary depending on market conditions and investing may cause capital loss.
The performance data presented prior to 2011:
- Represents a composite of all discretionary equity investments in accounts that have been open for at least one year. Any accounts open for less than one year are excluded from the composite performance shown. From time to time clients have made special requests that SIM hold securities in their account that are not included in SIMs recommended equity portfolio, those investments are excluded from the composite results shown.
- Performance is calculated using a holding period return formula.
- Reflect the deduction of a management fee of 1% of assets per year.
- Reflect the reinvestment of capital gains and dividends.
Performance data presented for 2011 and after:
- Represents the performance of the model portfolio that client accounts are linked too.
- Reflect the deduction of management fees of 1% of assets per year.
- Reflect the reinvestment of capital gains and dividends.
The S&P 500, used for comparison purposes may have a significantly different volatility than the portfolios used for the presentation of SIM’s composite returns.
The publication of this performance data is in no way a solicitation or offer to sell securities or investment advisory services.
Article by Ben SStrubel, Strubel Investment Management

