Logica Capital commentary for the month ended November 2021.
Q3 2021 hedge fund letters, conferences and more
Logica Absolute Return (LAR) - Upside/Downside Convexity - No Correlation
- Tactical/dynamic balanced Put/Call allocation - Straddle
Logica Tail Risk (LTR) - Max Downside Convexity – Strong Negative Correlation
- Tactical/dynamic downside tilted Put/Call allocation - Ratio Straddle
Summary
What had been a very quiet month turned on its head just after Thanksgiving. While the S&P 500 ended down a mere 80bps on the month, the Russell 2000 Index was down more than -4%, presumably due to market hesitancy on positions that might be most affected by another COVID-19 liquidity breakdown.
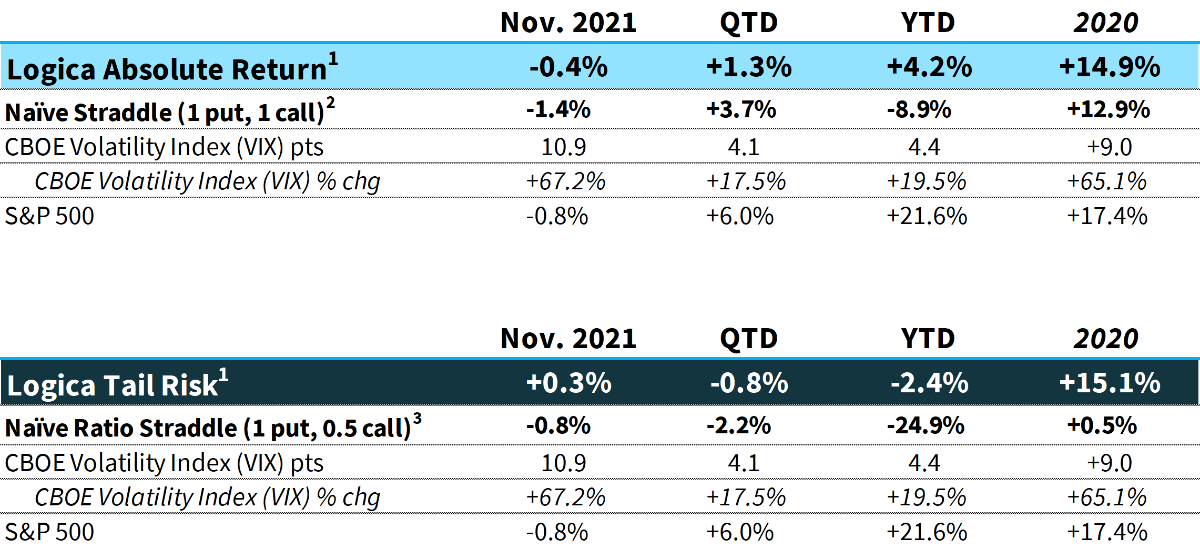
1 Returns are Gross of fees. LAR Fund -0.59% (net), LTR Fund +0.23% for November 2021
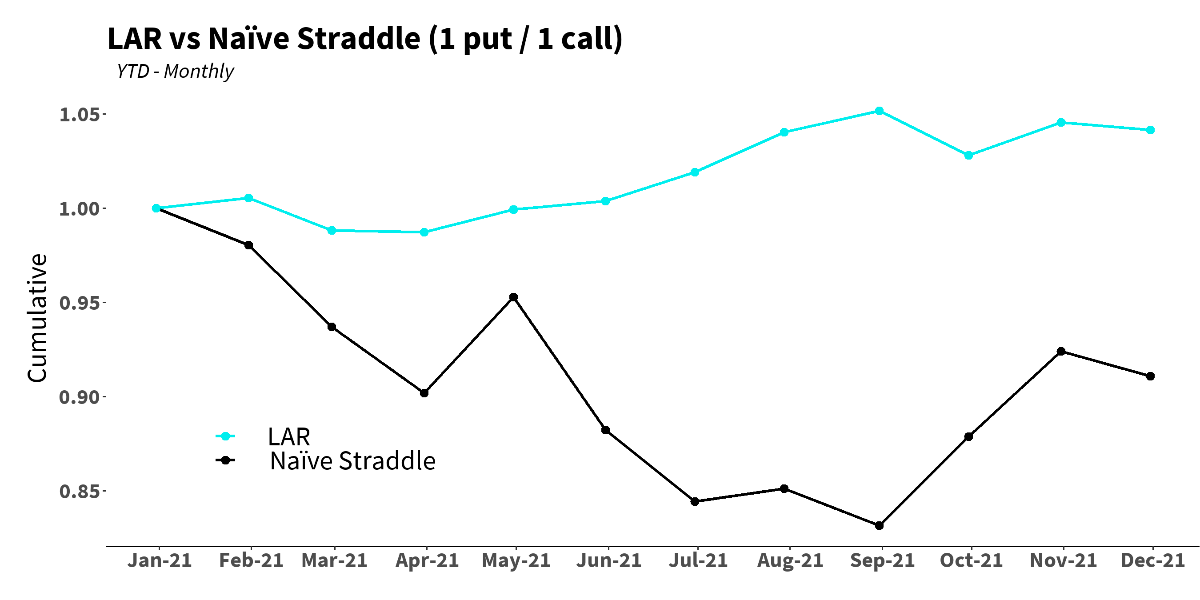
2 Naïve Straddle Return: a 1.5 month out, S&P 500 at-the-money put and call bought on the final trading day of prior month and sold on the final trading day of current month. This return on premium is divided by a factor of 6 to be comparable to Logica’s typical AUM-to-premium ratio.
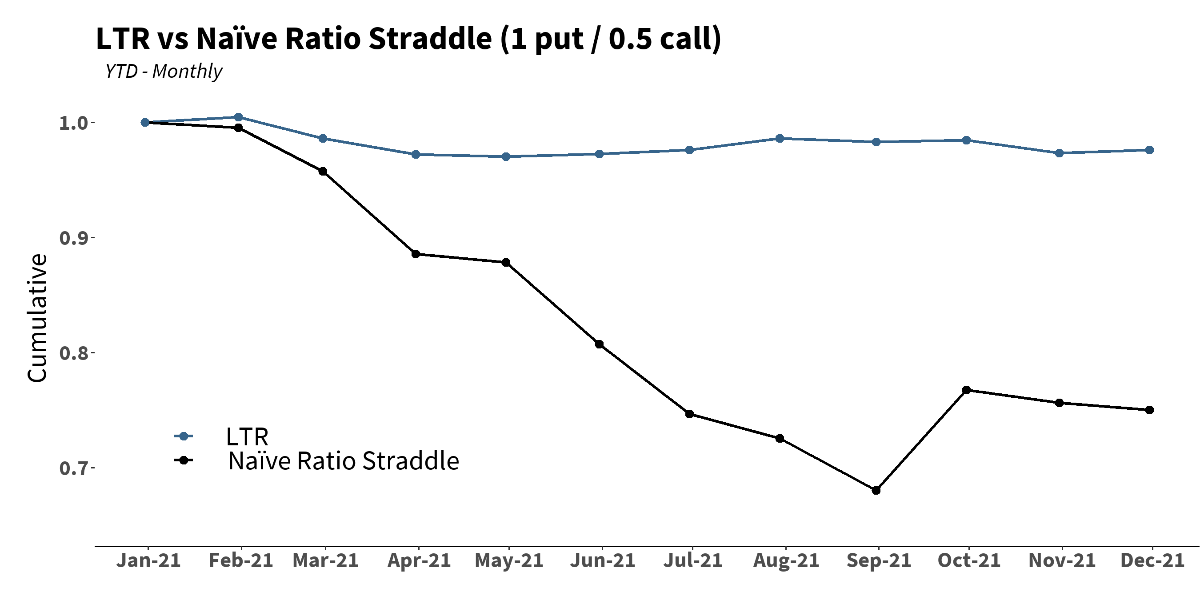
3 Naïve Ratio Straddle Return: a 1.5 month out, S&P 500 at-the-money put and at-the-money call (divided by 2) bought on the final trading day of prior month and sold on the final trading day of current month. This return on premium is divided by a factor of 6 to be comparable to Logica’s typical AUM-to-premium ratio.
Commentary & Portfolio Return Attribution
“A last minute goal will change the entire game. Anything is possible.” - Various Soccer Champions
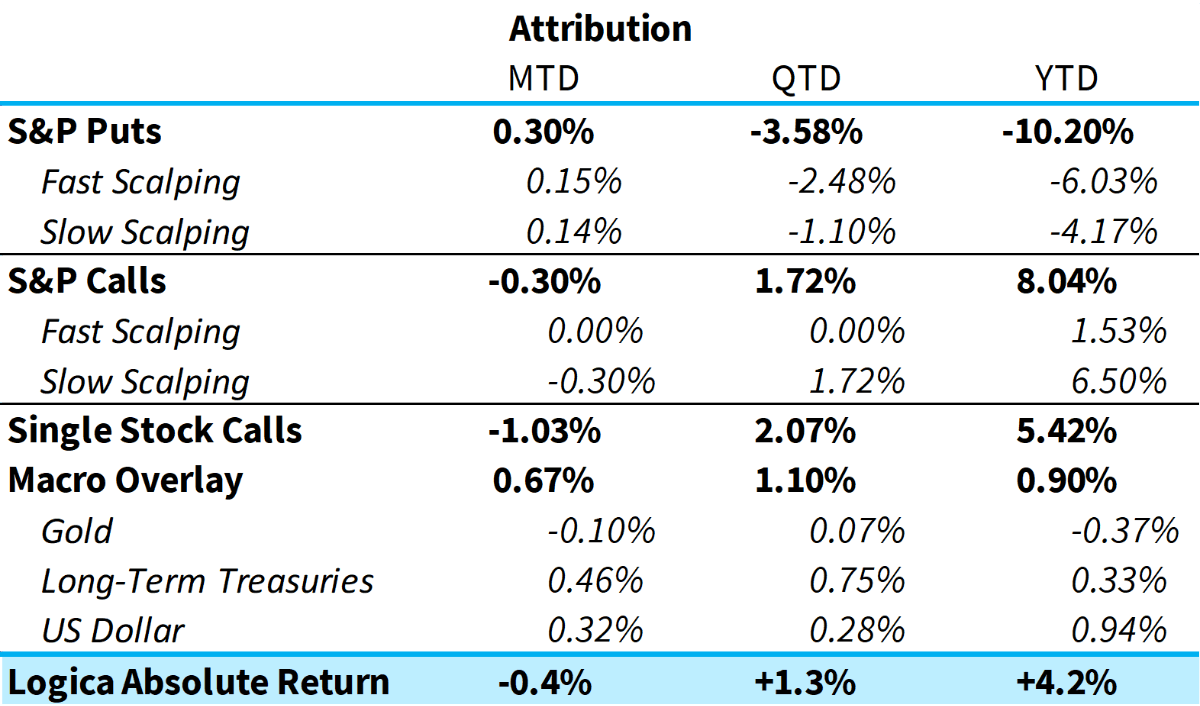
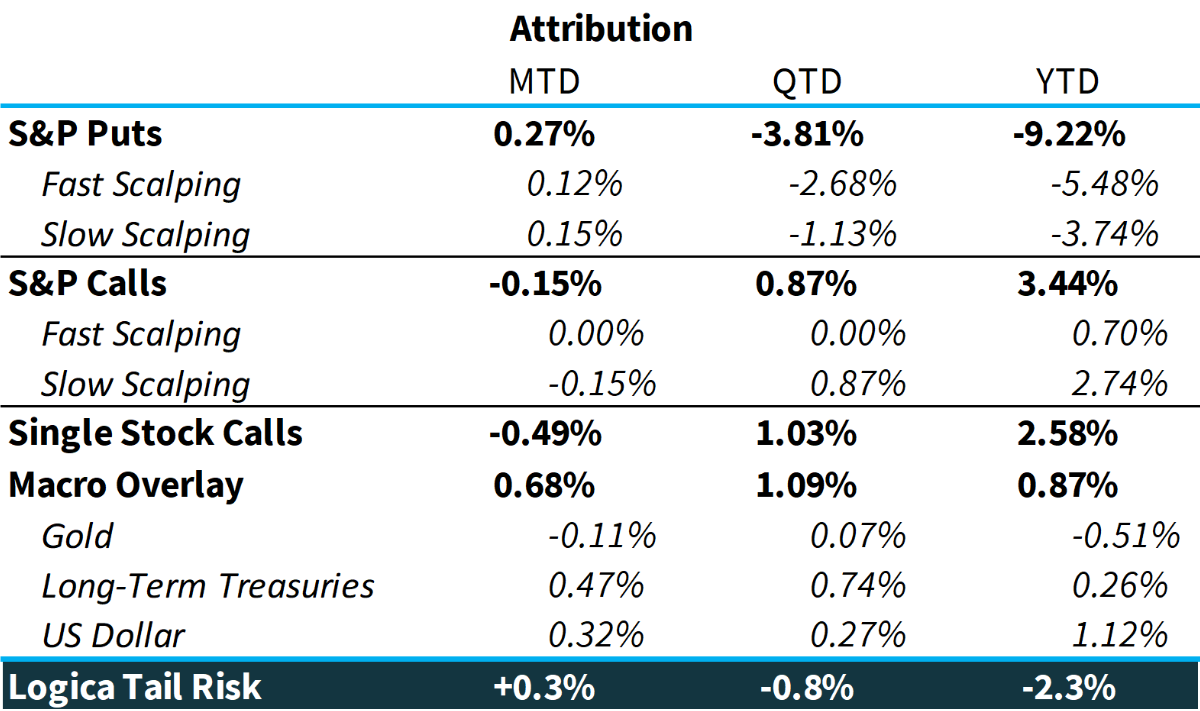
November ended with a bang: from its intra-day high on 11/22, the S&P 500 reversed -3.8% and commensurately, VIX rose nearly 10 points. While the story might be much clearer by the end of December, the last few days of November currently serve as a warning for potential moves in the near future. To this end, our models briefly reached the threshold of our Phase Shift on the final day of the month (please refer to past letters for a deeper dive into this regime change). For November, S&P Puts and Calls were collectively flat, with puts gaining, and calls losing, as might be expected given the slight down move in the underlying. Our Macro Overlay generated the payoff that we would expect in a month that experienced some tumult. We are still hard at work, in both thought and research, on the future innovation around this exposure. But for now, we are pleased to see it bounce back as we had expected given our research. It provided the extra piece of “crisis” alpha to help buoy the portfolio in the earliest phase of a potential downside move, when the rest of the portfolio was merely “gearing up.”
“Be sure when you step, to step with care and great tact. And remember that life’s a great balancing act.” -Dr. Suess
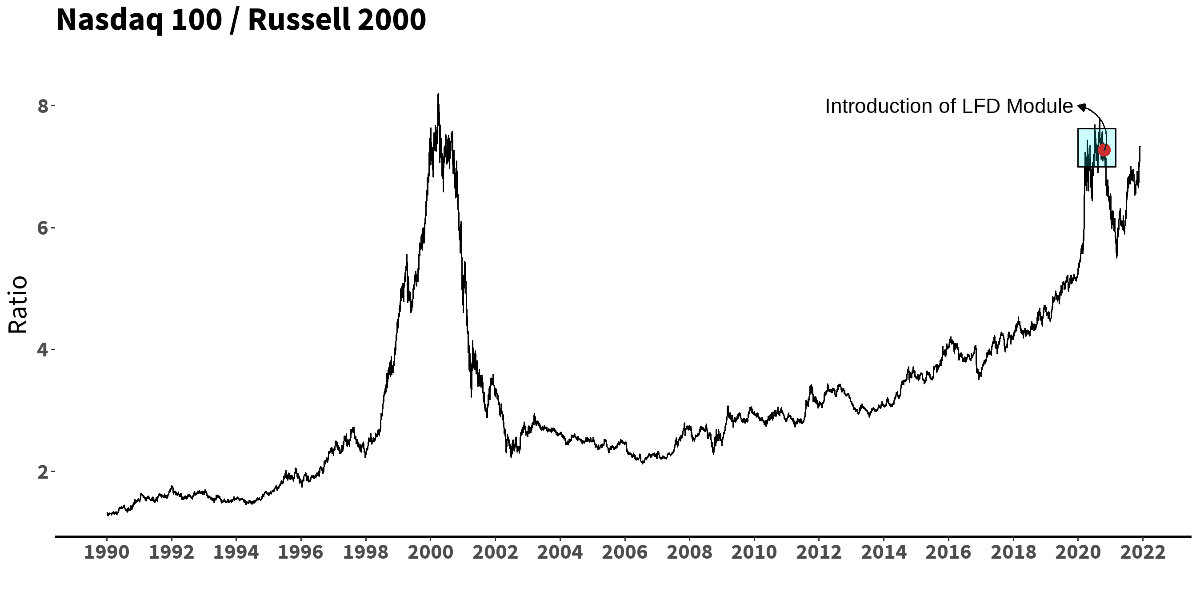
The story of the month was Single Stock Calls. We’ve written extensively about our exposures here, and belief in factor balancing, over the past year. While this tactical diversification has been mostly additive, in November it was not. Positions that correlate a bit more with value exposures (Logica Focus Diversifier module, or “LFD”) contributed approximately -1.50%, while positions that correlate a bit more with growth/tech exposure contributed approximately +0.50%. This is not surprising given the fact that the Dow Jones Index was down -3.7%, and the Russell 2000 Index was down -4.3%, while on the other side of the coin/market, the NASDAQ 100 was up +1.80% on the month. A fairly extreme factor dispersion to say the least. As it is our belief that trying to time “growth” vs “value” (or, momentum vs. anti-momentum) is a futile endeavor, our portfolio seeks to maintain an ideal balance between the two major factors by deploying capital into the best possible selections for each bucket. Let’s look back on an old graphic, annotated with the introduction of LFD shortly after the 2020 election, and updated with recent index performance, showing the relative performance of Nasdaq 100 to Russell 2000 over the years:
While the Russell 2000 had an admirable run for about 8-9 months, the past 6 months or so have been more with the Nasdaq 100.
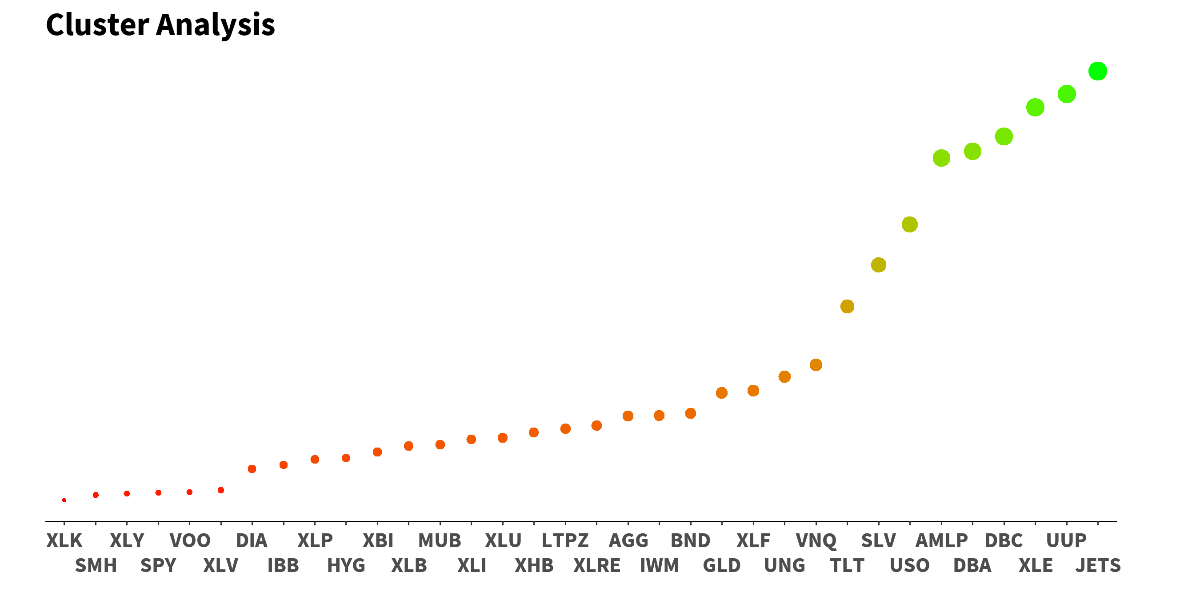
There are 2 basic goals within this LFD module: 1 is to diversify existing portfolio exposures well: that is, to have additional long positions that are as differentiated as possible from the momentum oriented selections inside the momentum module, and 2 is to beat the “benchmark” (generate alpha) for the relevant index: our growth/tech exposures benchmark might be the NASDAQ 100, while our defensive/diversified exposures might be the Dow Jones and Russell 2000 indices. #2 is fairly straightforward, and here we are proud to say that our LFD bucket is up more than +21% YTD compared to +12.7% for the Dow Jones Index and +11.4% for the Russell 2000 Index. That said, let’s expound on our approach to #1 a little more. We typically hold more S&P puts than S&P calls, parsing out call exposure across more specific upside bets. And the reason for concentrated S&P 500 Index puts for downside is our belief that they are the gold standard when it comes to portfolio protection: they are at the nexus of volume/liquidity (relative to other tradable protective instruments, with our At-the-Money [ATM] exposure being at the pinnacle of such liquidity), and are the most path and factor independent. Above all, they’re the best place to go to minimize basis risk – as simply, they are the basis! With that in mind, given our substantive S&P 500 Index put positioning, in order for the overall portfolio to achieve its ideal straddle-like exposure, we must have adequate long call exposure elsewhere. Because of the nature of convexity, and the limited loss attribute of call options, we consider these advantages as an opportunity to buy positions that are a bit more concentrated with respect to factor and/or idiosyncratic exposure. And the cornerstone to this idea is that we are growth/momentum traders, not value traders. With this as our initial position, we then focus on how to offset, or diversify, this particular type of long exposure. Below is a graphic illustrating a sample cluster analysis on the NASDAQ 100 (QQQ) ETF, which might be a very generic approximation of the growth/momentum factor exposure we would seek to offset. Reading from left to right, red dots represent ETFs that exhibit behavior most like QQQ, while green the opposite.
This kind of tool, especially through mathematically robust clustering methodologies instead of less reliable correlation measures, helps to define a universe of stocks and ETFs to focus on prior to applying other proprietary metrics to make the decision on position selection (we’ve omitted single stock names here and just included ETFs for illustration purposes). Of course, we’re not only evaluating relationship metrics via clustering, but implementing numerous proprietary methods for implied volatility metrics, skewness, behavior of the underlying, and at the very end, optimized to a specific strike and expiry for an option position. So while we’re mildly disappointed that the LFD module took away from a volatility tailwind in November, we are very comfortable with our process and its robustness toward a healthy balance to our portfolio.. At the same time, we’re always evaluating and trying to improve our allocation process across all of our modules and their underlying positions. Our portfolio is designed toward independence to the most possible paths, and this necessarily means that nearly every month there will be a certain amount of “regret” with respect to some portion of the book, and concurrently, some excitement with respect to another portion.
“Just the Facts, Ma’am, Just the Facts.” - Sgt. Joe Friday (purportedly)
Here’s a look at our naïve straddle benchmarks for the year, which, despite the appreciation in implied volatility, saw a much tougher time of it in November:
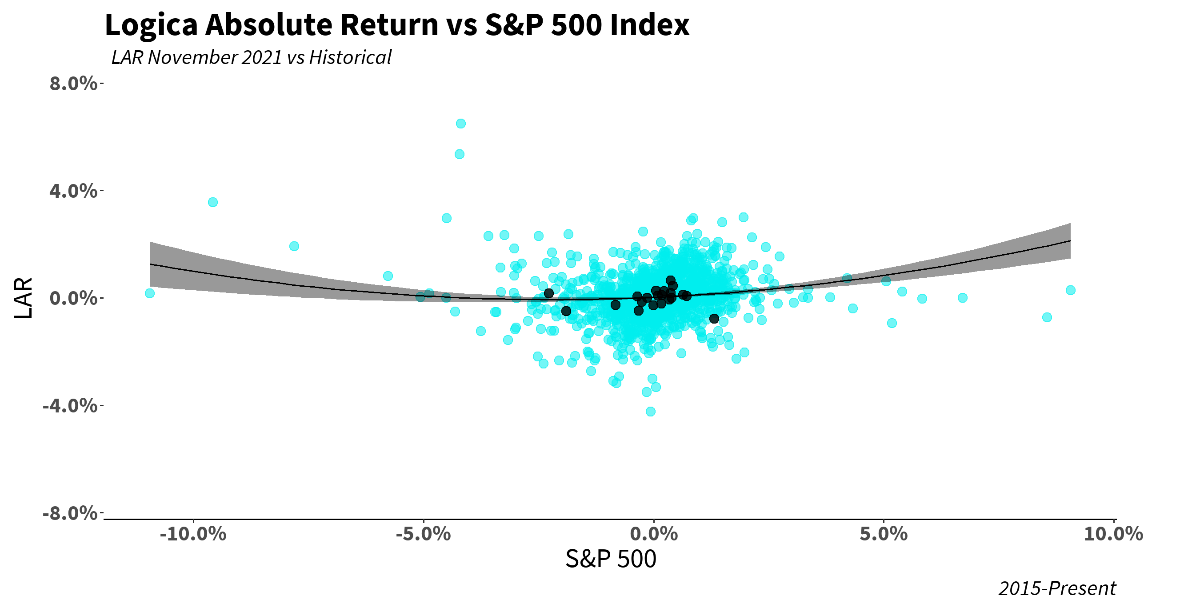
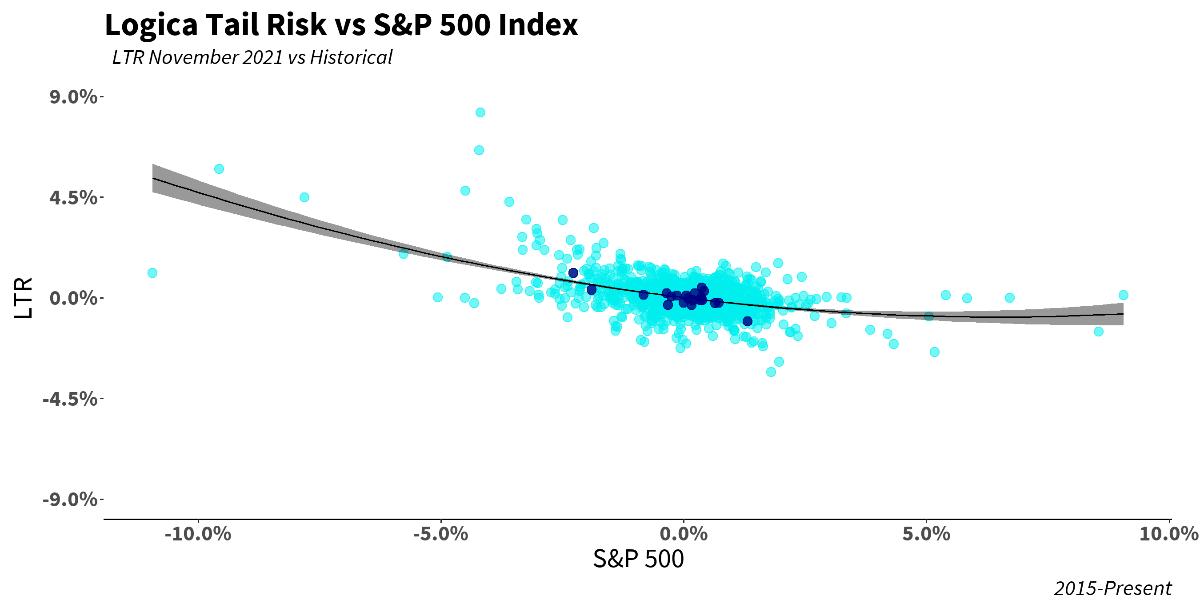
Scatter plots for November are as expected, with one exception: On 11/29, there was a significant factor rotation, as we discuss above. The S&P 500 gained 1.3%, NASDAQ 100 gained 2.3%, while the Russell 2000 lost -18bps. To add to that, implied volatility was absolutely crushed: with, for example, VIX down -5.66 points on the day. Given recent behavior, our position heading into the day was fairly defensive, both in our Put load and our factor balance, and so would have greatly benefited from a move higher in implied vol and/or less of a factor dispersion. Thus, neither LAR nor LTR performed as we anticipated, which had a non-negligible effect on the final print for the month:
Logica Strategy Details
Note: We have comprehensive statistics and metrics available for our strategies, but only include a select few to highlight what we believe is our most valuable contribution to any larger portfolio.
If you would like to learn more about our strategies, please reach out to:[email protected]
424-652-9500
Follow Wayne on Twitter @WayneHimelsein
Logica Absolute Return
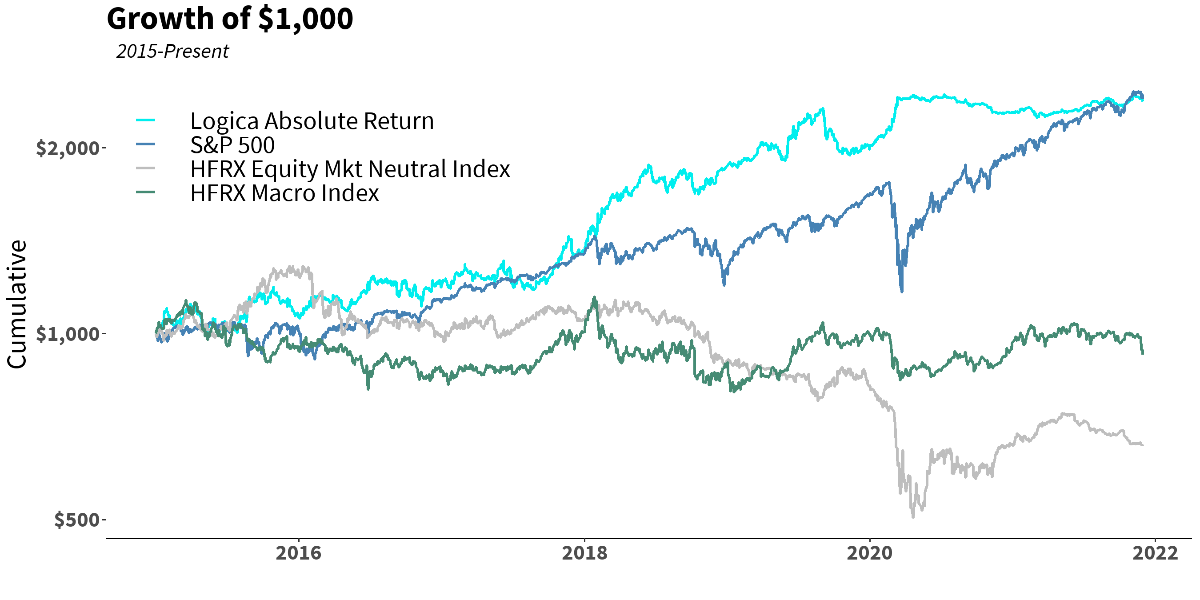
2015-2019 stats & grid, reconstitution of live sub-strategies normalized to 16% annualized volatility
Jan 2020 live
*HFRX Indices have been scaled up to 15% annualized volatility to be comparable to LAR and S&P 500.
Logica Tail Risk
2015-2019 stats & grid, reconstitution of live sub-strategies normalized to 16% annualized volatility
Jan 2020 live
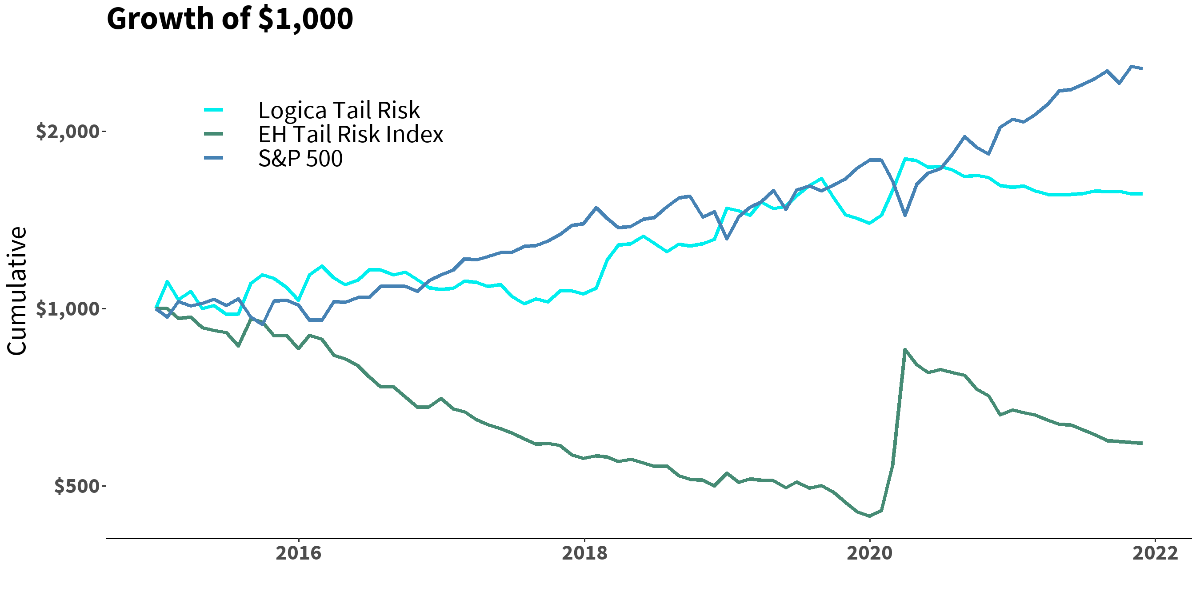
*EHTR Index has been scaled up to 17% annualized volatility to be comparable to LTR.

