Logica Capital commentary for the month ended May 2021.

Q1 2021 hedge fund letters, conferences and more
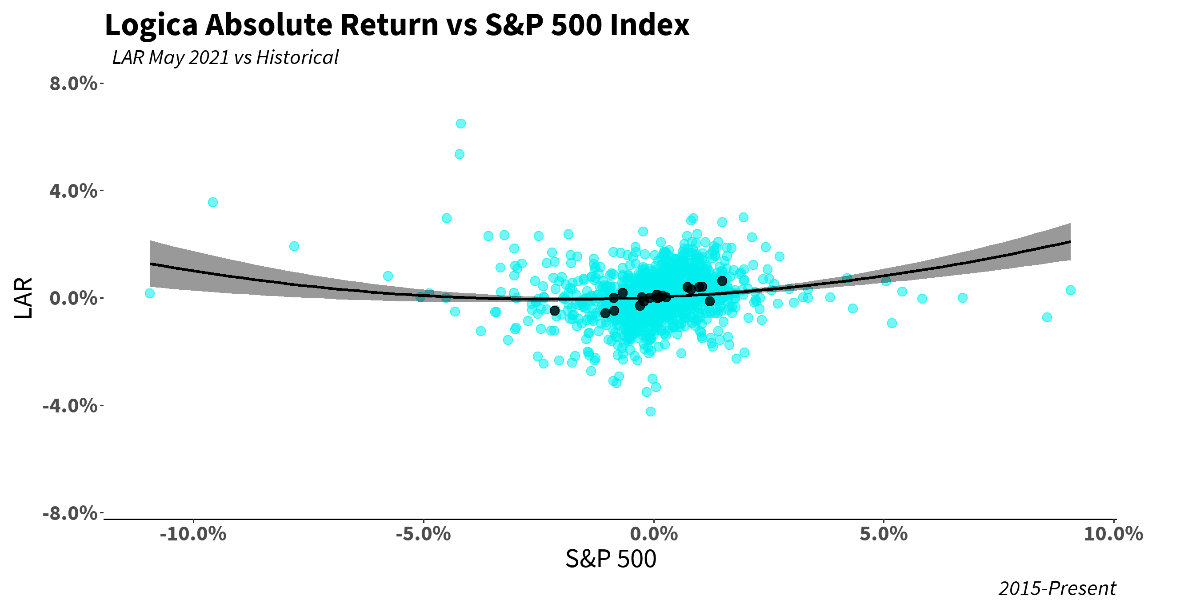
Logica Absolute Return (LAR) - Upside/Downside Convexity - No Correlation
- Tactical/dynamic balanced Put/Call allocation - Symmetric Straddle
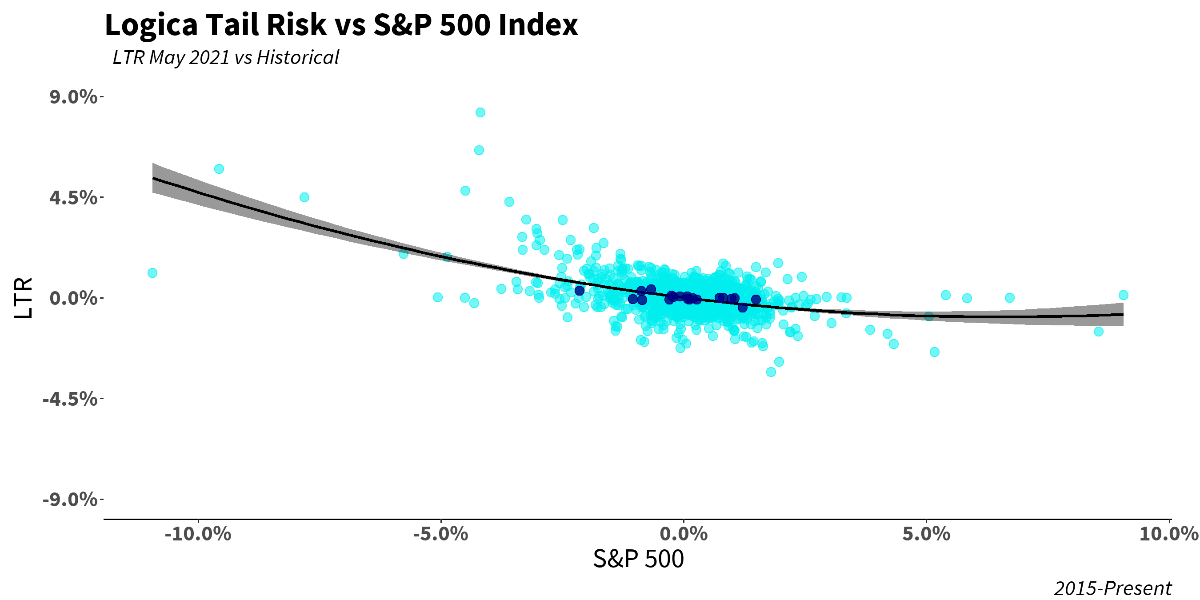
Logica Tail Risk (LTR) - Max Downside Convexity – Strong Negative Correlation
- Tactical/dynamic downside tilted Put/Call allocation - Ratio Straddle
May 2021 Performance*
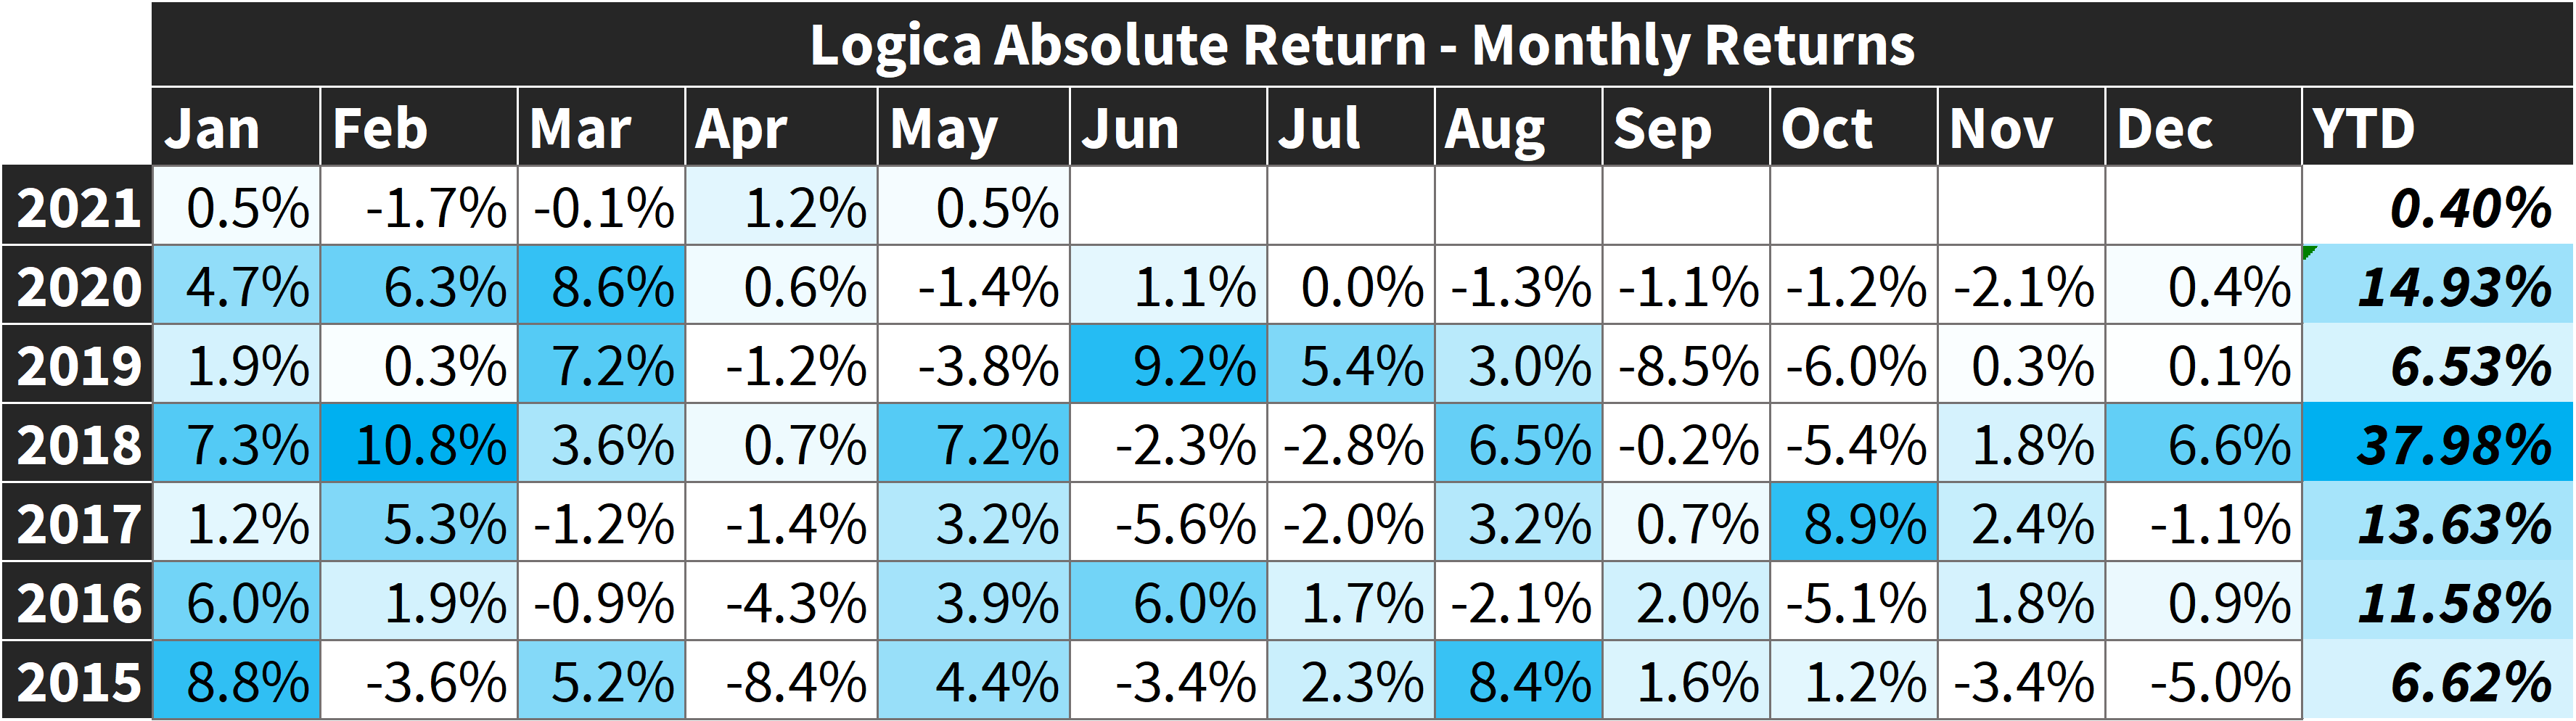
- Logica Absolute Return +0.5%
- Logica Tail Risk +0.2%
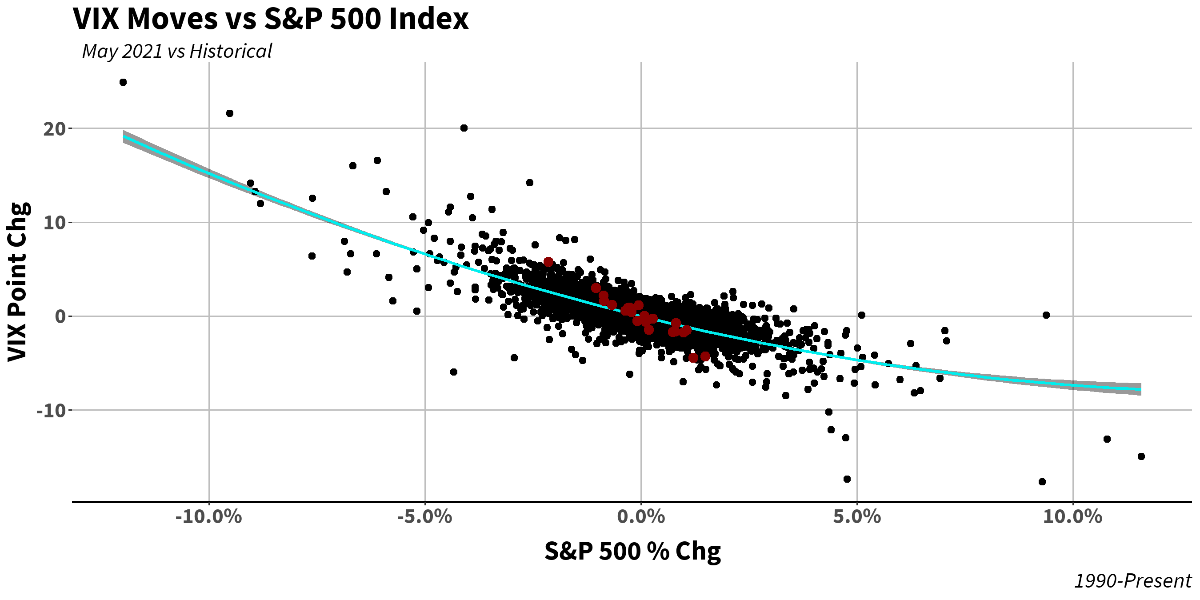
- VIX -9.9% (-1.9 pts)
- Naive Straddle -7.4%**
- S&P 500 +0.6%
YTD Performance*
- Logica Absolute Return +0.4%
- Logica Tail Risk -2.8%
- VIX -26.3% (-6.0 pts)
- Naive Straddle -11.8%**
- S&P 500 +11.9%2020 Performance*
- Logica Absolute Return +14.9%
- Logica Tail Risk +15.1%
- S&P 500 +17.4%
Summary: Despite a couple of attempts to break its 50-day moving average, the S&P 500 (and other indices) proved resilient during an otherwise quiet month for equities. More notably, the CBOE Volatility Index (VIX) closed the month at its lowest point since the end of 2019. Lower implied volatility (IV) levels continue to be a welcome sight.
* Returns are Gross of fees. LAR Fund +0.42% (net), LTR Fund +0.13% for May 2021** Naïve Straddle Return: a 1.5 month out, S&P 500 at-the-money put and call bought on the final trading day of prior month and sold on the final trading day of current month. This return on premium is then divided by a factor of 6 to be comparable to Logica’s typical AUM-to-premium ratio
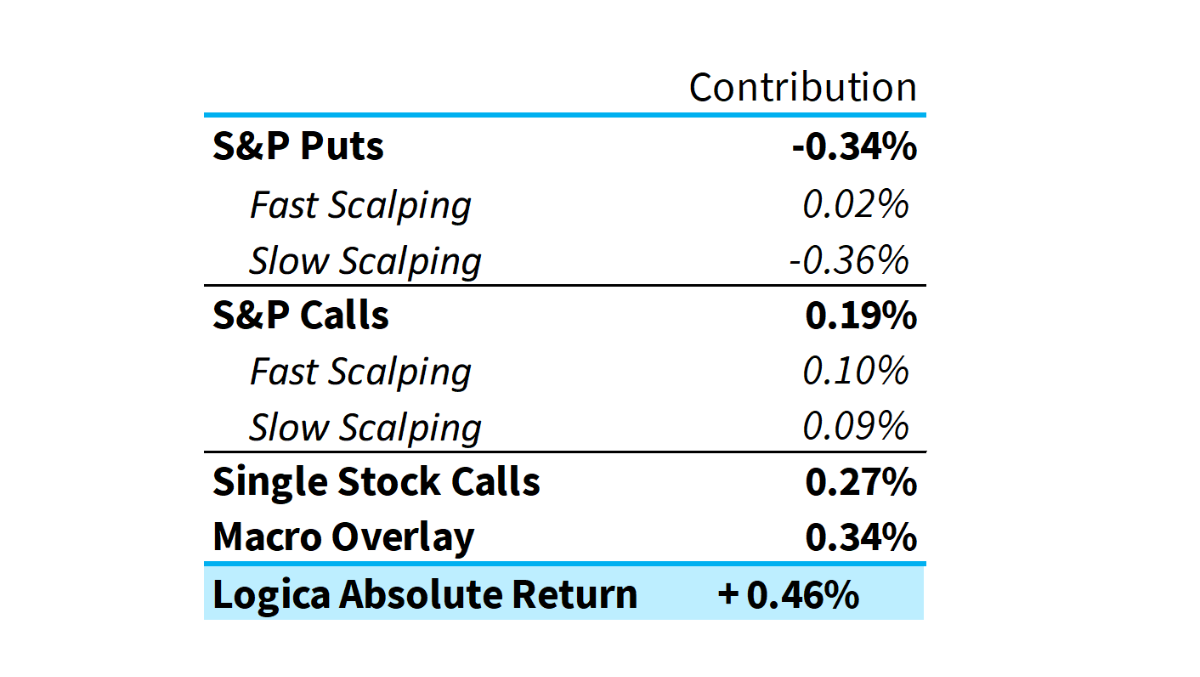
Return Attribution & Portfolio Commentary
Over recent months, we’ve been hammering home the point that as implied volatility deteriorates, this means greater opportunities for long vol exposures like ours (all else equal). This dynamic panned out ideally in April with a +124bps gain (gross) for LAR, and we saw some of these same opportunities play out in May, albeit in a slightly different and arguably more interesting way. While April provided a calm month where long volatility exposures weren’t penalized as much as they were in the prior 12 months, May offered a chance to capitalize on some spikes in implied vol. These spikes were extremely short-lived, and IV immediately deteriorated (more aptly, evaporated) – so provided less tailwind than we would have liked, but still offered us opportunity even as VIX had its new lowest monthly close since 12/31/2019.
“Don’t have to swing hard to hit a home run. If you got the timing, it’ll go.” -Yogi Berra
To provide more insight into this month’s performance, and the more specific output of our models, we’ve broken out our S&P Puts and S&P Calls attribution into the two primary frequencies we trade: fast and slow. The “fast scalping” modules trade nearly daily, and among other qualities they are responsible for monetizing spikes in volatility should our models deem it appropriate (the expectation of a short lived move). We were satisfied to see the fast scalping modules in both puts and calls positive on the month given that VIX - and 30 day S&P 500 at-the-money implied volatility - declined by nearly 2 points (in prior letters we have shown how costly even this mild deterioration can be. Keep this in mind when looking at the “Option Price Decay” chart later in this letter).
Further, our Single Stock Calls provided a boost despite large cap growth/tech/momentum type strategies being negative on the month (Nasdaq 100 -1.2% and iShares Momentum Factor [MTUM] -1.1%). This once again points to the benefits of the factor diversification that we initiated just prior to the 2020 election.
Lastly, after a historically poor Q1 in the performance of gold and long-term bonds, our Macro Overlay (which is also exposed to the US Dollar) is showing signs of steadiness, providing a much welcome return to profitability after the material correction that these “counter equity” assets went through over the course of 2020 and into early 2021.
Looking at our scatterplot, all seems normal. While we were ever so slightly disappointed with the underperformance on the single worst day for the S&P 500 during the month, we feel our positioning into that “event” is a risk/reward tradeoff we would take again. As mentioned above, we were able to monetize some of our long volatility exposure, providing a better than “expected” return on the resulting bounce in the S&P 500 (and concurrent crush of IV). The ensuing few days saw the S&P 500, as well as LAR, rally all the way back while IV ended the short-lived move significantly lower than it started. This is a perfect example of the market bouncing up and down to be flat over a few days, but IV ending up the winner/loser (in this case, the loser). Under these dynamics, we are pleased to have scalped away the vol move while maintaining our relative performance.
Our recently launched Tail Risk Fund, LTR, exhibited similar behavior, and performed nearly precisely as we would expect:
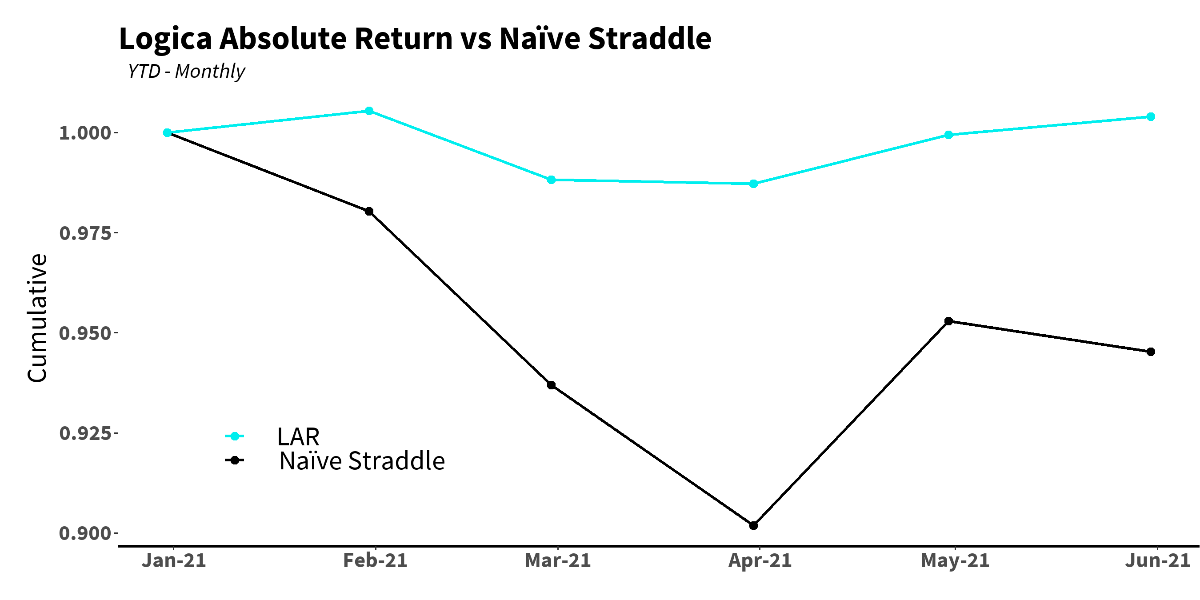
In terms of our reference benchmark, the Naïve Straddle, after a particularly good April, the volatility crush in May led to a continuation of the YTD vol crush horrors:
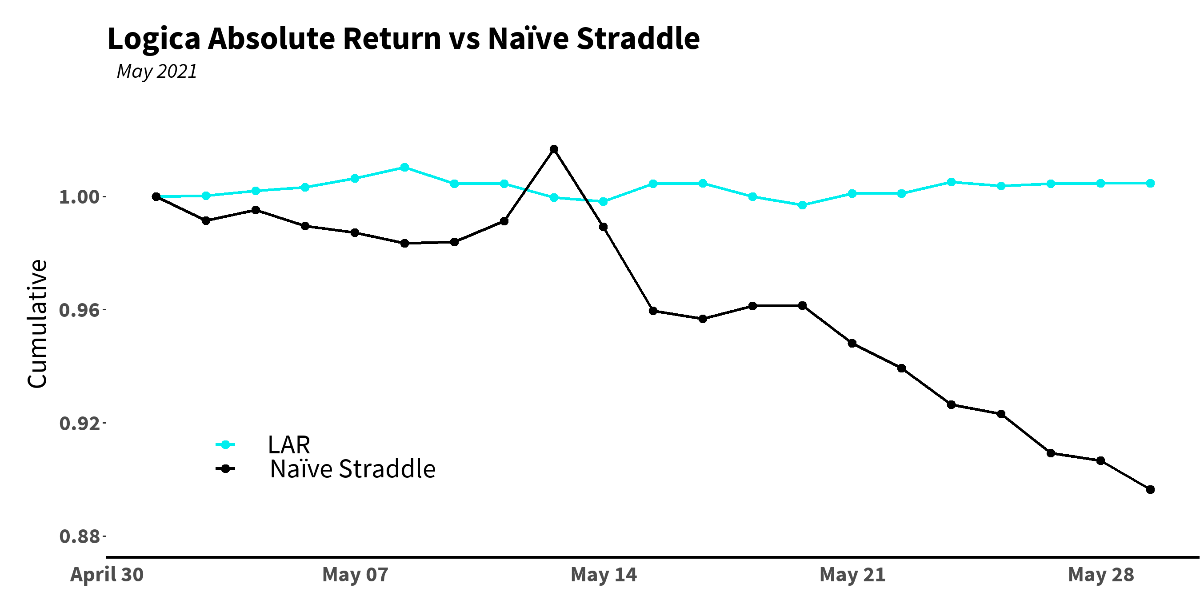
As for May specifically, we can more acutely observe just how large the deterioration was in implied volatility:
“We are our choices.”- Jean-Paul Sartre
The month of May had a handful of spikes and dips in option prices (i.e. volatility of implied volatility), which gives us an opportunity to elaborate on our process and ways of thinking as we trade in the trenches each day. At our core, we are traders, and as such believe that in the volatility space it is exceedingly important to monetize some portion of gains (mean reversion alpha) when uncertainty rears its head. The old narrative “be greedy when others are fearful” is somewhat apt here. Although, we might instead say “be opportunistic when others are fearful.” Which, as traders, drives our desire to bank some of our gains while keeping a reasonable level of exposure (knowing that with a sizeable position in SPX puts at all times, we have capped our downside risk and remain convex to the upside in the event of a crisis).
There are some infrequent exceptions in our models to this monetization “mandate” – which we think of as “red flags.” But so long as no red flags appear, we have a green light to take something off the table – to monetize, to trade.
One might think of this philosophy as long volatility on a macro level while trading volatility on a micro level. Unlike most in the vol space, we of course never short volatility, instead using the tools we have at our disposal to monetize the profits we make resulting from our constant long exposure to volatility. We’ll refer to this colloquially as scalping vega – vega is an option Greek that tells us how sensitive a position is to changes in volatility (a more technical discussion is beyond the scope of this writing). Simply: how much is our position going to appreciate (depreciate) per point rise (fall) in volatility? As we are a “long volatility” strategy, all of our positions have positive vega, and thus, so does our entire portfolio.
When our models see a move in option pricing that is worth monetizing (given that our forecast is for depreciating prices, i.e. a reduction in implied volatility), we have a couple options (bad pun intended):
- We can outright sell some of our existing vega. Since all of our calls and puts have vega, any sale of options we hold will reduce our vega exposure. However – this will likely also change our total exposure as well as our delta profile, and our models might not think it wise to do so (for example, this sale may mean the portfolio going from a medium delta tilt to a high delta tilt, or vice versa).
- Alternatively – or in addition - we can optimize our holdings based on strike and/or tenor without affecting our delta tilt too much. In-the-money (ITM) options have less extrinsic value, so are less exposed to moves in volatility than out of the money (OTM) options, given the same total delta exposure. Options that expire a bit further out on the calendar likewise are less sensitive to sudden spikes/crashes in volatility than options with a nearer term expiry.
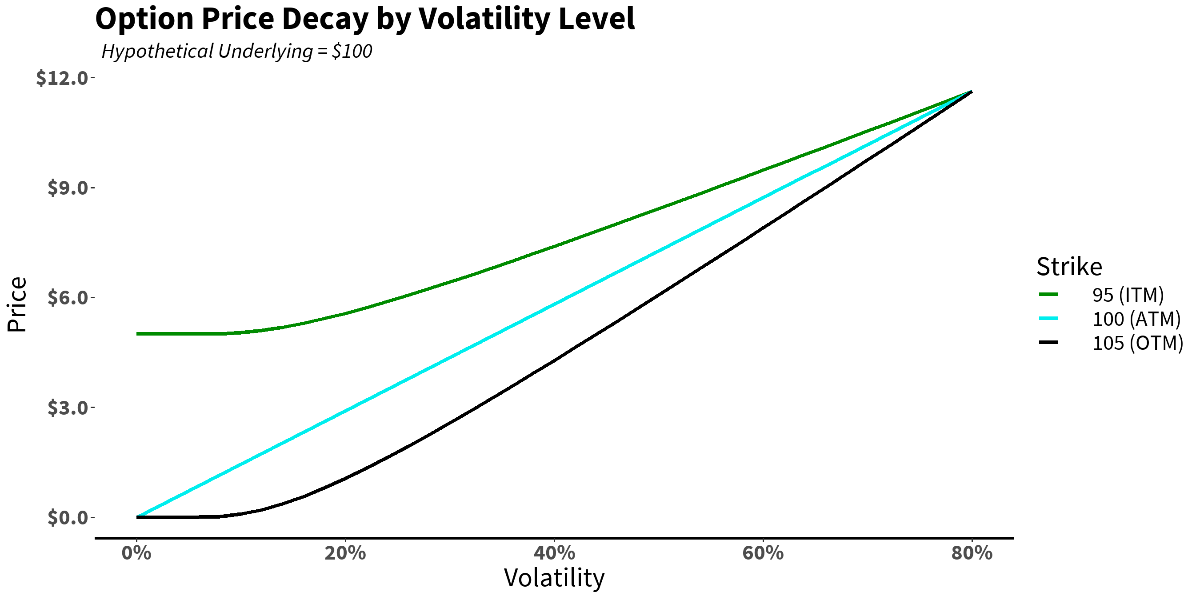
Here’s a look at an option’s price by volatility level. (Technical note: for the purpose of this example, we’ve normalized the prices at the “beginning” 80% volatility level in order to isolate the decay phenomenon. This would be “spending the same amount” regardless of which strike you choose. There are a number of ways to go about showing this, but this method captures our simple point). If we knew for certain that volatility was going to decline, we would prefer the ITM, 95 strike. Of course, there is no free lunch: for the same reason we like the ITM option for its profile in a declining volatility environment, we would generally much rather have the OTM strike given an expectation of rising volatility in the future.
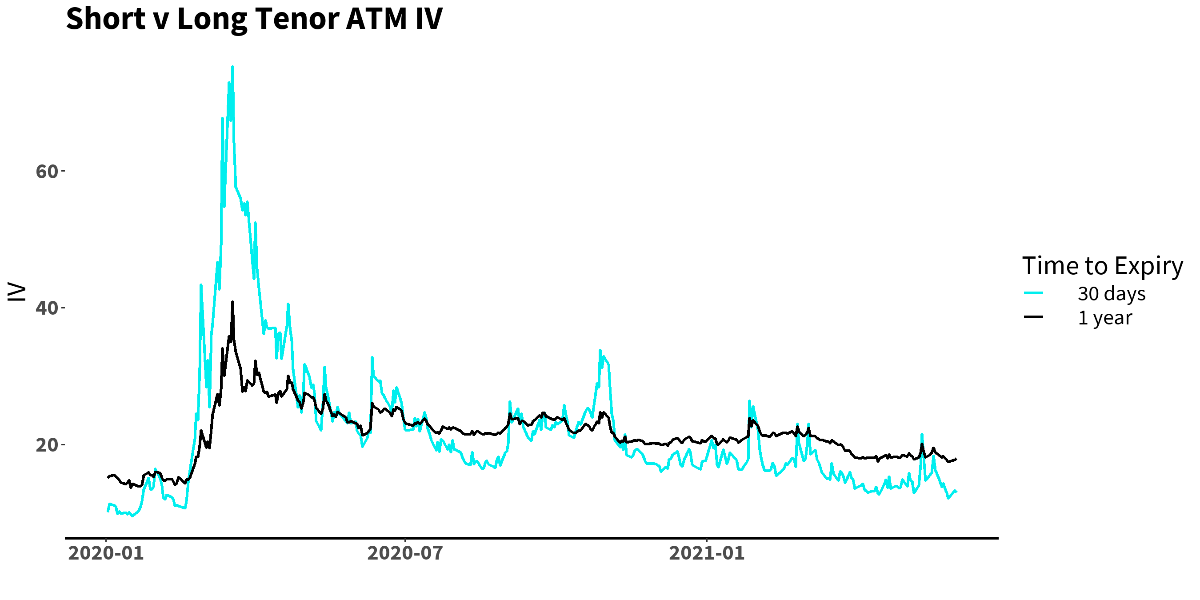
The same is true for tenor: if we know a volatility spike is ahead, we would want a nearer term expiry:
In other words, these are just a few of the things that we, and our models, must consider on a day to day basis while we are in the trenches. The above seems straightforward. But we reiterate that there is no free lunch. When you see a move in implied volatility that seems historically out of whack, you might think “hey, let’s sell this, it’s likely to revert!” You may even look at a graph like this to reinforce your bet:
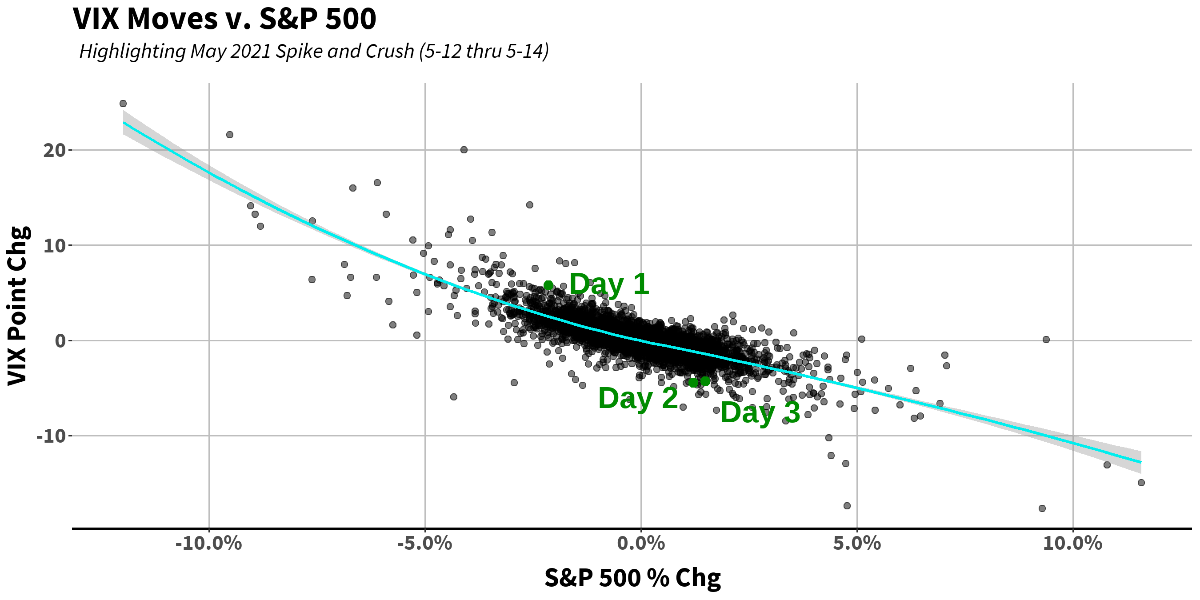
And you’d probably be correct with an exceedingly high batting average on that bet. In May, as we see above, you’d have done quite well. Volatility crushed immediately after the “anomalous” spike on Day 1. In Feb/March 2020, well, not so much:
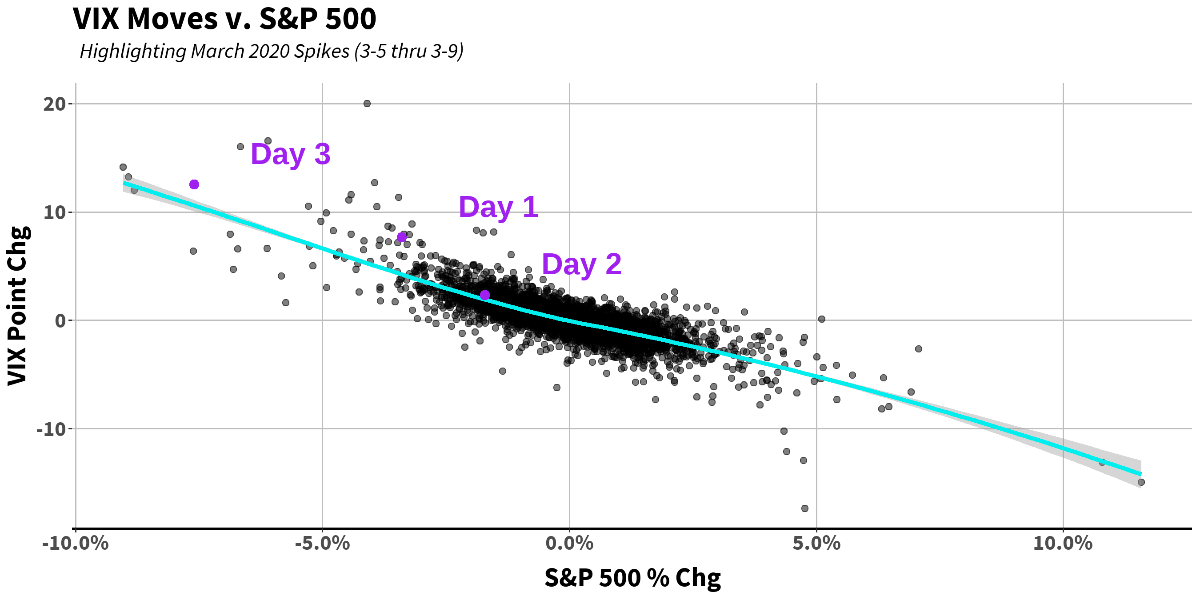
Going through this in a thought experiment: your model tells you the move on Day 1, 3/5/2020 (Thursday) is a giant outlier, so you sell volatility thinking that “volatility is mean reverting” is a reliable truth (well, it almost always is. But almost only counts in horseshoes and hand grenades!). The next day (Friday, Day 2), volatility goes against you and is up again - but just by a couple of points. Nothing disastrous, or at least not enough to change your thesis that vol is “out of whack,” so you stick with your position. Then you wake up Monday, Day 3, to an S&P 500 down more than 7%, and vol up 12.5 points. That is disastrous. This may seem like an extreme example, and it is. But this is the nature of volatility bets: nobody knew what that pending Monday had in store. Moreover, it was an exceptionally low probability event given the historical distribution. The real key, therefore, is in the ability to differentiate between mean reverting and mean expanding.
At this moment, it’s worth a reminder of the typical payoff structure of long volatility exposures: the hit rate will tend to be far lower, but the positive skew far higher (based on our work, since 2015 the monthly hit rate for an S&P 500 naïve straddle, rebalanced monthly, is about 40%. That is, 60% of months lost money). What we care about over time, though, is expected value. To use a baseball analogy: there’s a reason why the “batting average” statistic is now considered basically useless. We don’t care about the percentage of the time someone gets a hit. We care about how many bases he gets when he does so, i.e. the magnitude of his successes. A home run is worth 2.3x that of a single (1)! There’s certainly a happy medium between a player that hits only singles at a high rate, and one that hits only home runs at a low rate. A team full of these “happy medium” players will create a lot of runs – the home run hitter won’t perform very often, but when he does, will have a disproportionately positive impact. The singles only hitter will be consistently getting on base and producing until the home run hitter comes in and knocks one out of the park. At Logica, we aim for a team of alpha modules that don’t slump all at the same time and complement each other’s weaknesses. Some that are singles hitters, and others (notably, convex down-capture exposures) will seem to be a waste – striking out frequently - until finally they come in with men on base and knock one out of the park to save the day.
References
- “Guts! FanGraphs Baseball | wOBA & FIP Constants” https://www.fangraphs.com/guts.aspx?type=cn
Business Update
Last month, we were happy to announce a significant seed investment from a publicly traded insurance company for our Logica Tail Risk Fund LP (“LTR”). We launched LTR with $50mm as of April 1st, 2021 and are now offering both varieties of our strategy in comingled Funds; On/Offshore LPs for the Absolute Return that mimics a Long S&P Straddle, and an Onshore LP for the Tail Risk that mimics a Long S&P Put option. Each of them have different utility for investors, providing an interesting choice to complement the level of risk, and tolerance, that an investor may have in their existing portfolio.
In May, we initiated a full scale improvement to our security and cybersecurity infrastructure. Specifically, we have engaged professionals to survey our weaknesses and/or voids in our systems, and to infuse the relevant technologies to protect our data, proprietary R&D, and trading systems. In today's world of increasing cyberattacks and ransomware attacks, we are excited about these added protections. While some of this has already been put into place, we are adding additional rigor and expect the comprehensive upgrade to be near completion by the end of June.
Logica Strategy Details
Note: We have comprehensive statistics and metrics available for our strategies, but only include a select few to highlight what we believe is our most valuable contribution to any larger portfolio.
- If you would like to learn more about our strategies, please reach out to Steven Greenblatt.
- If you would like to speak with Wayne/the team on our views on Hedge Funds/Investing/Trading and trends we see shaping the industry, please contact Steven Greenblatt at [email protected] or 424-652-9520.
Follow Wayne on Twitter @WayneHimelsein
Logica Absolute Return
2015-2019 stats & grid, reconstitution of live sub-strategies normalized to 16% annualized volatility
2005 to present growth of $1000 chart, simulation
Jan 2020 live
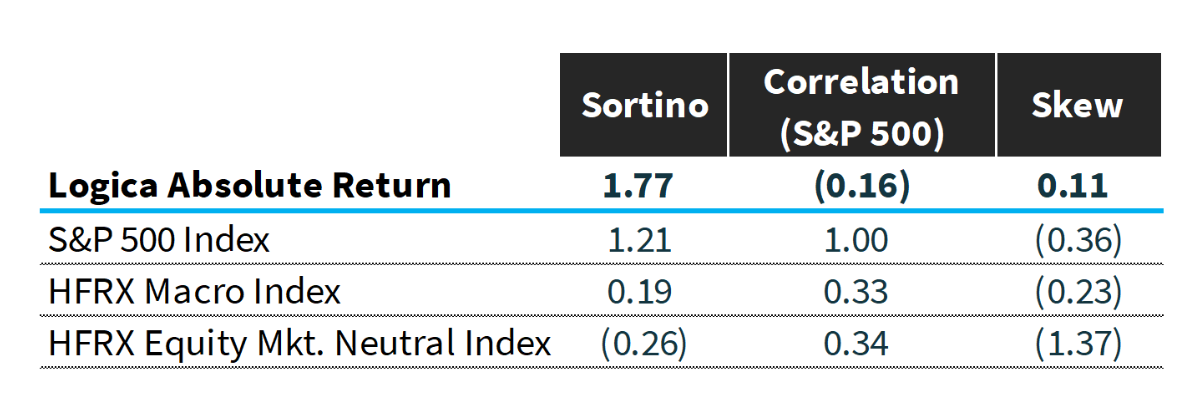
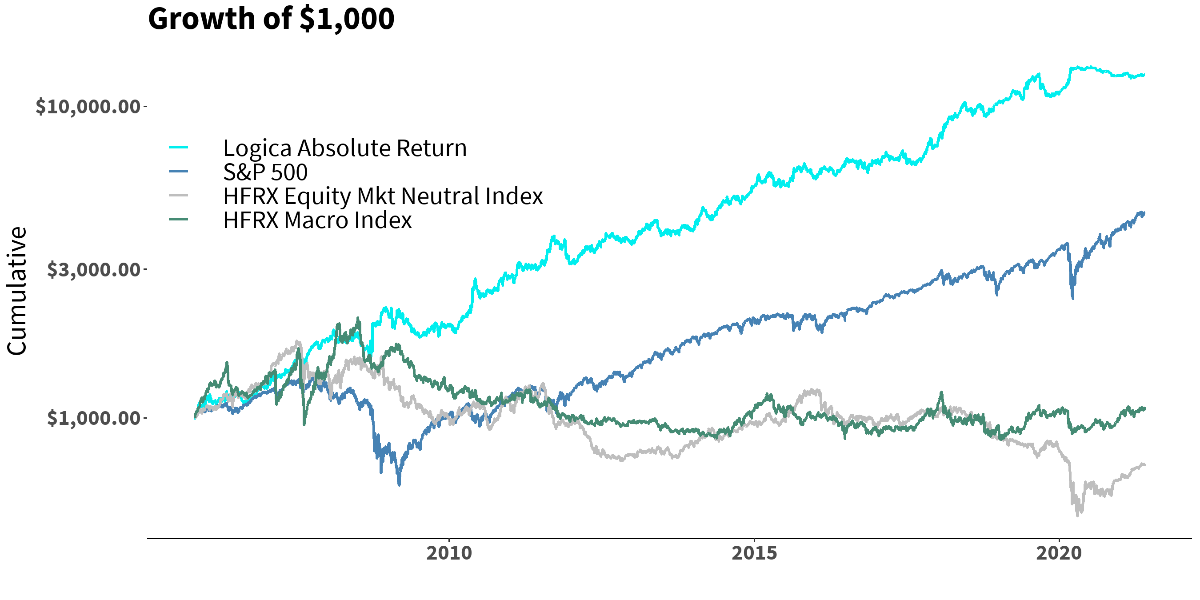
*HFRX Indices have been scaled up to 15% annualized volatility to be comparable to LAR and S&P 500.
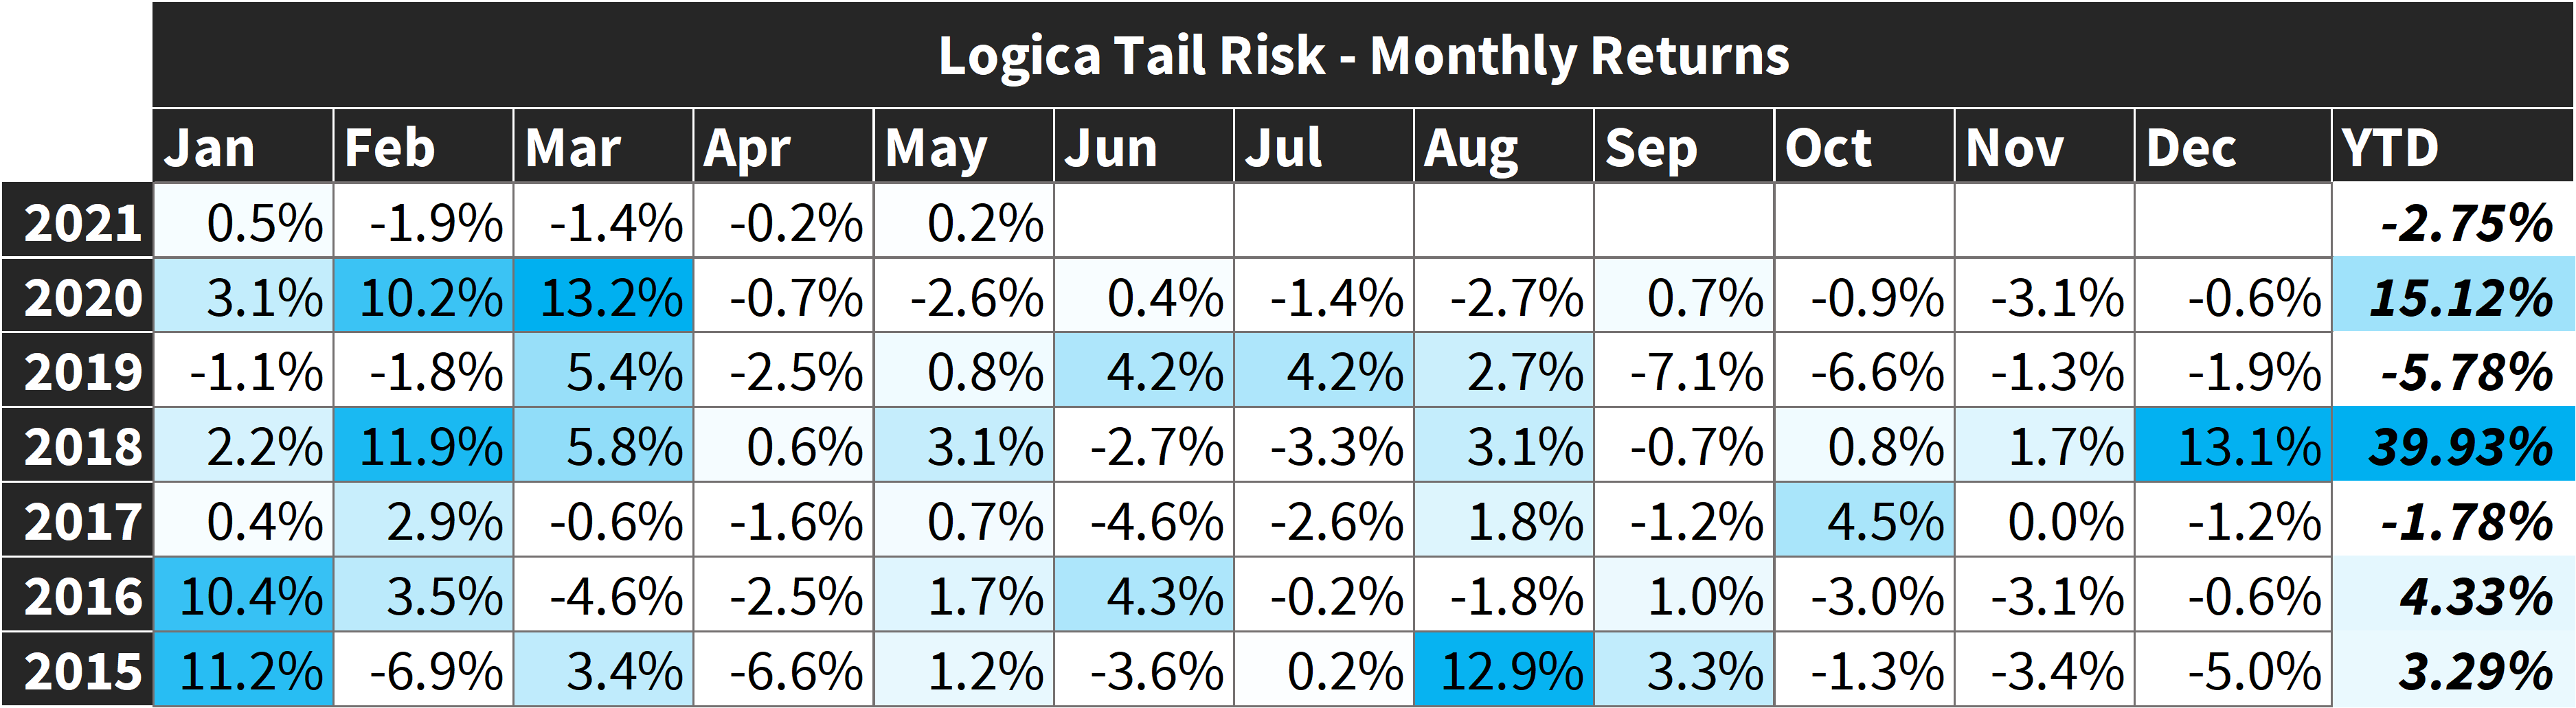
Logica Tail Risk
2015-2019 stats & grid, reconstitution of live sub-strategies normalized to 16% annualized volatility
2005 to present growth of $1000 chart, simulation
Jan 2020 live
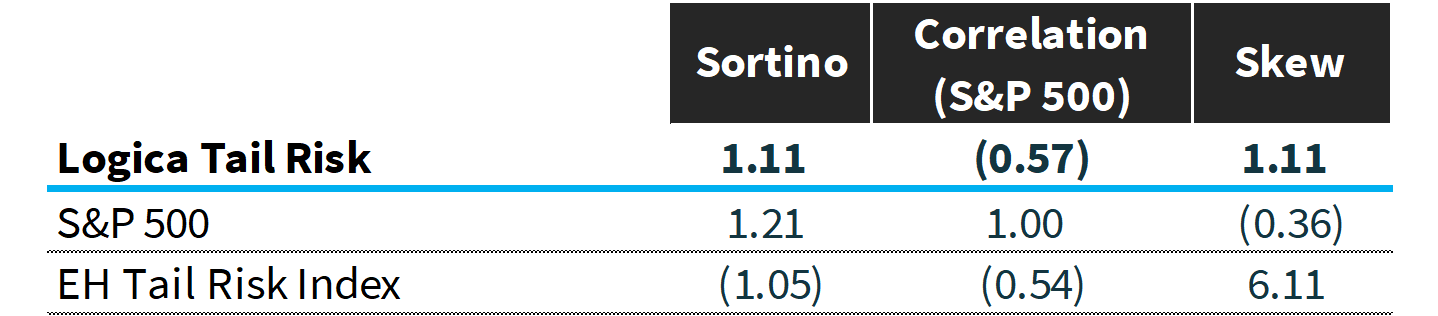
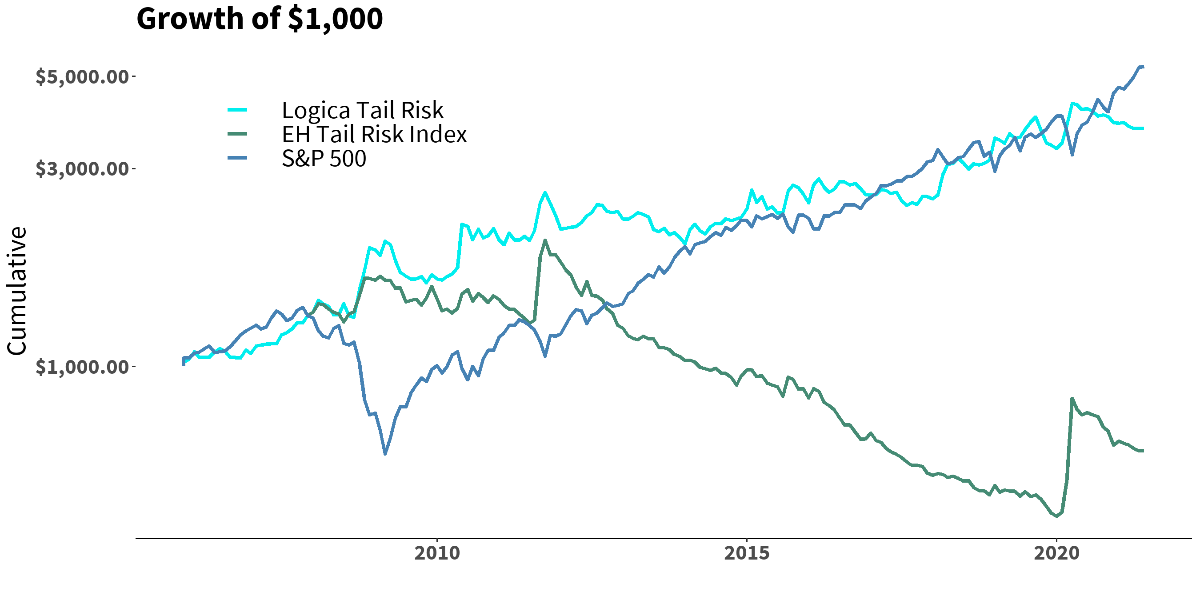
*As of the time of this distribution, the CBOE Eureka Hedge Tail Risk Index had not yet published May 2021 returns. EHTR Index has been scaled up to ~17% annualized volatility to be comparable to LTR.


