Welcome to the first update of the second quarter round of U.S. company financial statements as submitted to the Securities and Exchange Commission (SEC). The Broad Market Index was up 0.40% last week and only 1/3 of stocks out-performed the index. The larger proportion of companies report their second fiscal quarter ended June and most of those reports are expected in the last week of July and first week of August.
Q2 2021 hedge fund letters, conferences and more
Early SEC filing companies are those with fiscal years ended April and fiscal quarters ended May. These are in the population of companies where the virus had a negative impact on all three months of the quarter last year. That makes for a clean comparison.
Projected 10% Jump In Sales Growth
Clean comparisons are showing us that there is a huge rebound. So surprisingly big as to suggest that purchases that were deferred during the virus are being made now. Last quarter sales growth was up at 75% of companies and increased to 8.6% from 5% in the prior quarter.
Recent quantitative analysis of fundamental data heavily suggests that sales growth of US companies will jump above 10% and most companies will report an improvement. The uncertainty lies in the direction of the profit margin.
Last period profit margins decreased on average but improved more frequently across the market. The average margin decline was caused by steep drops in the profit margins of companies dealing with the lingering effects of the virus.
Inflation Will Not Be Temporary
This quarter will be the true test for the broad population of US companies. Input costs are broadly up. Oil prices have doubled and will double again in the coming year. Commodity prices are up and supply chain disruptions are creating shortages and price spikes.
If companies pass these rising costs on to consumer as higher prices, gross profit margins will rise both on average and more broadly as the global pricing power of US companies is demonstrated. The recent advance in measured inflation will not be temporary.
Super Accelerating Companies
At the broad stock market level sales growth is up on average and more frequently, gross profit margins are up at most companies and rising more frequently. With the broad population of companies improving, it is time to deploy super accelerators.
Super accelerating companies typically have high levels of operating and financial leverage and are often in the pay-off stage of their capital expenditures cycle (large golden pot for the MoneyTree).
Search for companies with rising sales growth. This is dark truck of the money tree. The level of sales growth is less important at this stage of the recovery cycle so short trunks are ok if the color is not red.
Make sure that both the gross profit margin and the operating profit margin are both up. Fixed costs are easier for the company to manage lower if sales growth is up, so a falling operating profit margin is a very bad metric for a rising sales growth company.
Growth Strategies?
Margin direction is particularly important for growth strategies. High growth will not protect portfolios. Only shares of rising growth companies will perform well in the coming higher inflation – higher interest rate world.
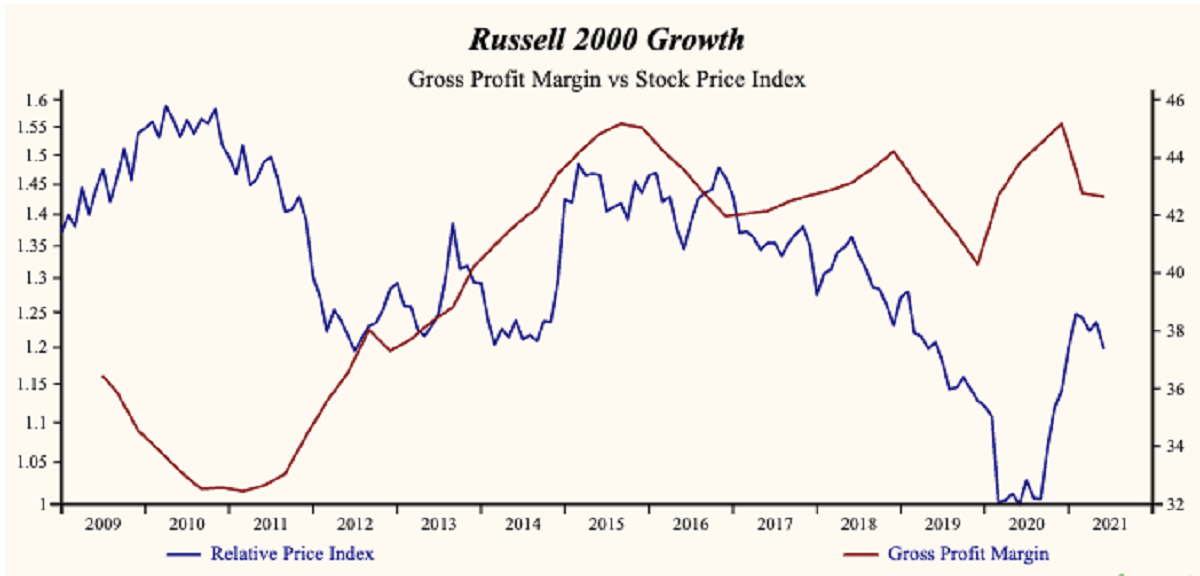
Russell 2000 Growth Index ‘Q1 Recap
Tuesday, July 6, 2021: The share price index of the Russell 2000 Growth Index has advanced by 19% relative to the Otos Total Market Index since the June, 2020 low. Current relative price to sales is near the lowest level in the record of the Index.
Last week the share price index of the Russell 2000 Growth Index fell by 1.7% compared to a 1.6% advance for the Otos Total Market Index. Gaining stocks in the Russell 2000 Growth Index numbered 130 or 38.3% of the Index total compared to a 20.8% gaining stocks frequency across the 3,979 stocks in the Otos U.S. stocks universe.
We have collected first quarter 2021 sales data for 336 of the 339 comparable record companies in the Russell 2000 Growth Index representing 99% of the capital value. The Index capital weighted average sales growth rate is 5.4%. The proportion of Index market capital accounted for by rising sales growth companies is up to 68.5%, compared to 51.9% last quarter.
Currently, sales growth is low in the record of the Russell 2000 Growth Index but higher than last quarter. The proportion of total market capital accounted for by rising gross profit margin companies is up to 65.2% compared to 58.5% last quarter.
Low Quality Growth Trend
The Index is recording a high and falling gross margin. Inventories are down, improving the chance of a future increase in the gross margin. SG&A expenses are high in the record of the Index but rising. That implies that the Index may be capable of accelerating EBITDA relative to sales with lower costs but has yet to achieve a cost reduction.
Lower gross margins and higher SG&A expenses are producing a deceleration in EBITDA relative to sales. Interest costs are high in the record of the Index and rising. Higher interest costs not only slow cash flow growth but are often associated with lower valuation.
How to Spot a Winner!
A quality buy pattern requires:
- Low & flat to rising gross margin
- Higher sales growth
- High & flat to falling SG&A and interest costs
- Falling inventories & receivables
- Depressed share price
- Depressed valuation