The unspoken behemoth in world markets continues to be the United States bond market, which is gathering momentum downward in a sign of having solidified a long-term generational top. Following the failure of the parabolic curve shown below that was first brought to readers’ attention in late-2016, US bond yields continue to surge across the spectrum, with the media’s headline being that the 10-year bond is now costing the US government over 3% per year for the first time since 2011. Bond prices move inversely to interest rates. We prefer to chart the price for the longest-duration US government debt in existence, the 30-year bond, as it is the least sensitive to the Federal Reserve’s various schemes for meddling with interest rates.
Bonds Threaten Generational Breakdown
What is not being said in the mainstream press is that the critical technical test that is now underway in the US bond market: the long bond is testing the lower boundary of a generational-length 37-year rising parallel channel, the breaking of which will usher in a period of sustained rising rates for the first time in modern finance:
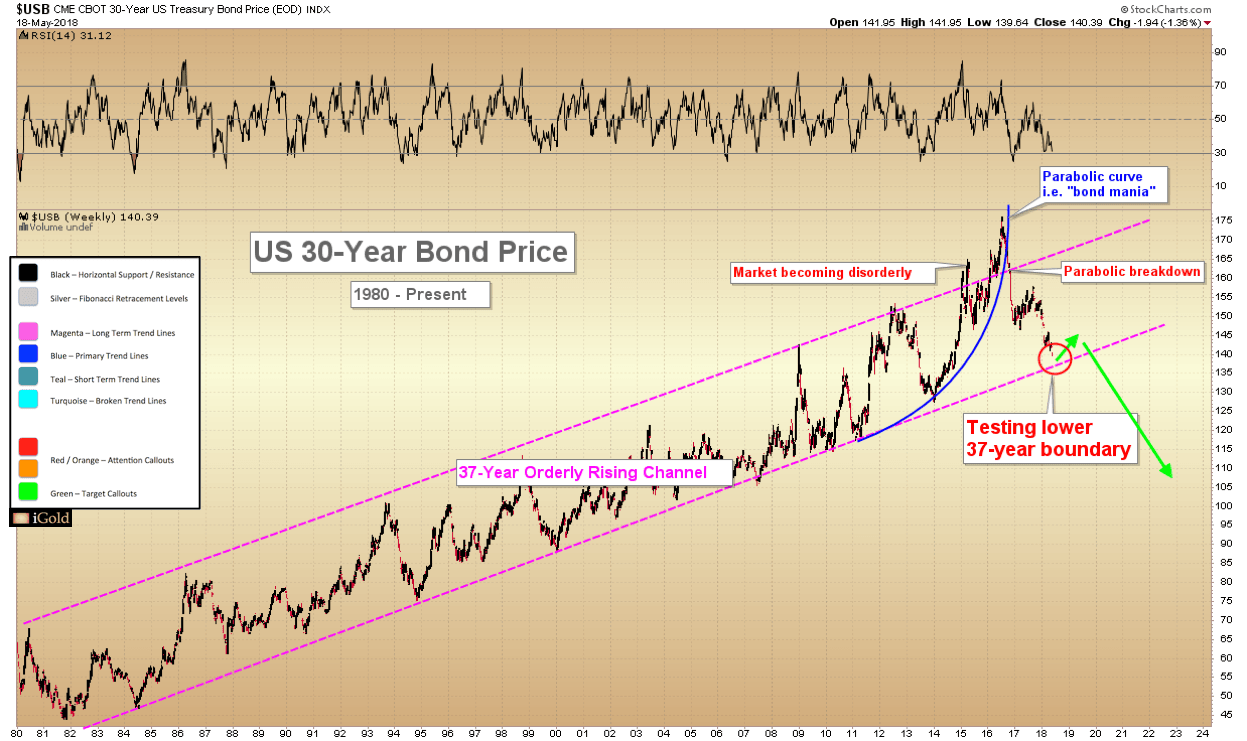
Closing at 140.39 for the week, the 30-year is within three points of the lower boundary of its orderly rising channel, a trend which has seen fixed-income buyers show up at increasingly-higher intervals every several years since 1981. Will those ever-bullish bond buyers appear again over the coming weeks to scoop up the continued issuance of unprecedented levels of US debt? Or will this mark the first time in over a generation that bond investors don’t show up, and the bond price prints a lower-low below the rising trendline? If so, this will be a key technical signal of a long-term trend change.
Our analysis is that several technical signatures suggest a market top has already occurred after the long-term advance (all labeled above):
- a disorderly advance following the linear trend
- a parabolic curve which subsequently broke
- a rapid initial decline
The last signature we are now waiting for is a break of the lower rising parallel trendline.
Bond Market Key to American Economy
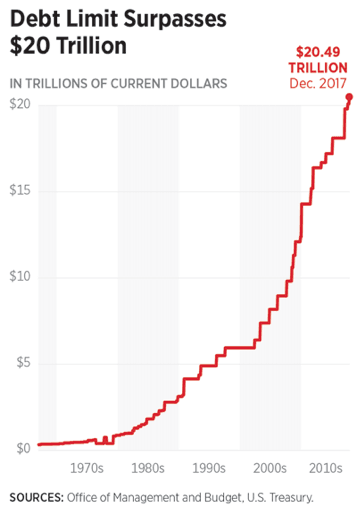
Let us not underestimate the importance of low borrowing rates for the largest debtor nation in the world. With deficits now approaching 2009 credit crisis levels and total debt rising nearly vertically, the nation’s military, social programs, and infrastructure all depend on the continuous issuance of bonds. An important thing to note is that the US spends more on its military than the next seven largest countries combined.
Is it possible that Chinese or Japanese investors will appear as they regularly have over the past three decades to support US debt? Yes, and for this reason, we suspect that a bounce is due for US bonds in the region above 137 on the 30-year bond chart (green arrows, first chart). A meaningful bounce could last anywhere from 6 – 18 months before we expect downward pressure to resume again. However, the bigger picture shows us that something is not healthy with the appetite of investors for this new US debt. Recent media reports have said that there is nothing to be concerned about over 3.0% yields on the 10-year note fail to place the rate increases in proper context. An equal-length period of 37-years of falling bonds and rising rates may be just beginning.
Will the Federal Reserve Step In Again?
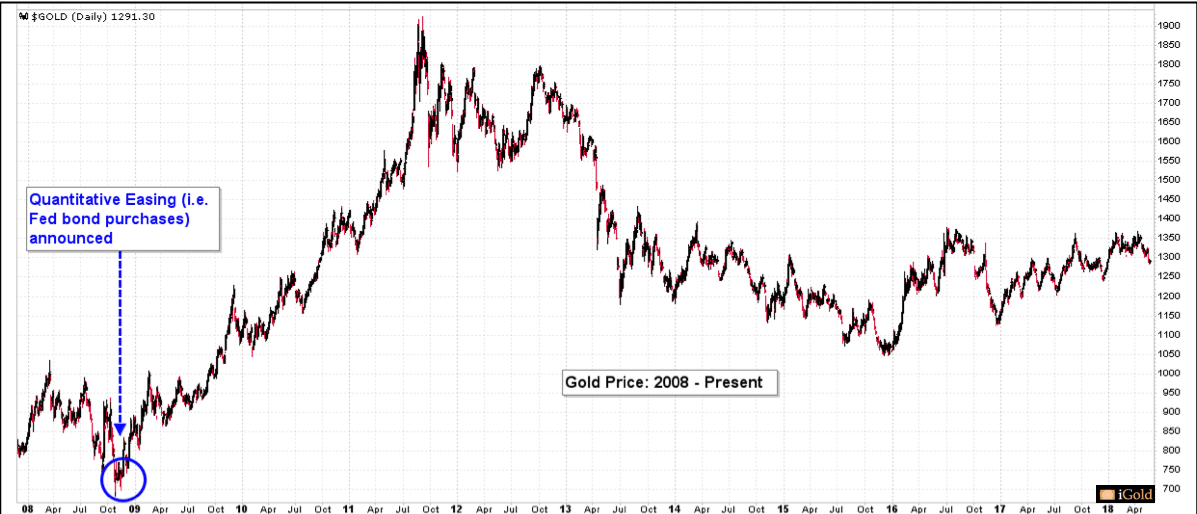
Government debt projections are based on current interest rates. Amidst falling bond prices and rising yields which will surely impact the ability of the government to fund its operations, will the Federal Reserve become the “buyer of last resort” with freshly-printed money (aka Quantitative Easing)? Let’s recall the last time that such a desperate measure of fabricated bond buying was announced by the Fed and its subsequent impact on the gold market:
Bond weakness and rising rates will impact all Americans and by extension all citizens of western democracies. As we saw in the crash of 2008, no country is immune from the challenges that face the United States. We must watch the 30-year bond chart closely for signs of a break in the 37-year rising trend. When this trend breaks, who is going to step in?
Christopher Aaron
Bullion Exchanges Market Analyst
Christopher Aaron has been trading in the commodity and financial markets since the early 2000’s. He began his career as an intelligence analyst for the Central Intelligence Agency, where he specialized in the creation and interpretation of pattern-of-life mapping in Afghanistan and Iraq. His strategy of blending behavioral and technical analysis has helped him and his clients to identify both long-term market cycles and short-term opportunities for profit.
This article is provided as a third party analysis and does not necessarily matches views of Bullion Exchanges and should not be considered as financial advice in any way.


