Back in 2017, I made a bet with Warren Buffett and my friends Carl over at 1500Days and Ben at Suredividend. Buffett does not know that I made a bet with him however.
Q4 2020 hedge fund letters, conferences and more
Inspiration Behind The Bet With Warren Buffett
This bet was inspired by Buffett's now famous bet with a Hedge Fund manager. The bet was that no hedge fund manager can do better than investing in S&P 500, because of their high fees. Needless to say, Buffett won the bet, and donated the proceeds to charity.
Inspired by Buffett's bet, I did my own bet with Carl. I am afraid that Buffett is unaware of this high stakes bet, but I wanted to proceed with it for educational purposes.
A lot of people do not understand the reason why Buffett won the bet with the hedge fund manager.
The reason the hedge funds failed the bet is because of their huge fees. A typical hedge fund charges a 2% annual fee on assets under management plus 20% of profits earned on the investment. These fees serve as a huge drag on performance.
Historically, a diversified stock portfolio has earned a total return of 10%/year. This figure includes dividends and capital gains. If you paid a hedge fund manager to earn than return for you however, you would have to subtract 2% for their recurring fee and 2% for their performance fee. The performance fee is calculated by taking the the 10% return, and multiplying it by 20%. This means that you would lose abut 40% of your returns to hedge fund fees, each year, and that's before taxes. In order for the hedge fund manager to generate a return of 10%/year after fees, they would have to outperform S&P 500 by over 4%/year and earn over 14%/year.
This is incredibly difficult to achieve in the long run, as few investors have been able to do that.
The Great Performance Of The Best Investors
Check chart below on the performance of the best investors and the length of their great performance:
In a previous article (Keeping Investment Fees Low Matters), I discussed how these excessive hedge fund fees rob investors of their returns, even if the hedge were to do very well. The problem is that most of these excess returns would go to the hedge fund, rather than the investors who are taking all the risk and coming up with all the capital. Investor Terry Smith had calculated that If you had invested $1,000 in Berkshire Hathaway in 1965, your investment would be worth $4.3 million by 2009. Buffett’s company compounded your capital at 20.46%/year.
If Warren Buffett had set up Berkshire Hathaway as a hedge fund however, he would have charged you 2% per year and gathered 20% of any annual gains. If you had the same performance numbers, your $1,000 would have only grown to $396,000 by 2009. Only $396,000 would belong to you, the investor. This means that of the $4.3 million that you would have earned without fees, $3.9 million would belong to the hedge fund manager. This of course is the result if your hedge fund manager had a performance that is as great as Warren Buffett’s. Most hedge funds do not generate good returns for investors. They only generate good returns for the hedge fund managers, because of their outrageously high fees.
That brings me back to my bet with Buffett and Carl.
I believe that noone knows in advance what the best performing investment over the next decade would be. You can control what you invest in however, your costs, your behavior.
Investing Misconceptions
I am doing this bet to educate investors, who may have a lot of misconceptions about things.
If you choose an investment that is different than another investment, their results will vary over time. If you chose a portfolio of international companies, I would do better or worse than a portfolio of US companies. So if I choose a portfolio of 30 companies, I may end up doing better or worse than a portfolio of 500 companies. We do not know which portfolio would do better in advance. All we can do is keep costs low, keep turnover low and stay invested.
At the end of the day, you have to pick investments that you will be able to stick to through thick or thin. Whether it is a collection of stocks picked by an index, or a collection of stocks picked by you, you have to be a picker and make a choice. When index investors pick US index fund over International index funds, they refer to it as asset allocation. If I chose to own more US stocks over international stocks, they call it stock picking. You can see that index investors are indeed stocks pickers, whether they admit it or not.
Many index investors view the selection of your own stocks as active, while their selection of an index fund as passive investing. Yet by engaging in an active decision to own US or International stocks, or go the route of slicing and dicing funds by market capitalization and value/growth criteria, they are engaging in stock picking as well.
The nice thing about owning stocks directly is that you can afford to do nothing, and have a very low turnover and a very low cost. With index funds, you have forced turnover for various reasons, including an indexing committee actively deciding whether to add or remove a security. This may increase direct costs, and opportunity costs as well.
Back at the end of 2017 I decided to test my assumptions and knowledge, and select a group of companies that would do better than S&P 500 during the next decade. I essentially made a bet that the passive list of companies in the Dow Jones Industrials average as of December 2017 would do better than the active list of the companies in the S&P 500. At the end of the day, this portfolio is more passive than the passive index S&P 500.
Investing In Index Funds
Before we go any further I just wanted to tell you that Carl is winning this bet so far. He's one of the best investors I know, and he invests in a very different way than I do. His portfolio is up by 73%, while mine is up by 37.98%, vs 48.24% for S&P 500.
Carl is a great stock investor. The problem is that he has allowed to be convinced by others that he is going to be mediocre in the future. As a result, he has been selling stock in companies, and buying index funds with the proceeds. But the stock he has been selling has done much better than the index funds he has been buying. If Carl wins this contest, he may realize that he has squandered millions of dollars in potential returns by selling the best companies in the world, and buying investments that didn't do as well.
My friends at SureDividend had selected The Dividend Aristocrats ETF (NOBL), but it was up by 33.02% since the end of 2017 through the end of 2020.
I calculated these results using the total returns calculator at dividendchannel.com.
For my strategy, I decided to focus on solid blue chips, from a strategy that has been around since 1896.
Basically, I selected the 30 companies from Dow Jones Industrials Average.
I decided to equally weight the companies at start, and to "never sell them". I keep all spin-offs, reinvest all dividends, and keep costs low ( you can achieve that using a commission free brokerage and investing through a retirement account such as a Roth IRA)
This portfolio has been inspired by a few pieces of research I have shared before. You may check the research by clicking on the links below:
The main inspiration behind the idea for this passive portfolio of blue chip companies stems from the concept of the coffee can portfolio.
Stocks that leave the Dow tend to outperform after their exit from the average
My analysis of the Corporate Leaders Trust - A passive portfolio of 35 blue-chip stocks selected in 1935
How investing in the original 500 securities of the S&P 500 index in 1957 actually did better than S&P 500
Wow, that's a lot of words to discuss this idea.
2020 Performance
So how did we do in 2020?
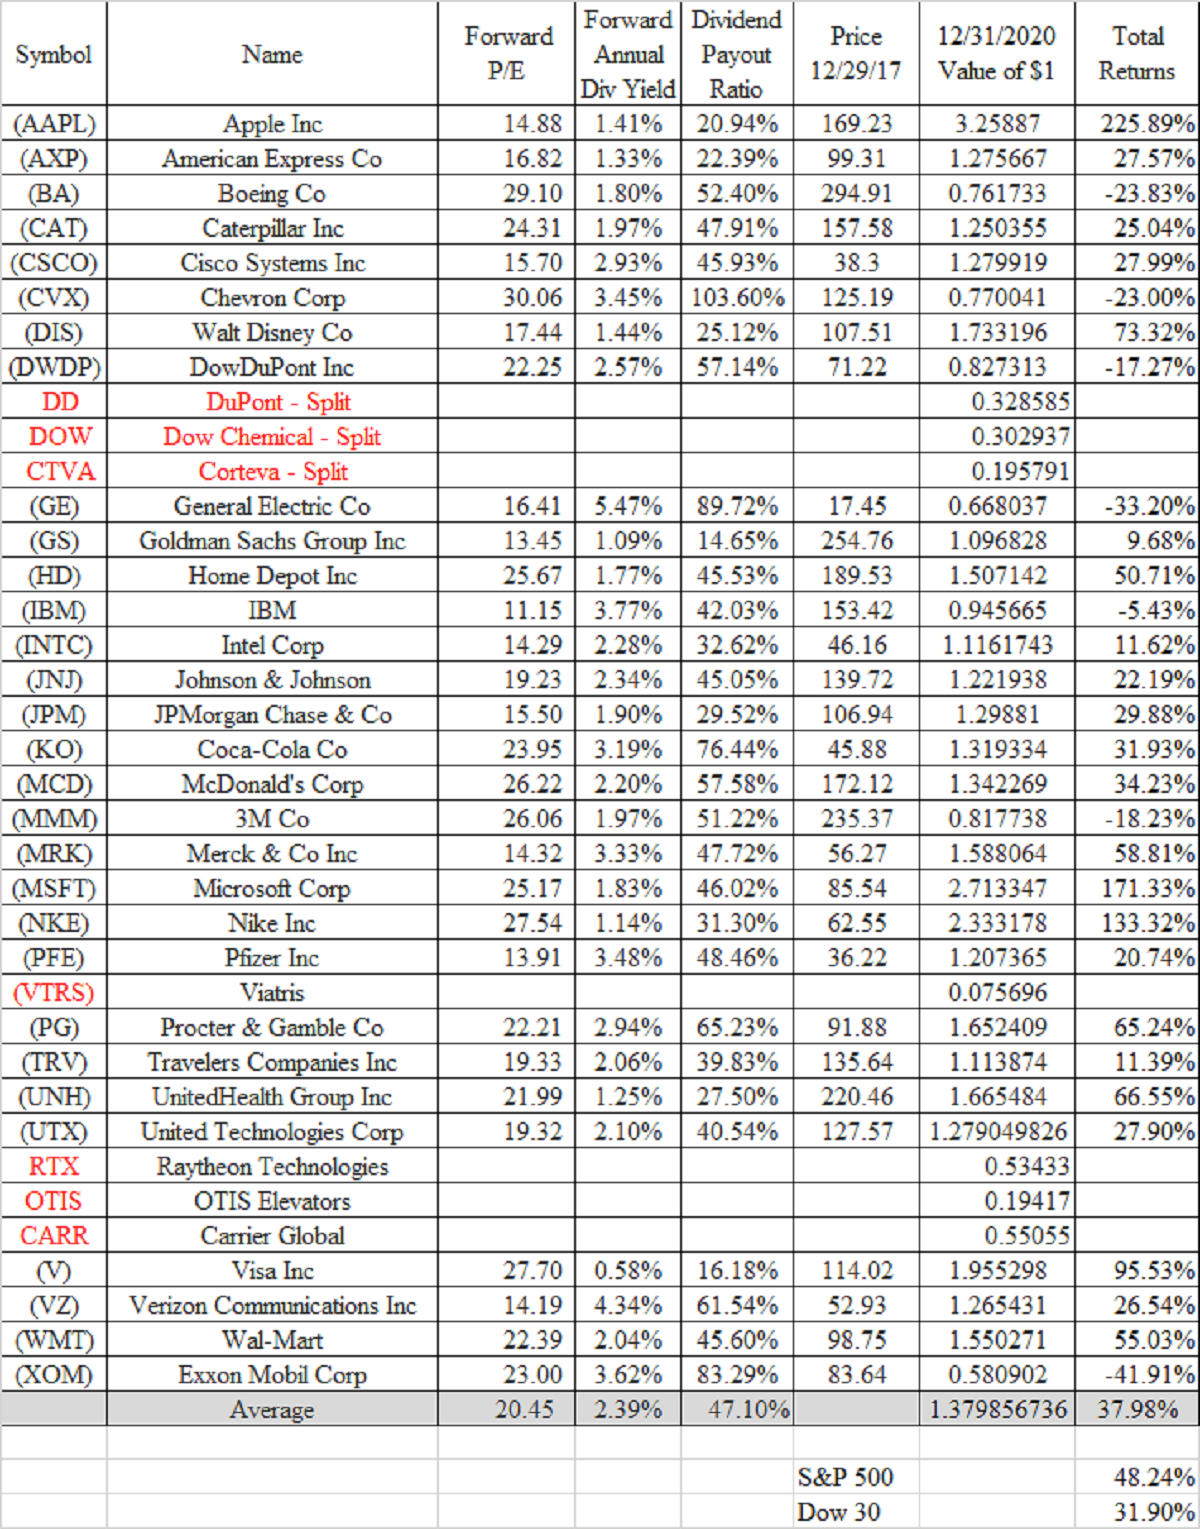
The portfolio has generated 37.98% in returns since inception on December 29, 2017. This is lower than the return on S&P 500 for the same period, which was 48.24%. Dow Jones 30 has returned 31.90%.
This is a fun portfolio to calculate, because of the spin-offs.
This year we had United Technologies (UTX) spin--off Otis Elevator and Carrier Global, before acquiring Raytheon (RTN), and changing its name to Raytheon Technologies (RTX).
We also had Pfizer do a spin-off as well.
All of this activity has increased the number of companies in the portfolio to 35, up from 30.
It looks like the best performing company is Apple, while the worst performing company is Exxon.
The companies that had a P/E above 20 in late 2017 have returned 40.31% on average
The companies that had a P/E below 20 in late 2017 have returned 35.66% on average.
It would be interesting to see how this portfolio performs through the end of 2027, which is when this bet is off.
Relevant Articles:
- My Bet With Warren Buffett
- My Bet With Warren Buffett – Year One Results
- My Bet With Warren Buffett - Year Two Results
Article by Dividend Growth Investor


