AlphaClone performance update for the month ended May 31, 2018.
May saw small cap stocks in the US come roaring back with the Russell 2000 returning an impressive 6.07% vs. 2.41% for the S&P 500. US markets faired much better than international as contagion fears from political turbulence in Italy and the specter of a tariff fight griped international markets. The MSCI World Index ex-US returned -2.33% while the MSCI Emerging Markets Index returned -3.58%.
Q1 hedge fund letters, conference, scoops etc, Also read Lear Capital: Financial Products You Should Avoid?
High beta/growth stocks continued to dominate value stocks in May. In the US, Information Technology was by the far the best performing sector for the month returning 7.37% followed by Energy and Industrials each returning 3%. The worst performing sector in May was Telecom Services returning -2.28% with Consumer Staples, Utilities and Financials also negative for the month.
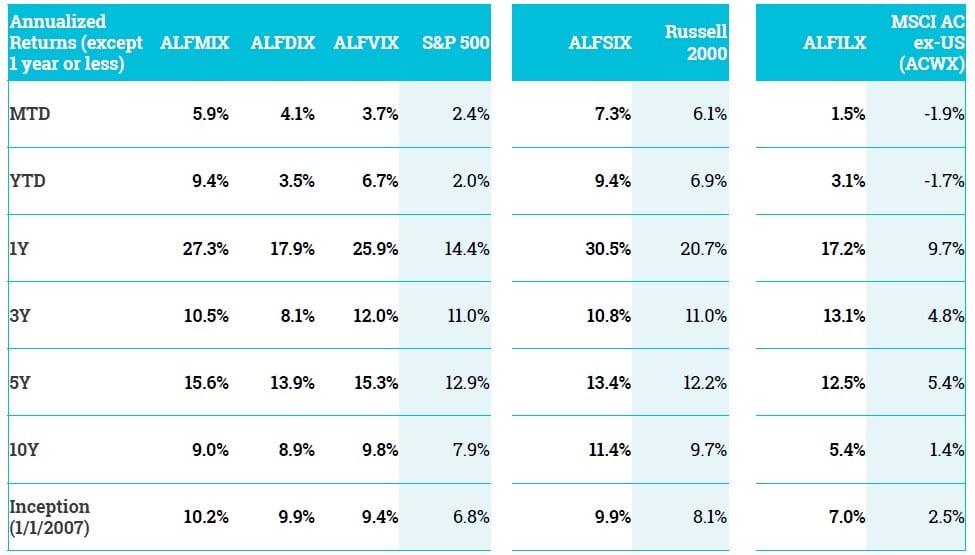
All AlphaClone indexes outperformed their respective benchmarks for the month and remain ahead on both a YTD and 12-month trailing return basis ended May 31, 2018. In line with the strong performance for small cap stocks in May, our AlphaClone Small Cap Index returned 7.3% for the month putting it on par with our Hedge Fund Masters Index as the best performing indexes so far this year with a return of 9.4%. Our value, international and activist indexes are also out performing so far this year.
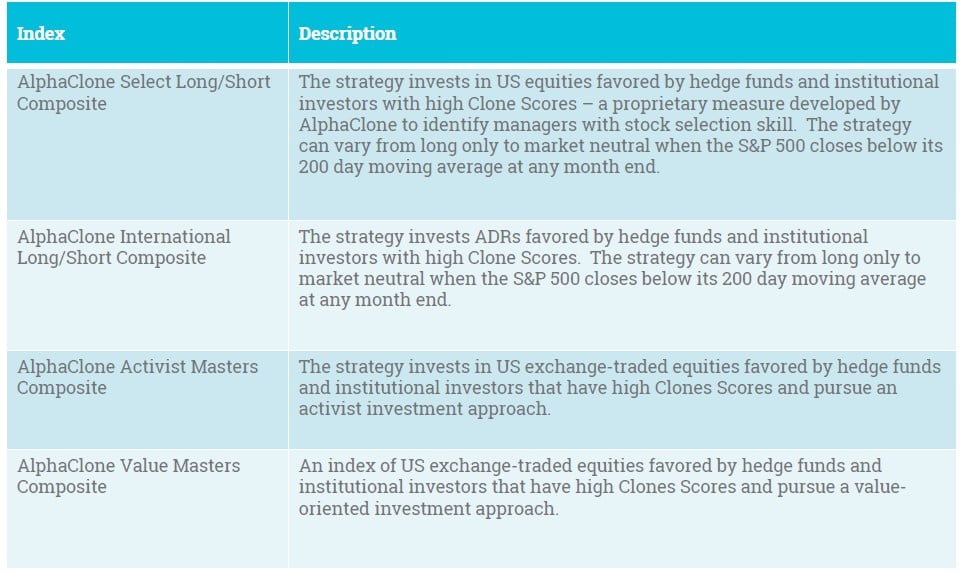
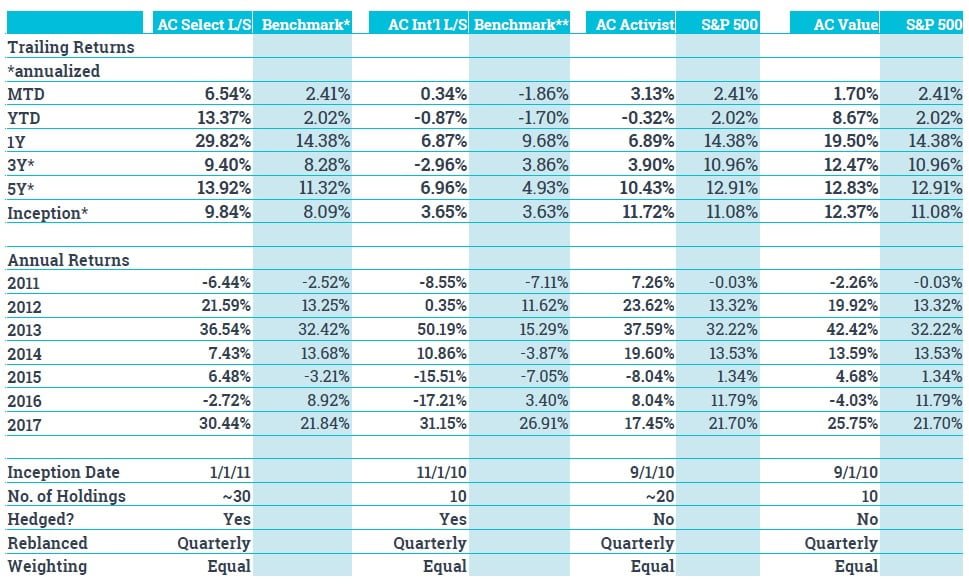
In terms of AlphaClone strategies available to clients in separately managed accounts (see slides 5 through 7), our AlphaClone Select composite continues to impress with a 6.54% return for the month and a return of 13.37% so far this year, net of the maximum wrap fee of 1.5%/year. Our AlphaClone Value Masters composite has also done exceptionally well with an 8.67% return on the year.
AlphaClone Active Indexes
Index Performance May 2018
AlphaClone SMA Composites
SMA Composite Performance (net) May 2018
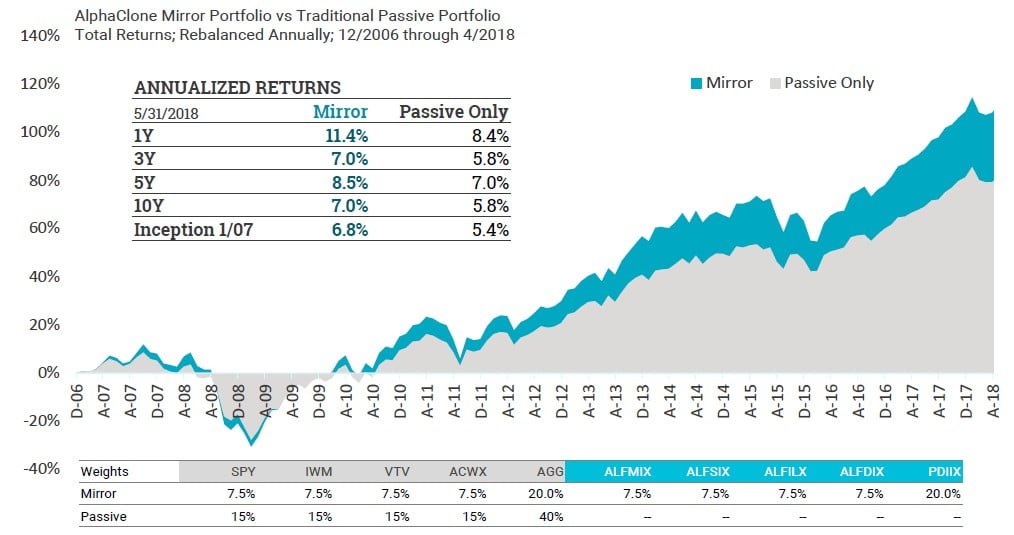
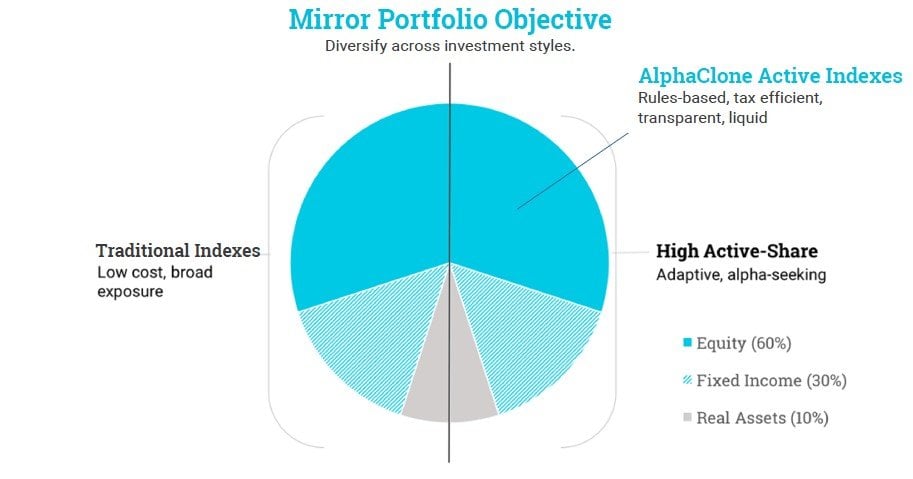
AlphaClone Mirror Portfolio
Mirror Portfolio Benefits
Use active indexes to diversify your investment style exposure while avoiding the inefficiency and high fees of traditional active funds.
Allocating to active indexes can improve your portfolio’s long-term results
Controlling costs is one of the most important determinants of investment success
The table below summarizes the average fees for a model moderate risk portfolio that invests $500,000. Fees for the average traditional advisor and fund expenses comes from the 2016 InvestmentNews Financial Study of Advisory Firms, a survey of 500+ RIAs. Fees for Betterment come from an analysis conducted by Investor Junkie.
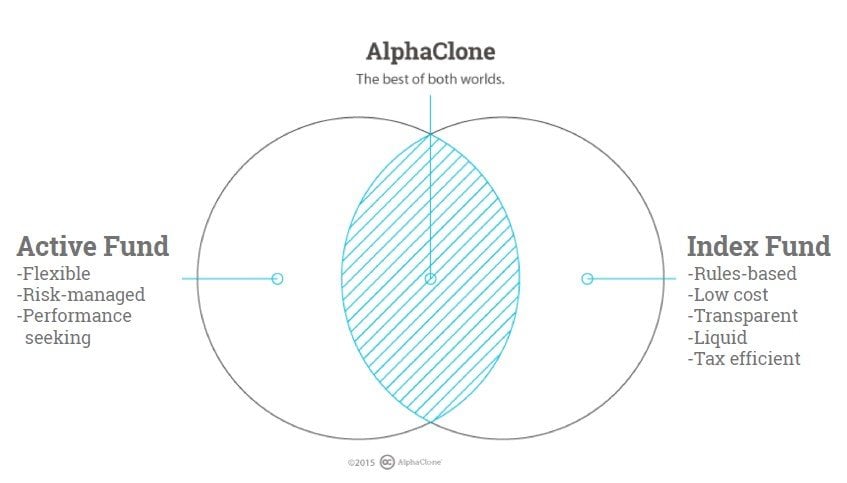
What is an active index?
Active indexes offer the benefits of index funds while still seeking to outperform the overall market
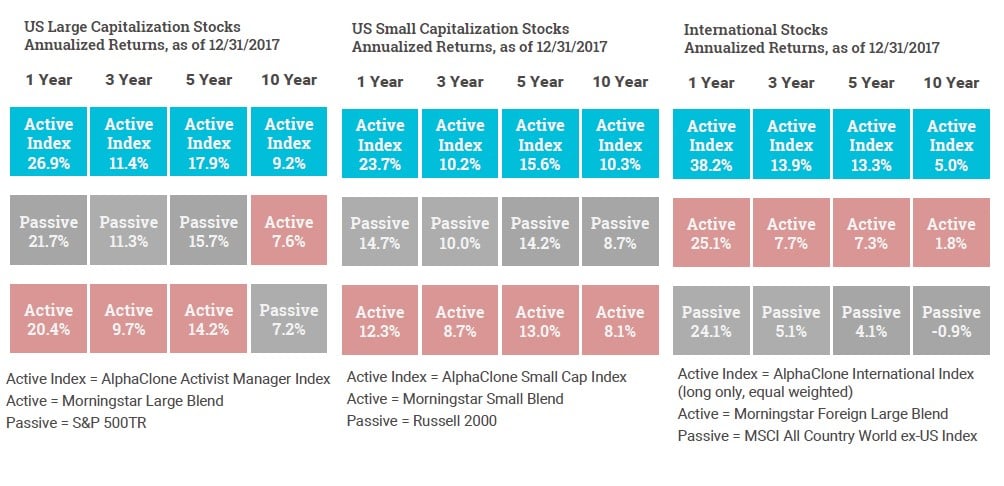
Active indexing has outperformed both the market and traditional active funds
See the full PDF below.

