
For weekend reading, Gary Alexander, senior writer at Navellier & Associates, offers the following commentary:
The first estimate for U.S. Gross Domestic Product (GDP) for the first quarter of 2023 just came out last week, and it was an anemic +1.1%, par for the course for the Biden era, and for our post-9/11 world.
In last Friday’s “Review & Outlook” section, The Wall Street Journal editorialized (in “The Case of the Missing Investment”) that the supply side of the economy is hurting from Biden’s anti-growth policies.
In particular, the Journal pointed out that, “Gross private domestic investment fell 12.5% in the quarter, driven by declines in business equipment (down 7.3%) and residential housing (down 4.2%). This tells a worrying story about economic policy.
Slowing Growth And Soaring Debt
A characteristic of the post-pandemic recovery has been that business investment often hasn’t kept pace with robust consumer demand, and now it looks like investment might fall behind again.” This is a sad commentary on the anti-business tone in Washington.
We have seen brief spurts of high growth – such as in 2019 and 2021, just before and after COVID struck – but overall, the last 22 years of slow growth and soaring debt would tempt a cynic to say that Osama bin Laden permanently wounded our economy.
When he engineered those flights into the World Trade Center and Pentagon, he may not have destroyed America’s financial system, but he slowed 55 years of postwar growth to half-speed. From then on, we have lived more on future borrowings than on present production.
Our many reactive overseas wars – in Afghanistan and Iraq, then Libya and Syria, and more – to fight the long shadow of bin Laden are only part of the cost. We have also expanded many non-productive programs at home while running up debts that are now well over five-fold what they were on 9/11.
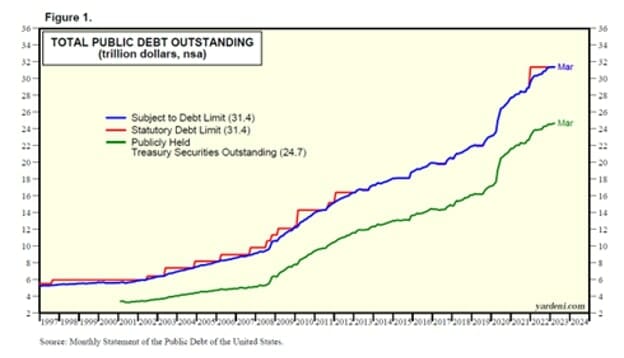
After three successive years of balanced budgets, 1999-2001, the national debt quintupled in 20 years.
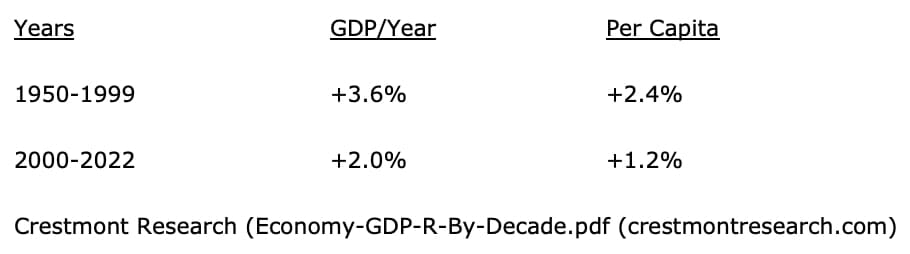
After half a century of 3.6% average annual growth, and 2.4% real annual per capital growth, 1950 to 1999, per capita growth was cut in half, and average annual growth has been reduced to 2% since 2000.
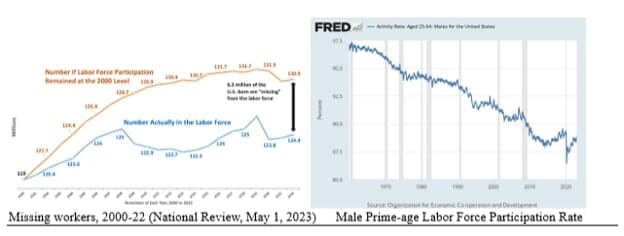
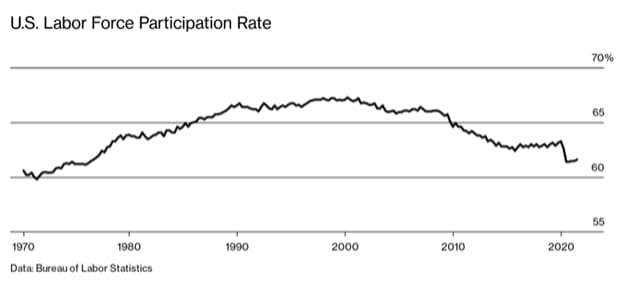
The year 2000 is also about the time when able-bodied men and women started dropping out of the labor force.
I’ve covered men in the past, but the current issue of National Review (“Missing Workers Found: It turns out they are not immigrants,” May 1, 2003, by Steven Camarota, director of research at the Center for Immigration Studies) shows that “The labor-force participation rate of U.S.-born women rose until about the year 2000 and has declined since, even as the share of U.S.-born women with children has also declined significantly.
The decline in employment is primarily among the U.S.-born non-college-educated, and this holds true whether one studies the 16-to-64, 18-to-64 or 25-to-54 age range.”
The overall labor force participation rate for U.S.-born adults aged 18 to 64 without a bachelor’s degree was 76.4% in 2000, but it fell to 70.3% at the end of 2022, when the unemployment rate was under 4%. The reason for this great statistical gap is that the unemployment rate only counts those who say they are looking for a job.
“They do not include the roughly 54 million working-age people who are neither working nor looking for work,” says National Review. Did something in the dot-com bubble or 9/11 (or both) kill our entrepreneurial spirit or our working drive or the spirit of growth in our country?
The Day of Reckoning for Debts is Approaching
Presidents and Congressional majorities of both Parties spend too much money, to be sure, but we voters choose these people and re-elect them.
This is what we apparently want, that proverbial “free lunch” of rising benefits at low or no cost. The result has been trillion-dollar deficits in most years since 2009:
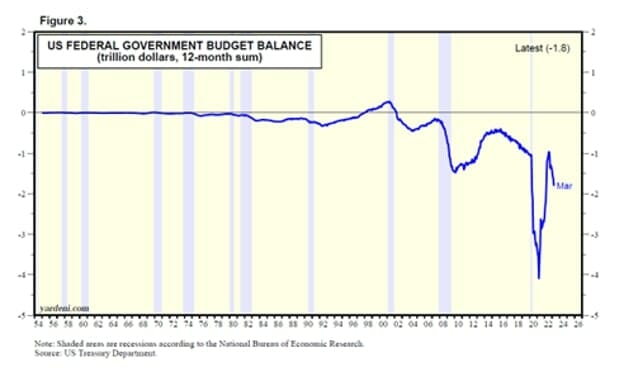
So far in the 2020s, deficits are approaching $10 trillion: $3.132 trillion in 2020, $2.776 trillion in 2021, $1.375 trillion in 2022, and $1.1 trillion in the first half of FY’23, for a $9.5 trillion rate for four years.
So far, we have not faced the inevitable consequences of this massive debt, since interest rates have been so low, at near zero for nearly 14 years until last year. This free ride will not continue.
In the last year, including this week’s 0.25% rate increase, the Fed raised rates 10 consecutive times for 500 basis points. This has raised the outlay for interest paid on the federal debt to $565 billion over the last 12 months (through March 31, charted below), up about 50% from early 2022, with more rises to come.
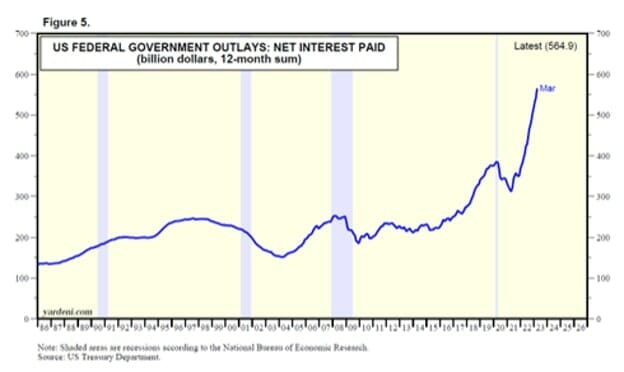
This total is based on average interest rates on publicly held debt of around 2.2%. At average payments of just 3%, the annual interest expense would be $740 billion at current debt levels – but debts will increase.
This brings us to the silliest of all debates – the “debt ceiling debate.” This carnival is like a convention of overeaters arguing over diet plans so that they can wrestle into their bathing suits this summer, after which they will binge again in the fall.
Setting a new debt ceiling only gives them permission to overspend more, until the next ceiling comes into view. Where is the virtue in that? Do away with ceilings and start talking “floors” instead. Start reducing spending to last year’s spending level instead – a new floor.
In the meantime, let’s keep investing in good stocks. Don’t “Sell in May” or “Go Away,” since well-run companies can still grow despite the direction the nation as a whole is taking.
In fact, with fewer of us willing to work, those who work the hardest and smartest will be rewarded the most, and there are now far fewer companies on U.S. exchanges, from a peak of 8,090 in 1996 to barely half that, 4,266 in 2019:
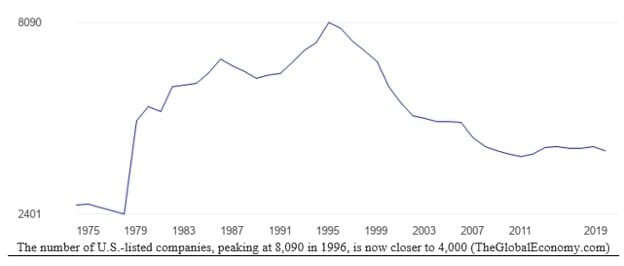
With far more money chasing far fewer stocks, there is a thriving market for good stocks. The world is still growing on all major continents, and there will be customers in developing nations as well as at home for enlightened businesses seeking new markets, so go where the smart money is going – toward growth.


