Perritt Capital Management commentary for the first quarter ended March 31, 2018; titled, “Jekyll And Hyde Quarter.”

Q1 hedge fund letters, conference, scoops etc, Also read Lear Capital: Financial Products You Should Avoid?
The first quarter of 2018 was remarkable in several ways. We saw record highs in equity markets, but also a fierce resurgence in volatility. To some degree, the first quarter was a Jekyll and Hyde type of period. The first half of the quarter was characterized by a low volatility, momentum driven, continuation of the themes that carried 2017. While the second half of the quarter brought in a
new regime, with explosive volatility, a refocusing of investors attention on fundamentals, and new leadership in the market. The rest of our commentary this quarter will help explain how the Perritt MicroCap Opportunities Fund (“the fund”) performed during these two distinct market environments, and the reasons behind that performance.
As an active manager, the fund has a less than 1.0 correlation to its benchmark as of 3/31/18. This is driven by distinct sector weight differences, weighting of individual stocks in the portfolio, and stylistic investment differences from the composition of the benchmark. The fund has regularly experienced significant positive and negative deltas in performance relative to the benchmark.
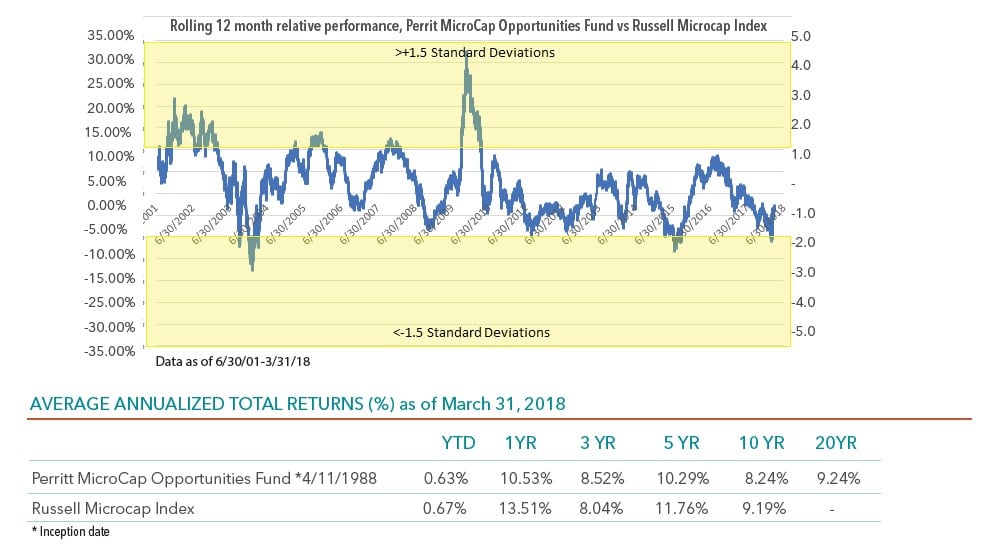
Below is a chart of the rolling delta of trailing 12-month performance between the fund and the Russell Microcap Index (“the benchmark”) as of 3/31/2018:
We find the 12-month rolling performance delta, from the 6/30/2000 inception of the benchmark through 3/31/2018, to be a highly mean reverting series. The average 12-month performance delta since 6/30/2000 is +2.3%, reflecting our long-term outperformance. The standard deviation is 7.2%, which indicates that there can be periods where we significantly outperform or underperform.
On a trailing 12-month basis, our performance relative to the benchmark Russell Microcap Index during the first quarter of 2018 reached -10.83%. This represented -1.8 standard deviations from our mean rolling 12-month performance since 2001. An extreme that lies in the bottom 98th percentile of relative 12-month returns. This was an outcome we were quite unpleased with, but one we understood to be an extreme, and yet, also not unprecedented. After being participants in the U.S. Microcap equity market for nearly 30 years, we understand cycles, even extremes ones, come and go. Historically however, +/- 1.5 standard deviations has been a reliable inflection point for mean reversion of our relative performance.
In the final analysis, we believe a confluence of market factors led to this recent period of underperformance, which hit a nadir
in the middle of the first quarter of 2018. We trace the sources of this underperformance to the following factors: 1) disproportionate share of market gains being produced by narrow segments of the market, which we do not participate in, 2) outperformance of larger markets capitalization names within the index, vs. the sub-$500mm market capitalization segment we target, 3) stylistic headwinds, namely growth outperforming value, and 4) larger errors of commission than our historical average. It was our belief that many of these factors are reliably mean reverting. And thus, we expected performance to rebound from the February lows. Which it did in the second half of Q1, wonderfully.
We expect our performance to continue to positively and significantly mean revert. Despite the cyclically of underperformance and outperformance periods, the fund has outperformed its benchmark since inception.
Drivers of Recent Underperformance
1. Concentration of benchmark performance in Healthcare (Biotech/Pharma) and Technology (Internet Software/Software):
Below is the Russell Microcap Index attribution from 3/7/2017-3/7/2018. This period captures the trailing 12-month period
ending at the low point of our recent underperformance cycle.
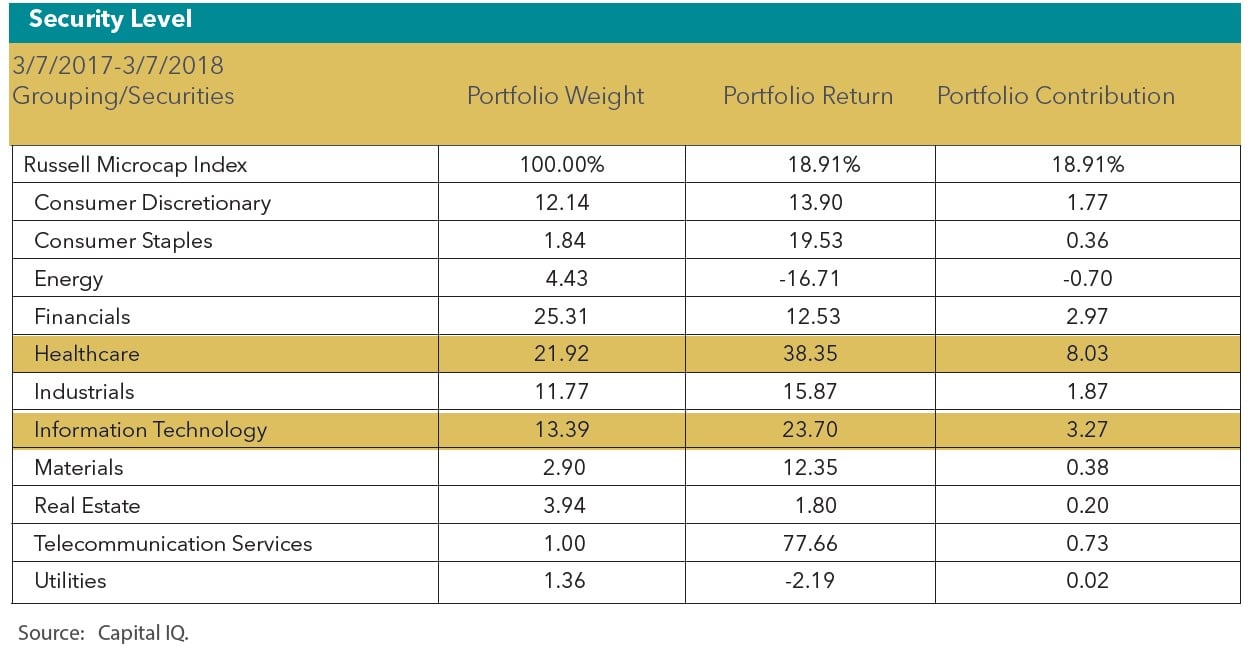
The Russell Microcap Index gained 18.91% from 3/7/2017-3/7/2018. However, the majority of sectors “underperformed.” Two sectors alone drove 60% of the index performance. Healthcare, which gained +38.35%, added +803bps to the return and Technology, which gained +23.70%, added +327 bps to the return.
The Telecomm sector performance was primarily driven by a single company being acquired (STRP), and the sector’s low weighting (1.0%) causes the contribution to be relatively immaterial. The Healthcare (index weight of 21.9%) plus Technology (index weight of 13.4%.) sectors were the strongest contributors within the Russell Microcap Index.
Roughly 40% of the index performance has been concentrated in the subsectors of Biotechnology, Pharmaceutical and Software. As a value-oriented manager who strives to build a portfolio of securities issued by companies with sustainable, profitable business, we find ourselves unable to generate many investable ideas in these subsectors. During the prior year, the fund maintained a 0% exposure to the Biotech/Pharma sectors, and a 2.8% exposure in Software, all significantly below the benchmark weights.
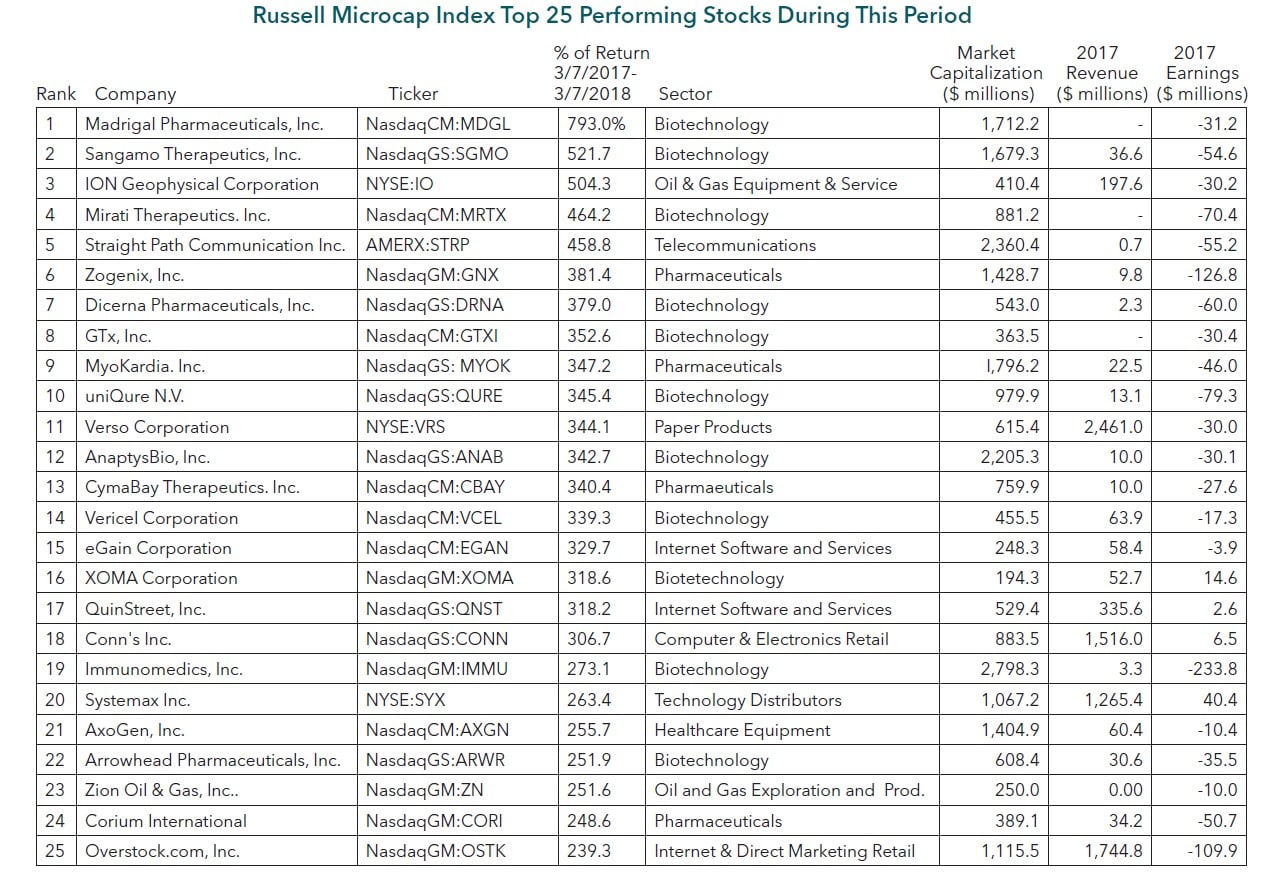
Of the top twenty-five performing stocks in the index, fifteen are Biotech/Pharma related. Of those same twenty-five, only four are
profitable companies, and nine have $10mm or less in revenues.
The top 25 performing stocks show an unusual degree of extreme price performance with an average gain of 359%, as well as narrow industry concentration.
2. Performance By Market Capitalization segment 3/7/2017-3/7/2018:
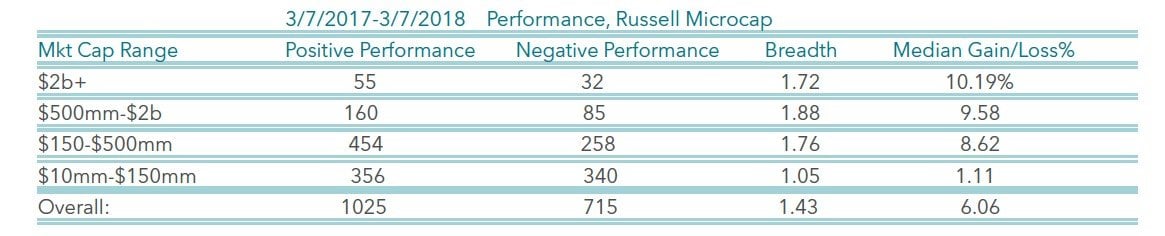
Stocks with larger beginning market capitalizations significantly outperformed stocks of smaller sized companies. The fund
targets companies with market capitalizations of less than $500mm, and has a median market cap of $309mm.
3. Growth vs. Value
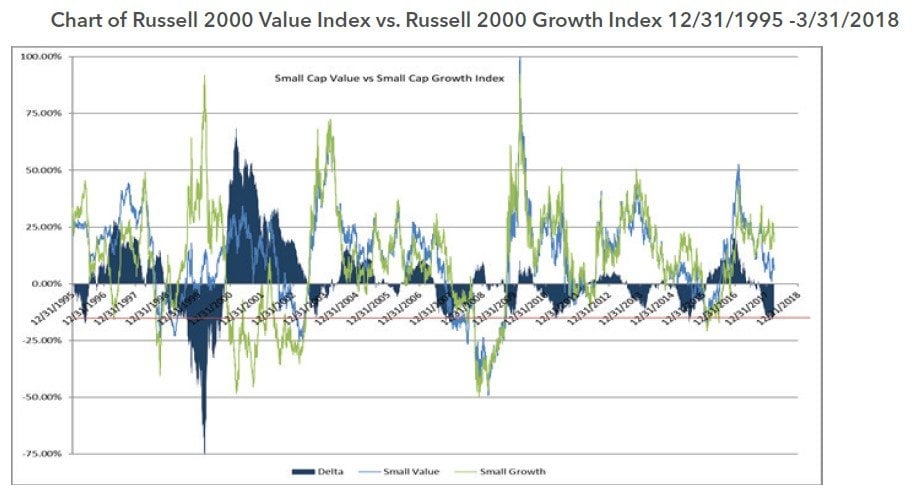
Even including 1999-2001 extremes, growth and value factors were reliably mean reverting.
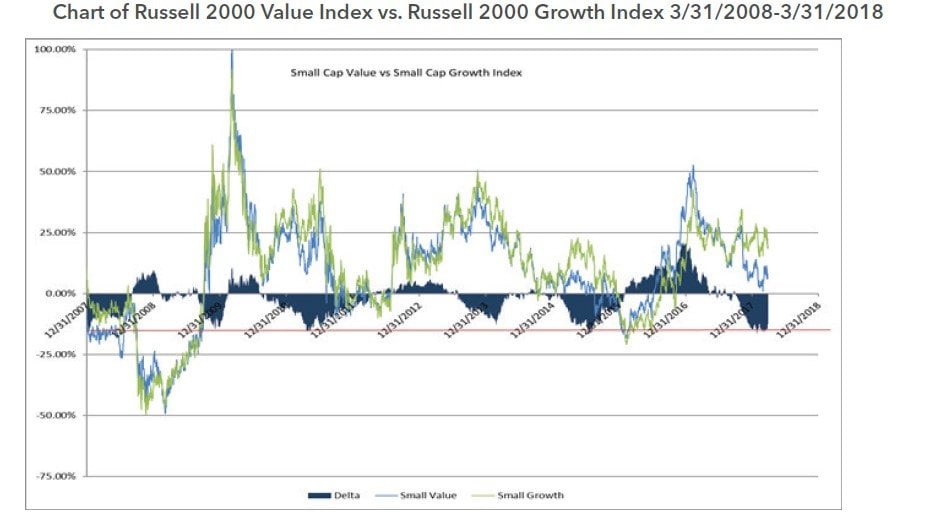
Growth has significantly outperformed value in the previous 14 months. We find growth vs. value relative performance to be
highly mean reverting. The level of growth outperformance reached in Q1 2018 has previously been an inflection point a number
of times over the past 10 years.
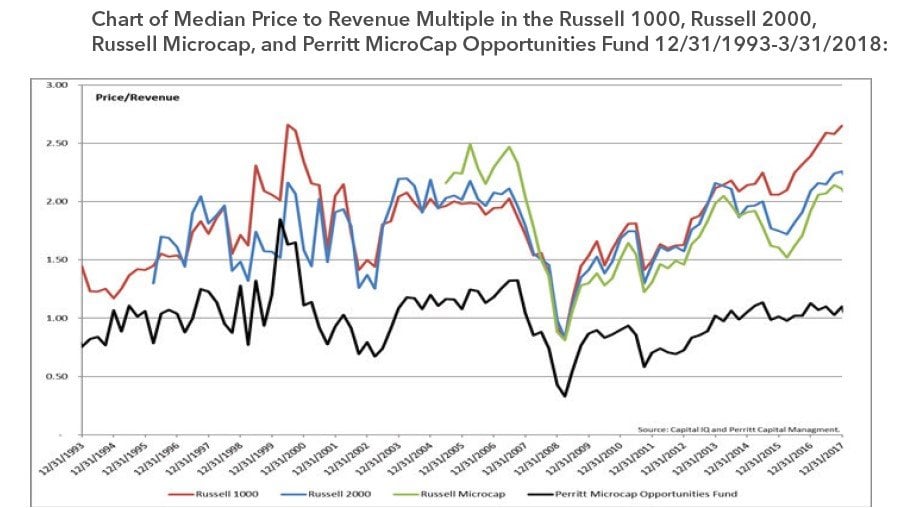
We also measure growth vs. value by the performance of securities grouped by valuation:
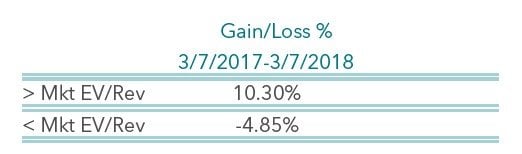
Higher multiple stocks have significantly outperformed stocks trading at lower valuations. The fund median revenue multiple is
currently approximately 1.0x, less than half the Russell Microcap Index median revenue multiple of 2.1x.
As a value focused manager, we have historically managed the fund with a significantly lower level of valuation than the broader markets and benchmark. We find broader market valuations to currently be well above average. In our opinion, the securities we have in the portfolio provide a better long-term risk/reward opportunity.
4. Errors of Commission
The fund’s top and bottom performers as measured by contribution to the fund’s performance:

As our mission has always been, the fund has continued to capitalize on unique opportunities we find in the microcap asset class. Our top five performing positions contributed +635bps to our return. However, our bottom five performing positions detracted -423bps. While it is of significant importance in our minds to have your winners contribute more than the losers detract, the spread of winners-losers was less than we target. Historically, we have a positive spread in our top five vs. bottom five. In the preceding 5 years (2011-2016) we had a ratio of top five contribution to bottom five detraction of roughly 3:1. In the recent period this ratio is 1.5:1. The narrower spread has been driven by larger than historical detractions by individual positions.
Mean Reversion and the Performance Turnaround
As we’ve now stated many times in this commentary, we firmly believed our performance had potential to recover based on the historical evidence that many of the drivers of our underperformance were reliably mean reverting. From 3/7/2018 through the end of the quarter, the Perritt MicroCap Opportunities Fund gained +2.97%, while the benchmark declined -2.86%, for a performance delta of +583bps in three and a half weeks! This cut our rolling 12 month performance delta to the benchmark down to -3.06%.
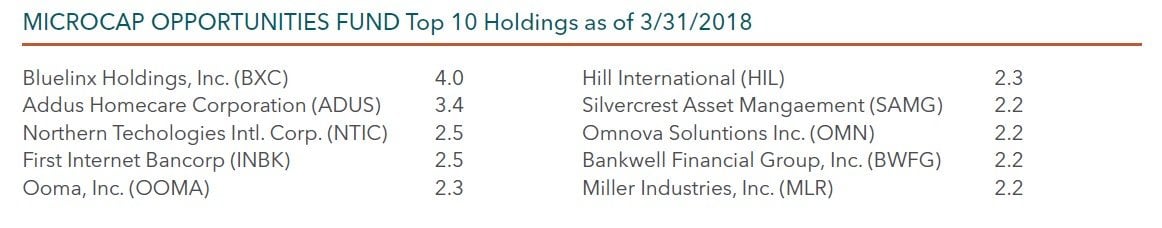
While we believe that the securities purchased for the fund’s portfolio trade at significant discounts to intrinsic value, the timing of the realization is often highly uncertain. In many cases, securities can trade at a significant discount for years. This can weigh on fund performance in the short term, as we hold these securities awaiting closure of the intrinsic value to market value gap. In our experience, the gap to intrinsic value, which may have been stubbornly persistent for years, can dramatically narrow in very short periods of time. As examples, we saw this dynamic in late Q1 in our top two holdings, BXC and ADUS.
BlueLinx Holdings Inc. (BXC), our top holding, is a stock that had underperformed the market for years. The company recently announced two major catalytic events, a real estate divestiture and an acquisition, which we had anticipated, and the stock moved from the $15 range to $32 to close the quarter (and now $41 as of 4/23/2018). This is a 100%+ gain in a 3 week period from a stock which had “gone nowhere” for years.
Addus Homecare Corp. (ADUS), our second largest holding, presents a similar, though admittedly, less extreme case. Nevertheless, ADUS highlights how quickly the performance contribution from a single position can change from being a detractor to a contributor. We have held ADUS for many years and have a cost basis of less than $7 per share. The stock closed the quarter at $48 (and is $54 as of 4/23/2018). Though a significant contributor to long-term performance, it is not a consistent contributor to performance. As an example, the stock closed 2017 down -1%, vs. a gain for the Russell Microcap index of +13%. ADUS was a significant drag on the Fund’s performance for the calendar year 2017, despite being a hugely successful long term holding. After announcing an acquisition in Q1 2018, the stock moved from ~$34 to $48 to close the quarter. The stock is now again outperforming the market, and a positive contributor to relative performance.
The combination of reliably mean reverting factors reversing from a headwind to a tailwind, discussed at length in this commentary, and the opportunity to generate significant individual security alpha, gives our team confidence in our ability to seek to continue our long-term outperformance going forward.
See the full PDF below.


