LISI Market Comment for the month of August 2018, titled, “Leveraged Breakout or Controlled Risk?”

Q2 hedge fund letters, conference, scoops etc
(Summary Points)
- In August 2007, in the early days of the Financial Crisis amid a raft of mega-deals, the market wondered whether the PE firm KKR could raise the debt needed to finance its $29bn leveraged buyout (LBO) of payments processor First Data Corp. The price represented a pricing multiple of 14.6x EBITDA.[1] High valuations and borrower-favorable terms are clear manifestations of peak-market activity
- The First Data deal got done, but liquidity dried up soon after and we all know what happened next. A decade on, deal leverage is rising again (note Tesla at a 15x-25x pricing multiple) and market valuations are also elevated. Are we at a market "peak," or might we “plateau” for a while?
- LBO valuations are now high, but not because of excessive leverage. Good news for the market. Average pricing multiples for large LBOs are even with 2007 at just over 10x, while Debt/EBITDA in 2017 was lower, at 6.4x vs. 7.2x then. Also, PE sponsors are contributing more equity in LBO financings – 41% in 2017 vs. only 30% in 2007. This occurs in an environment where the S&P 500 is trading at an EV/EBITDA multiple higher than that of 2007, 13.2x vs. 10.7x. But again, don't blame it on leverage: Debt-to-Assets for the S&P 500 is down from 38% in 2007 to 25% as of 2017
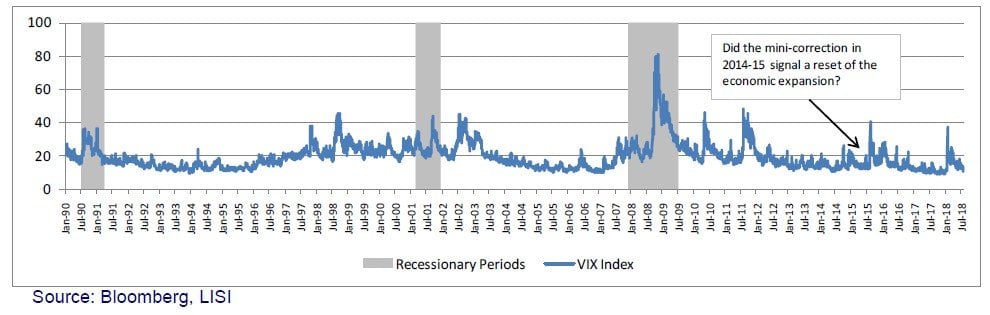
- At 110 months, the 2nd longest recovery on record appears to be charging ahead with 4.1% GDP growth for 2Q18. Some have suggested that a "mini-correction" after the oil sector implosion in the last half of 2014 may have provided a reset to the post-Great Recession expansion—call it an "adjusted expansion"—such that it really measures four years instead of nine
- Positive catalysts for the US equity markets remain in place. Higher GDP growth presaged strong corporate earnings. With 80% of the S&P 500 reporting 2Q18 earnings, 84% exceeded analyst estimates. Still, with low unemployment and rising hourly pay, costs should begin to increase and pressure margins
- An entrenchment of positions has boosted the simmering trade war between the US and China into a new and accelerated phase as salvos of tariff announcements darken the skies for trade. The US appears to be taking a softer approach with some of its longstanding allies, but the full effect of trade disruption has yet to be felt. For exporters targeted by retaliatory tariffs the future is likely to bring difficulty, e.g., soybeans, bourbon, and iconic American brands such as Harley Davidson
- A US Treasury 10-year yield hovering around 3.0% may help to alleviate concerns about a yield inversion that might signal an impending recession, at least until the September FOMC meeting, at which Fed Funds futures suggest a 90% probability of another 0.25% rate hike
- At its late June meeting the LISI Investment Committee voted to increase the equities portion for certain models in our current Tactical Asset Allocations. We see support for equity valuations with strong corporate earnings, particularly in a US market helped by tax cuts and a cautious Fed. Still, we are wary of potential shocks from an escalating trade war and possible geopolitical flare-ups, and favor broad diversification
1 EBITDA = Earnings before Interest, Taxes, Depreciation and Amortization; a traditional measure of cash flows
Leveraged Breakout or Controlled Risk?
In the early days of the Financial Crisis, just when cracks beyond the mortgage market began to appear, a crowd of bankers, analysts and risk arbitrageurs packed a large auditorium at Lehman Brothers headquarters in New York. It was August, 2007 and we were there to watch the private equity firm KKR and its underwriters try to convince investors to buy the debt needed to finance its $29 billion leveraged buyout (LBO) of the payments processor First Data Corp. The mega-deals that year already included the February buyout of the Texas utility company TXU for $32 billion by KKR, TPG and Goldman Sachs (the press: "They're hunting in packs"), and Blackstone's July announcement of a $26 billion takeover of Hilton hotels.1
The First Data acquisition would require $8 billion in high yield bonds and $15 billion in leveraged loans to be syndicated by a group of banks including Lehman, Citigroup, Goldman Sachs and Merrill Lynch. The deal price represented a multiple of 14.6x First Data’s annual EBITDA of $1.9 billion.2 Such high valuations, along with borrower-favorable terms, are clear manifestations of peak-market activity. The housing and real estate industry already showed signs of stress after a series of rate hikes that took the Fed funds rate from 2.5% to 5.5% in just 18 months from December 2004 to June 2006. Were corporations to be the next to fall? In the end, the First Data deal got done, but liquidity dried up soon thereafter and we all know what happened next. A decade on, deal leverage is rising again (note the proposed Tesla buyout of $82 billion, which analysts say implies a 15x-25x pricing multiple). Are we at a market "peak," or might we ―plateau‖ for a while?
Fiscal stimulus has succeeded in boosting corporate earnings for now, and that propulsion has not yet met resistance. Some observers view the volatility in 2H14 and 2015 as a reset for markets and the economy, such that the post-Great Recession expansion—call it an "adjusted expansion"—really measures four years instead of nine (see chart below).
We discuss this briefly below, followed by tariffs and expected Fed activity, and finally examine market and deal valuation and leverage statistics for any clear signals of upcoming stress. At its late July meeting the LISI Investment Committee voted to increase the equities portion for certain models in our current Tactical Asset Allocations. We see support for equity valuations from strong corporate earnings, particularly in a US market helped by tax cuts and a cautious Fed. Still, we are wary of potential shocks from an escalating trade war and possible geopolitical flare-ups, and favor broad diversification.
1. Does a Mini-Correction Explain the Expansion's Longevity
A number of positive catalysts for the US equity markets remain firmly in place, pointing to strength both on an absolute basis and in comparison to other major markets such as those of the Euro-zone and Japan. We have, in recent letters, highlighted a panoply of risks that attend an extended, but shallow, economic expansion since the Great Recession. At 110 months, the second longest US recovery on record appears to be charging ahead with the 4.1% GDP growth reading for 2Q18. While we acknowledge that the S&P 500 is not GDP, US equity markets look poised to recoup the highs reached in late January of this year. Still, some commentators have suggested that a "mini-correction" after the oil sector implosion in the last half of 2014 may have provided a reset to an overheating market, in effect restarting the clock (see chart above).
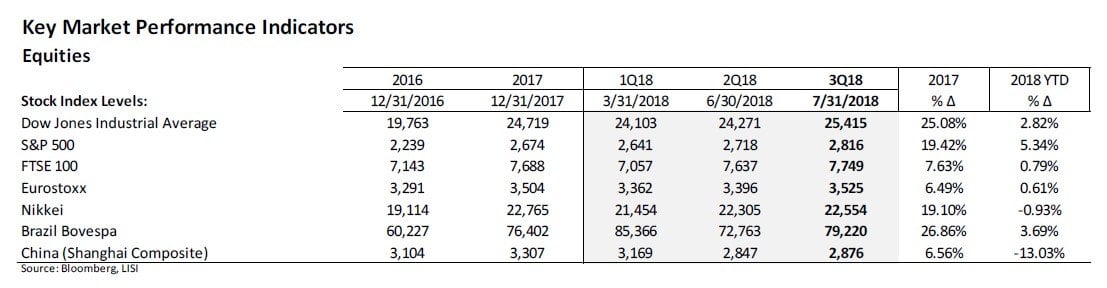
Higher-than-expected 2Q18 US GDP growth presaged strong company earnings. With about 80% of the S&P 500 having reported as of this writing, fully 84% exceeded analyst estimates for revenues and earnings. Among the strongest sectors in upside surprises were Consumer Discretionary at an average beat of 13%, utilities at 8% and Information Technology at 7%. Only the Energy sector saw parity between positive and negative earnings surprises. It was also the only sector that showed net negative surprise, at -7%. The US equity markets continue to outpace their global peers (see chart below).
2. Tariffs and the Art of Market Performance
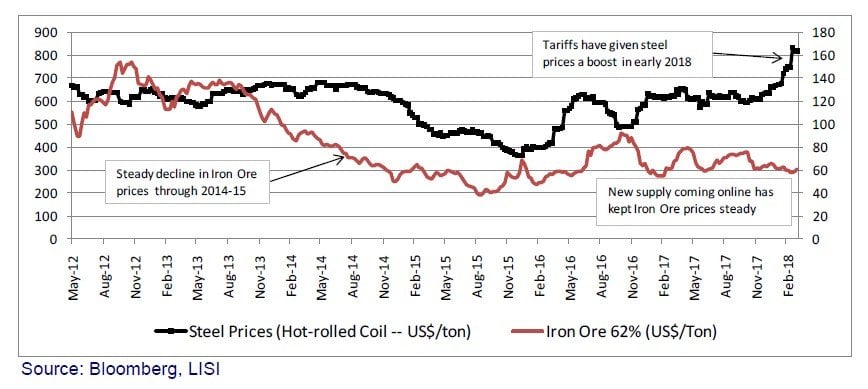
An entrenchment of positions has boosted the simmering trade war between the US and China into a new and accelerated phase as salvos of tariff announcements darken the skies for trade. The US appears to be taking a softer approach with some of its longstanding allies, but the full effect of trade disruption has yet to be felt. Certainly, US corporate earnings have shown no adverse impact, perhaps even a positive one for certain industries like steel and aluminum (see chart below). For exporters targeted by retaliatory tariffs the future is likely to bring difficulty, e.g., soybeans, bourbon, and iconic American brands such as Harley Davidson.
With unemployment at 4% and hourly pay rising modestly but steadily, businesses are likely to begin to see their cost structures increase. Tariffs will likely boost revenues for some companies as they charge higher prices for their products, yet higher prices for the basic or intermediate goods that go into manufacturing could have the opposite effect. Some of the increased input costs will get passed through to consumers, but the rest will dampen margins. Meanwhile, earnings growth is helping to keep price-to-earnings (P/E) ratios in check, with the S&P 500 P/E ratio close to its December 2017 reading of 21.3x, as it ended the 2Q18 at 21.1x.
3. Fed Continues to Outpace on Rates and Deleveraging
Amplified US Treasury note issuance with longer maturities has contributed to keeping the UST 10-year note hovering around a 3.0% yield (see table below). This may help to alleviate concerns about a yield inversion that might signal an impending recession, at least until the September FOMC meeting, at which Fed Funds futures suggest a 90% probability of another 0.25% rate hike. The Fed started reducing its holdings last October via a planned and measured Balance Sheet Normalization Program that has now reached a planned rate of $40 billion per month, while the European Central Bank and the Bank of Japan have been slower to address their holdings. The Bank of England, which just hiked its policy rate to 0.75% on August 2nd, has also indicated that it plans to begin reducing its balance sheet. All these actions point to declining demand for US Treasury securities at the margin, particularly since the aggregate balance sheet holdings of these central banks ballooned from a pre-financial crisis $3 trillion to over $15 trillion as of earlier this year.
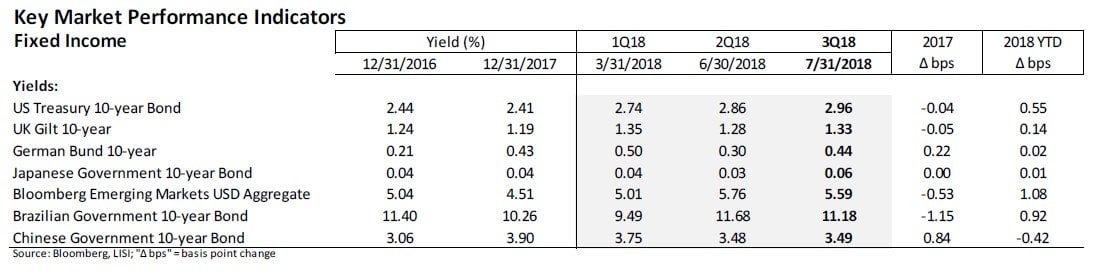
Risk premia for corporate debt have remained roughly even with their levels at the end of 2017, after the market shook off its first-quarter jitters (see table below). The exception is Emerging Markets (EM) corporate debt, where fund outflows due to increasing rates in the US have taken the indices nearly back to their 2016 levels. Since the end of 2017, the aggregate risk premium for EM corporate debt widened by a half-percent, while EM high yield is now about 1.1% higher compared to US Treasury notes of similar maturity.
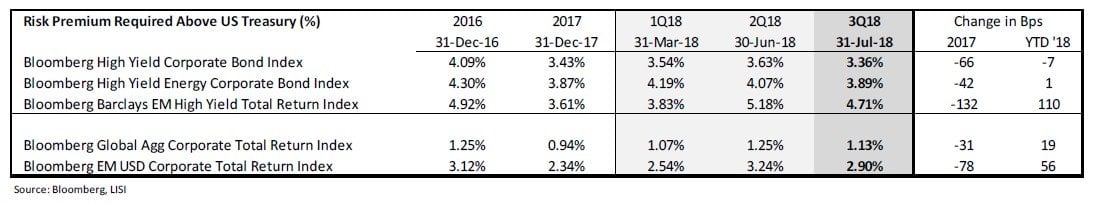
While the risk premia appear to be relatively stable over the last 1-1/2 years, it is important to note that more recent readings represent a spread over US Treasury rates based on a Fed Funds rate that, after recent hikes, is 1.25% higher since the beginning of 2017. Hence, in 2017 the market absorbed some of the impact of the higher Fed Funds rate by reducing the required risk premium. In the first half of 2018, that dampening reaction stopped. In any case, a higher term structure for interest rates means increasing debt service, not only in the moving floating rate loan market but also at refi time for bond issuers.
4. Leverage Breakout or Healthy Risk Taking?
At the time of that Lehman headquarters meeting on First Data, LBO deal pricing had reached its highest point in years, averaging 10.8x Price-to-EBITDA for broadly syndicated loans, accompanied by leverage (Debt-to-EBITDA) exceeding 7.0x. On average over 2003-2017 these measures were 9.6x and 6.0x, respectively. At the same time, EV-to-EBITDA (the sum of equity and debt, divided by EBITDA, that provides a broad measure of valuation) for the broader market was 10.7x.
When we compare these and other measures from 2007 to 2017, we find that valuations are high but the elevated pricing is not caused by excessive leverage. This is good news for the market generally. Headlines point out record debt issuance and high debt outstanding, e.g., institutional loans outstanding now exceed $1.0 trillion, but corporate cash flows are sufficient to support such levels. At least, for now.
Valuations in LBOs and in the broader markets are currently elevated, which reflects the strong equity market. In the chart below, we see that average Purchase Price Multiples for large, broadly syndicated LBOs are roughly even with 2007 at just over 10x. This deal inflation occurs in an environment where the S&P 500 is trading at an EV/EBITDA multiple higher than that of 2007, at 13.2x vs. 10.7x. But the higher EV/EBITDA reflects greater equity value, not greater leverage: Debt-to-Assets for the S&P 500 is down from 38% in 2007 to 25% as of 2017, and Net Debt-to-EBITDA at only 1.5x (vs. over 4x in 2007) results from large cash holdings at corporations, which could be used to pay down debt if necessary. Clearly, that kind of liquidity was not available in 2007-08.
Corporate and LBO Leverage, Then and Now (2007 and 2017)
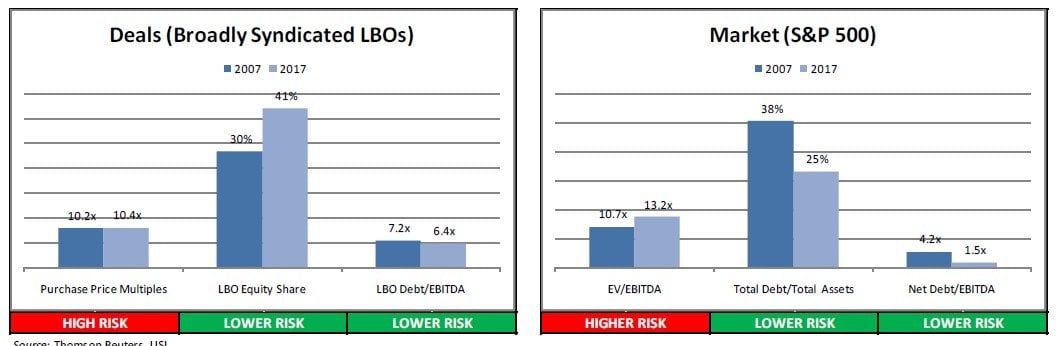
With respect to deal multiples, the big private equity firms are contributing a higher proportion of equity to today's buyouts (41% in 2017 vs. 30% in 2007). Put more accurately, the investors in the room financing those buyouts with leveraged loans and high yield bonds are demanding lower leverage. So the Debt-to-EBITDA measure for these deals is correspondingly lower, at 6.4x in 2017 vs. 7.2x prior to the last recession.
Conclusion
In light of strong corporate performance and signs that both fiscal and monetary policy remain accommodative, the LISI Investment Committee at its late July meeting voted to increase equities slightly in its Tactical Asset Allocations. Accordingly, across asset classes we favor the following:
- Fixed Income – We recommend shortening duration and accepting somewhat higher credit risk to mitigate effects of the anticipated rate hike cycle, while taking advantage of improving fundamentals
- Equities – We are positive on equities, particularly in the US, given improving EPS, support from US fiscal stimulus, and the Fed's slow and steady approach to hiking interest rates. We are cautious about the prospects for European equities and have shifted our stance somewhat toward the US and Asia
- Alternatives – We like the low correlation to core markets exhibited by alternative assets, and favor their inclusion as a small component of portfolios with moderate to higher risk profiles
- Cash – We recommend keeping a small allocation in cash to capitalize on any market dislocations
Some report smoke signals emanating from the loan and bond markets, but we see limited warnings given that it is raining good news. Eventually the expansion and strong gains will come to an end, but despite the potential for yield inversion we do not see that turn coming soon. To quote a market leader from an earlier and more risky time, we turn to Citigroup CEO Chuck Prince in summer 2007: ―When the music stops, in terms of liquidity, things will be complicated. But as long as the music is playing, you’ve got to get up and dance. We’re still dancing.‖3
Article by Leumi Investment Services


