Recently there has been a fairly active discussion within the financial media on the topic of stock buybacks, or share repurchases. This is probably due to the recent tax reform, which has caused many to question where companies will spend their additional profits now that firms (on average) will be spending less on federal tax payments. Non-academic articles are generally against stock buybacks, although there are a few articles defending buybacks.(1) A good paper by the AQR team that dispels myths about buybacks can be found here. In addition, Lawrence Hamtil has written his defense of stock buybacks, found here and here.

To be clear, we are not taking a stance on how companies spend the money (that is the CEO’s job), but rather looking at what happened in the cross-section of stock returns in the past, based on the academic research.
Let’s start with the baseline assumption that a CEO has cash, either via cash from operations or through fundraising. Given that the firm now has cash, the CEO can do one of three things:
- Sit on it (and invest in short-term cash securities)
- Invest the cash in projects / R&D (Investment)
- Return the cash to shareholders via either share buybacks or dividends.
Let’s go through the options one-by-one. Sitting on cash (above what is required for operations and in case of an economic downturn) is generally frowned upon by investors, as they are investing in a stock for the CEO/firm to grow profits through business operations. Berkshire Hathaway is probably one of the few firms that can sit on hundreds of billions of dollars of cash, without a shareholder uprising. But besides Berkshire, almost most firms need to either pick between options (2) invest, or (3) return capital to shareholders.
When examining the cross-section of stock returns, on average, stock buybacks are good for investors–this is not a disputed fact. Academic studies showing this to be true can be found here, here, and here. Wes and I have a paper on the topic here and here, and Meb has a full book on the topic. Again, there can be instances/anecdotes where buybacks are poor uses of capital, but on average, they are good for investors.
So let’s put the buyback conversation on the back-burner since the evidence seems to be pretty clear. Instead, let’s dig deeper into the alternative use of capital — investment.
Is higher investment, which is implicitly being advocated by those who say buybacks are bad, good for investors in the long-run?
The academic research on this question is pretty clear: higher investment does NOT lead to higher expected returns.
We dig into the research.
The research on the Investment Factor:
First, I would like to start with a paper that really stood out to me as a Ph.D. student while taking my corporate governance class.(2) The 1993 paper is titled, “The Modern Industrial Revolution, Exit, and the Failure of Internal Control Systems,” by Michael Jensen, and can be found here and here. While dated, it has a neat discussion about investment and R&D projects in the 1980s that are interesting to look at ex-post, 35+ years later.
Here is the abstract of the paper:
Since 1973 technological, political, regulatory, and economic forces have been changing the worldwide economy in a fashion comparable to the changes experienced during the nineteenth century Industrial Revolution. As in the nineteenth century, we are experiencing declining costs, increasing average (but decreasing marginal) productivity of labor, reduced growth rates of labor income, excess capacity, and the requirement for downsizing and exit. The last two decades indicate corporate internal control systems have failed to deal effectively with these changes, especially slow growth and the requirement for exit. The next several decades pose a major challenge for Western firms and political systems as these forces continue to work their way through the worldwide economy.
Remembering that the paper was written in 1993, the paper accurately describes the next 25 years — lower inflation and reduced labor income growth rates (cue the ever-popular median income chart!).
But the paper has some nice data (and anecdotes) worth mentioning.
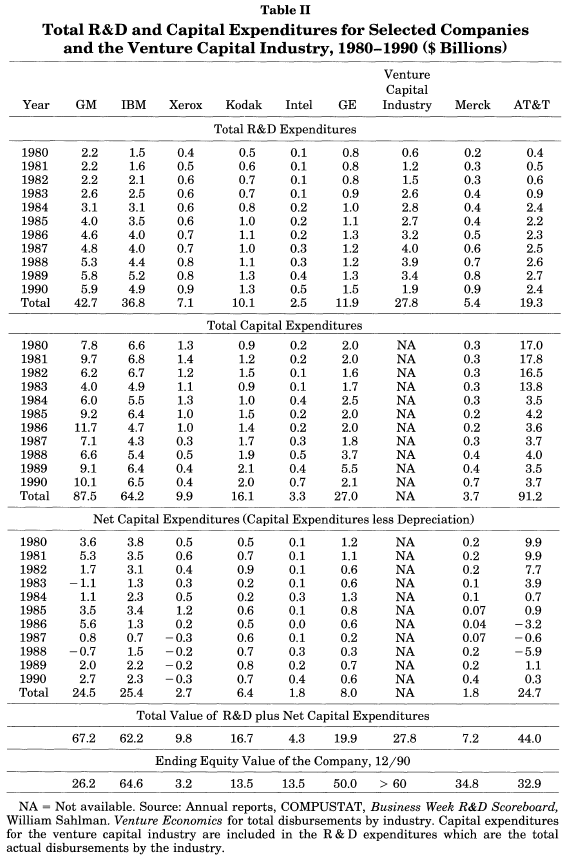
Table 2 of the paper examines a few companies’ spending amounts in the 1980s and highlights how much was spent on R&D and Capital Expenditures. This is then compared, in the last row, to the ending equity value of the company.
As noted, a few of the companies spent more on R&D and Net Capital Expenditures than their firm ending value! For example, GM spent $67.2 billion while ending with an equity value of $26.2 billion. To put that into context, the equity value of Toyota and Honda combined was $21.5bn in 1985. Meaning that GM could have bought Toyota and Honda, and would still have $40+ bn to spend! Not surprisingly, Kodak also spent more ($16.7 bn) than its ending value ($13.5bn). During the 1980s, General Electric (GE) made good use of its capital by spending $19.9bn while ending with an equity value of $50bn.
But one needs to remember that as opposed to spending the cash on R&D and Capital Expenditures, one could have invested the cash (or returned it to shareholders). Based on an investment rate of 10%, the paper examines 3 scenarios to see whether or not the investments made sense (ex-post). This is shown in Table 3 for the anecdotal companies in Table 2 above.
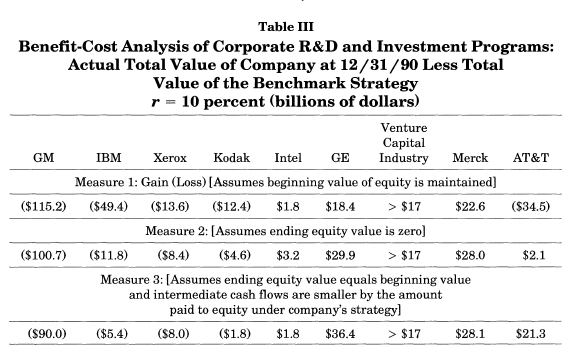
Not surprisingly, GM spending $67bn to end with an equity value of $26bn was a bad investment! When accounting for the alternative options (one of which would have been to buy T-bills with high-interest rates), the GM investment lost between $115 – 90 bn of shareholder value. On the flip side, the GE investments created between $18 – 36 bn, according to the assumptions in the paper.
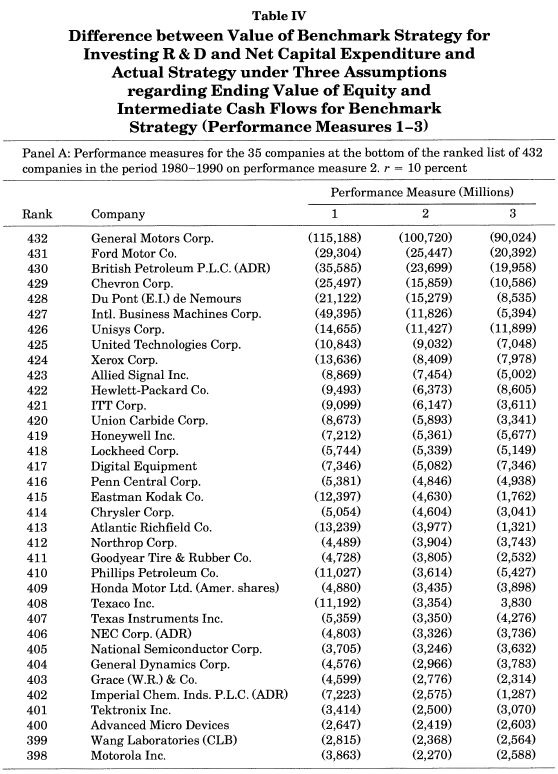
Tables 4 shows the top firms for shareholder destruction and growth (shown in two images below).
Top Losers:
Top Winners:
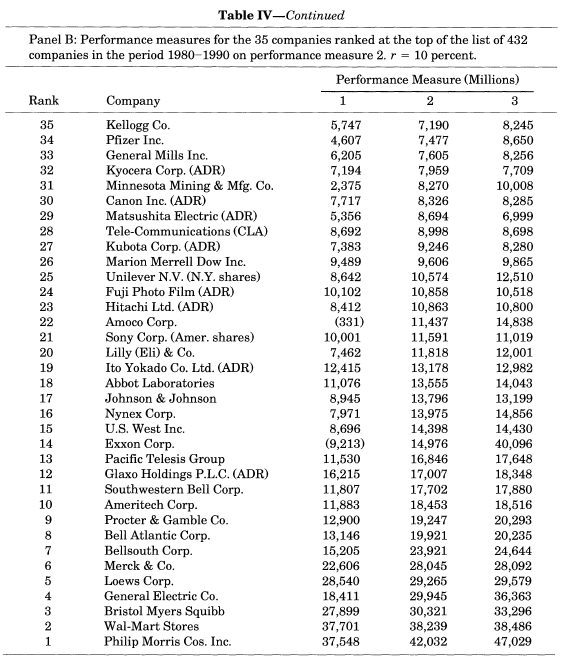
One should note this sample ends on 12/31/1990, which coincided with the Japan equity bubble — note the list of top winners above has a decent number of Japanese ADRs.
Anecdotes are nice and interesting to examine, but what about the average firm?
The paper examines all firms with $250mm of sales in 1989 with full data from 1979 – 1990. Note that because this sample only includes firms that are around for the entire sample, and excludes firms that fell by the wayside, it probably will overstate the net benefit to the companies. Table 5 has the average for 432 firms over that time period. Using the three measures, the average firm’s investments created either -$221mm, +$1.086bn, or +$1.48bn of shareholder value.
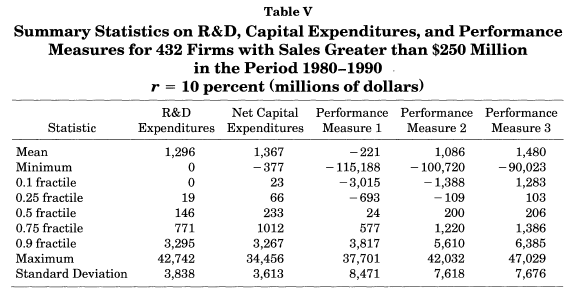
So across the performance models, the firms either generated a small loss or a small profit. However, the model’s assumptions may or may not be valid. In order to truly understand how investments affect stock returns in the cross-section, we need a deeper study including more firms, over a longer time period, and with no survival bias (as happened in the paper above). Luckily, there are many studies that exist, so we will lean on the backs of other researchers to answer the question — is investment good for stock returns?
Examining Asset Growth and Stock Returns
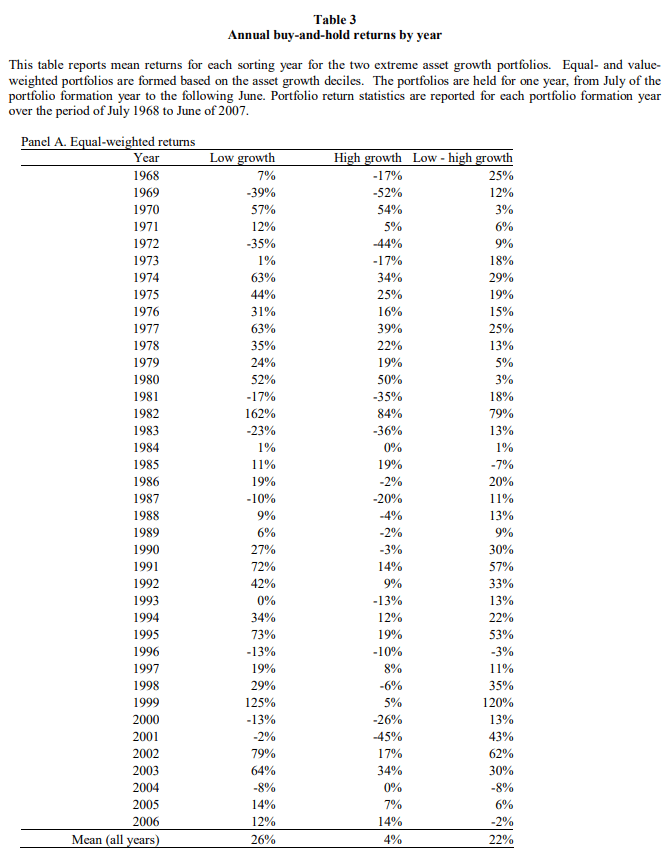
To answer the question of, “Is investment good for stock returns?”, we begin with an early and related study of this question. One can imagine that if the firm assets are growing, this is likely due to investments. The 2009 paper is titled, “The Asset Growth Effect in Stock Returns” by Cooper, Gulen, and Schill and can be found here. We also discuss the paper on our site here.
Here is the abstract of the paper:
We document a strong negative relationship between the growth of total firm assets and subsequent firm stock returns using a broad sample of U.S. stocks. Over the past 40 years, low asset growth stocks have maintained a return premium of 20% per year over high asset growth stocks. The asset growth return premium begins in January following the measurement year and persists for up to five years. The firm asset growth rate maintains an economically and statistically important ability to forecast returns in both large capitalization and small capitalization stocks. In the cross-section of stock returns, the asset growth rate maintains large explanatory power with respect to other previously documented determinants of the cross-section of returns (i.e., size, prior returns, book-to-market ratios). We conclude that risk-based explanations have some difficulty in explaining such a large and consistent return premium.
In summary, firms that grow assets have lower future returns. Below are the equal-weighted annual returns to the top and bottom deciles on asset growth — a proxy for firm’s investments.
Source: https://papers.ssrn.com/sol3/papers.cfm?abstract_id=1335524
In addition to the study above for U.S. stocks, there is a newer study on the asset growth anomaly for international stocks. A link to the paper can be found here. The first sentence of the abstract is below:
Firms with higher asset growth rates subsequently experience lower stock returns in international equity markets, consistent with the U.S. evidence.
So examining asset growth, firms with lower asset growth rates had higher returns than firms with higher asset growth rates in the past. But asset growth is simply a proxy for investment. Are there studies specifically examining the investment factor? Luckily the answer is yes.
First, let’s examine the newer Fama and French 5-factor model. In addition to the original 3 factors (Market, Size, and Value) they add two additional factors (Investment and Profitability). Versions of their paper can be found here and here. Examining their paper, they find that low investment firms outperform high investment firms (again consistent with the asset growth analysis above).
For a deeper dive into the Investment factor, we turn out attention to Lu Zhang’s research, as he has been working on this for a long time. For those very interested, he even has his own website, theinvestmentcapm.com, which summarizes his research. Lu argues that opposed to using the consumption CAPM model, one should use an investment CAPM model. Here is a link to his paper on the model as well as PPT slides. But besides changing the asset pricing model from consumption to investment, Lu examines the cross-sectional data in the past in the 2014 paper “Digesting Anomalies: An Investment Approach”. The paper is by Kewei Hou, Chen Xue, and Lu Zhang and a link can be found here. This paper proposes using a q-factor model consisting of 4-factors–the market, size, investment, and profitability.
On average, low investment firms tend to outperform in the future relative to high investment firms. The average monthly return for the long/short investment factor is 0.45% in their paper. So once again, one finds that higher investments by the firm are not good for future stock returns.(3)
Conclusion
While many in the media have been discussing stock buybacks, we examine this through an alternative lens–investment.(4) Given cash, CEOs generally have two options–either (1) return cash to shareholders through dividends/buybacks or (2) make investments. We examined some anecdotal evidence on firms making investments and examined factor models (the FF 5-factor and the q-factor model) that show that low investment firms generally outperform high investment firms. So if one wants to argue against stock buybacks, one would need to reconcile that argument with the fact that the alternative is investment, and on average, expected stock returns are higher for low investment firms relative to high investment firms.
- The views and opinions expressed herein are those of the author and do not necessarily reflect the views of Alpha Architect, its affiliates or its employees. Our full disclosures are available here. Definitions of common statistics used in our analysis are available here (towards the bottom).
- Join thousands of other readers and subscribe to our blog.
- This site provides NO information on our value ETFs or our momentum ETFs. Please refer to this site.
References
1. Links can be found to articles here, here, here, here, here, here, and here.
2. As a side-note, most corporate governance experts would agree that empire building and poor uses of capital on pet projects are to be discouraged, mainly through reducing the amount of cash the CEO can spend via dividends and buybacks!
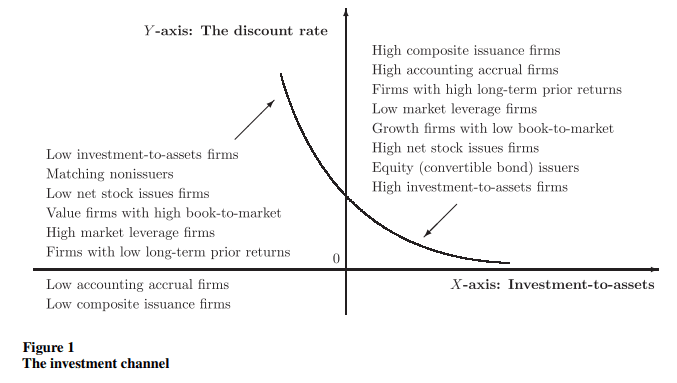
3. To be clear, there are relationships between all these factors that need to be accounted for. As highlighted in Image 1 of their paper, low investment firms are related to firms with low share issuance (i.e. firms that are buying back stock), value firms with poor prior returns, and low accruals. They would argue that their factor model subsumes these other signals, but there is no argument that there is a relationship.
4. The research referenced above shows that on average, buybacks are good for shareholders.
The post "Stock Buybacks Are Bad? What About The Alternative - Investment" appeared first on Alpha Architect.


