
Economic activity is a mosaic
No two economic cycles repeat with the same blend of market conditions. New rules and perceptions from the last recession color the subsequent recovery. History shows that each time traders think we have become smart enough (learning from the past to navigate the future with confidence) we suddenly discover that we are not as smart as we thought. New rules often have unanticipated consequences, investor perceptions are often colored by emotion and they miss important fundamental trends by looking too much in the rearview mirror to drive forward.
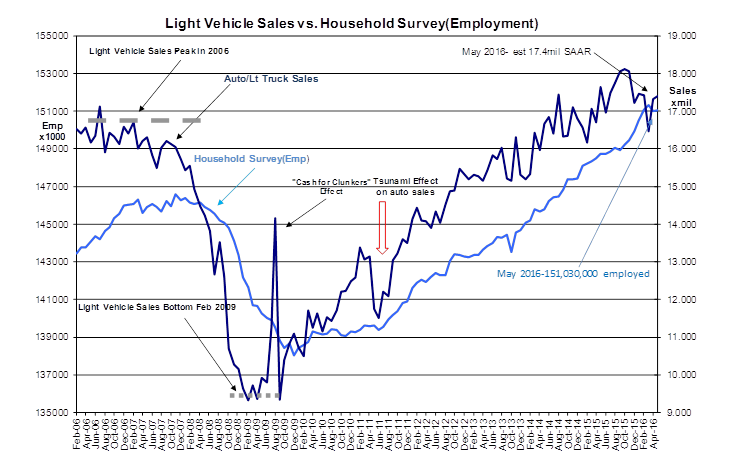
While Light Weight Vehicle Sales and broad employment continue to reflect economic expansion-see Light Vehicle Sales vs. Household Survey(Employment), the strong US$ has taken a toll on selected industries and Fed policy and Dodd-Frank continue to have a negative impact on home lending. Though there are some spots of excess market valuation as in the F.A.N.G. stocks (Face Book, Amazon, Netflix, Google), broad market valuations do not reflect excess speculation. Normalization of the Trade Weighted US$ to its fundamental trend provides investment opportunity.
The Household Survey reported and increase of 26,000 this month after a spectacular rise from Nov 2015. The Household Survey captures all employed individuals including the self-employed which other measures do not. It is my preferred measure of employment trends. Being a statistical index, seeing a slower pace after a period of acceleration so that it returns to the longer term trend, is something we should expect. Due to our data collection methods, economic trends take multiple months before they can be identified. Once a trend has become established it takes multiple months before a trend change can be identified. The flood of concern expressed on today’s release of the May 2016 employment level is more about short term Momentum Investors being caught on the wrong side of a short-term bet. Short-term investing is not compatible with economic fundamentals. Value Investors maintain a long term fundamental focus. Vehicle sales, employment and the Chemical Activity Barometer (reported last week) trends reflect continued economic expansion. Even so, we are not without headwinds.
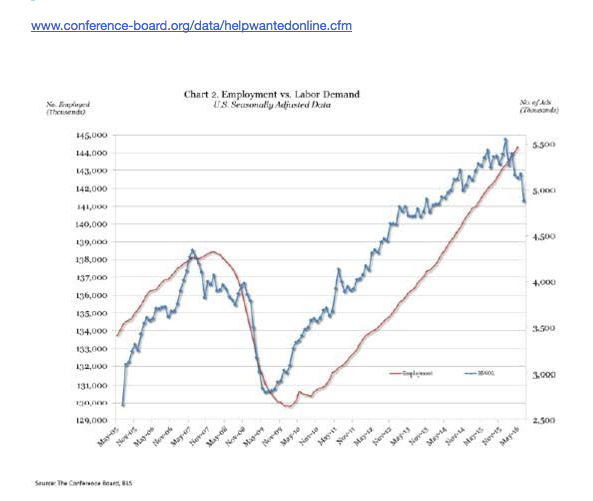
The Conference Board’s Help Wanted On Line Index (HWOL)reported earlier this week indicates some slowing in labor demand. There are likely multiple reasons for this. Certainly a primary reason is that we are at record employment levels, i.e. record low unemployment. Record employment is occurring with significant sectors of our economy underperforming. We may be seeing this impact recently in some of the early employment indicators like the HWOL.
The strength in the Trade Weighted US$ since 2014-2015, discussed in previous notes, has impacted US$ sensitive economic sectors resulting in industry specific employment declines.Employment Trends vs Trade Weighted US$ shows the Trade Weighted US$versus several significant employment sectors. Those which are sensitive to export markets have experienced considerable impact. One can see that strength in the Trade Weighted US$correlates inversely to employment in Metal Fabrication, Machinery, Primary Metals,Oil&Gasand Coal industries. Auto Mfg&Parts which produces mostly for domestic consumption is less sensitive to currency effects. Coal has the additional impact of recent changes in government policies. The fact that there has been a significant number of high paying jobs lost due to recent Trade Weighted US$ strength has been camouflaged by employment growth elsewhere.
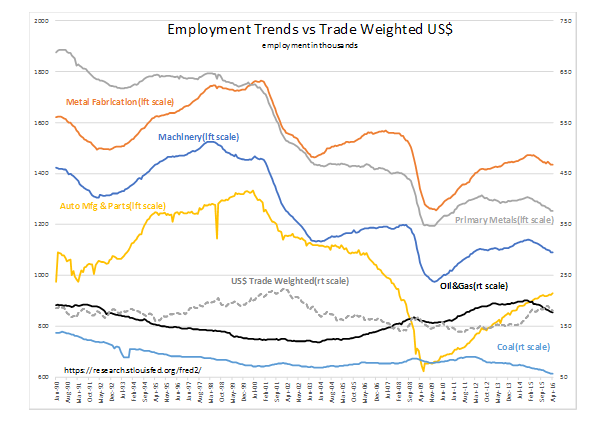
This employment chart reveals something else besides the correlation to the Trade Weighted US$. US manufacturing has been undergoing a revolution of sorts since the mid-1980s. Earlier notes have discussed the ‘Leaning of US Manufacturing’. Many have bemoaned the loss of US manufacturing jobs over the years. Many have blamed at one point Japan, than later they blamed Taiwan and now they blame China for taking jobs from the US. Some use the data represented in this chart to support their arguments. The export of manufacturing to lower-cost venues is the Hallmark of a vibrant and inventive society. The historical record carries many examples. Consumers demand the best and lowest cost goods. Satisfying this demand through global trade has a long tradition. Unfortunately mostly what we teach in business school is mathematics when what we should teach is a historical perspective on human behavior. As the US consumer has demanded better and lower cost products, US manufacturing adjusted by sourcing lower-valued goods to lower-cost countries. Mostly what this meant was finding lower-cost labor to perform low-input-value work. The higher valued/higher skilled work which could not be sourced outside the country remained here where it could be performed best. This is revealed in multiple employment peaks in a number of manufacturing sectors in the 1988-1990 time frame.
US manufacturing began to adopt ‘Lean’ in 1985-1990. Danaher(NYSE- $DHR) was an early leader. Lean is a management/employee collaboration which values human capital higher than financial capital. ‘Lean’ recognizes that one’s employees are the main engine of business. ‘Lean’ management intimately relies on employee input and rewards them monthly from the profits received. The resultant changes in productivity and employee engagement have been staggering. Compared to the late 1980s manufacturing employment is down ~33% while output has soared. Auto industry employment is down more than 30% from 1990 when it produced annual value of $240Bill(16mil vehicles at an avg cost of $15,000) compared to $600Billtoday(17.5mil vehicles at an avg cost of $34,000). The technological advances since 1990 as well as fuel efficiencies are many. The increased value delivered to consumers has been enormous. Even with huge shifts of manufacturing overseas to capture business in those markets, Industrial Production in the US has risen by ~70% from 1989 to 2015. The US remains highly productive. The strong US$ has been a headwind in a number of important industries. I expect it to shift back to its historical trend over time. This will be a positive for our economy. The impact of the short term role that market psychology plays in the Trade Weighted US$ makes near term prediction impossible even though the direction based on long term fundamentals are clear.
Another headwind which could see a reversal comes from the combined Fed and Dodd-Frank regulations. Mortgage credit as shown by the Mortgage Credit Availability Index (MCAI)has been tight compared to 2004 (deemed the normal lending level) and is now becoming evermore tight as the Fed tries to force rates higher by raising the Fed Fund Rate.
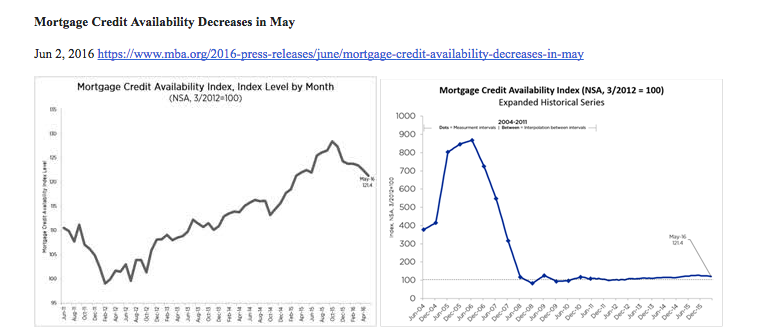
Bank regulation costs have more than doubled under Dodd-Frank. The Fed has more than doubled the reserve level banks must hold vs. what was acceptable in the 1990s. The Fed believes it is helping home buying by keeping 10yr rates low (mtgs are priced off of the 10yr Treasury rate). Add to this mix the fact that many are calling for higher rates in the misperceived belief that ‘higher rates’ spur economic growth. I disagree with this consensus view. History shows that it is wider Credit Spreads (Credit Spread is the difference between bank cost of funds and their lending rate) which are associated with broader economic activity especially mortgage lending. If the long term rates were to rise faster than the rise in short term Fed Fund Rates, then the difference between the cost of funds vs. revenue from loans would widen and lending would indeed expand. This has not occurred! By forcing short term rates higher, the Fed is forcing bank lending costs higher. Banks which have been kept virtually out of their histroric mortgage lending role are pulling back even more. What we need is higher 10yr Treasury rates so that the Credit Spreads widen and banks can be more profitable issuing mortgages. This could eventually occur with a falling Trade Weighted US$ which is also tied to the 10yr Treasury rate. Bank lending rates would rise if a new administration reverses some of the regulatory excess. It is something to be watched.
One cannot ever view economic activity through single reports or single economic sectors. No two economic cycles have ever repeated the past. Any prediction one makes about the future needs to be revisited frequently to reassess that conditions remain in place for the expected outcome. There have been significant rule changes this time. Taken as a whole economic expansion continues even with significant headwinds. It requires attention to detail and patience on the part of investors. All in all, conditions still appear positive for equity investors.
The Value Investor Index
The Dallas Fed reported the 12mos Trimmed Mean PCE inflation index at 1.8%. Inflation remains roughly flat with levels of the past 2yrs.
http://www.dallasfed.org/research/pce/index.cfm

Translating the 12mo Trimmed Mean PCE into the SP500 Value Investor Index shows the SP500 ($SPY) to be within 5% the SP500 Value Investor Index. The SP500 shows little overall speculation. Even though many investors have focused on the F.A.N.G. stocks as the only growth vehicles available, economic fundamentals show that there continues much to like elsewhere. As can be seen in the Employment Trends vs Trade Weighted US$ chart, the 2014-2015 shift in the Trade Weighted US$ has resulted in a recession in the middle of economic plenty. It is in these depressed sectors where the greatest opportunity lays in my opinion. US energy and industry have and continue to make major strides in cost improvement. The past 2yrs well known oil Exploration&Production companies have reported lowering costs by 70%-75%. Large and small industrial companies have raised Gross & Operating Margins in the face of 25% Revenue declines. These were Revenue declines coupled to the Trade Weighted US$ which shifted with Momentum Investor reversal of anticipated high inflation which did not occur. This leaves the Trade Weighted US$ ~25% higher than its long term fundamental trend. It is my expectation that the Trade Weighted US$will drift back to trend the next several years. Predicting exactly when this will occur is not what a Value Investor attempts to do.

Summary
The economy continues to expand and investors continue to be pessimistic. Herein lies the opportunity! The Trade Weighted US$ normalization to its fundamental trend provides added opportunity to invest in those issues which are likely to benefit.


