
Each year I provide an update on the performance of how the value stock screeners performed at Old School Value.
These screeners were pre-defined which I use for idea generation and are also provided free of charge.
To answer a question I get regularly, these screens are open for all to use and not part of the Old School Value stock analysis software. The stock analysis software is focused on fundamental stock analysis.
Before getting into the results, a quick word on my thought process behind the screens.
Background on the Value Stock Screeners
The purpose of any screen or strategy is to try and get it as close to real life as possible.
What I mean is that, screens should factor in things like fees and enough volume to make it easy to replicate and purchase in real life.
The screens you come across on the internet do not include any of these factors. If you were to try and replicate it, you will always under-perform the screen by a large margin and wouldn’t be able to purchase many of the stocks too.
A lot of research papers also do the same thing. It’s great to learn from, but ultimately, it is more theory than practicality.
That’s where I’ve tried to make it different. I want ideas and screens that I can get actionable ideas from. For that reason the following requirements have been included into each value screen.
- Financial stocks and ADR’s have been eliminated because I’m trying to get as accurate results as possible.
- No Chinese companies
- No mining stocks
- No utility stocks
- Minimum volume and price need to be met to make it purchasable
- For screens with a lot of small caps, slippage of 3-5% is included. For other screens a slippage of 1% is used.
- No shorting
- 1.5% portfolio fees included
- Limited to 20 stocks
- Maximum purchase sizing set to 5% since no sane person will put down 20% of their portfolio to a single stock if the screen displayed just 5 results.
Value Stock Screeners: Take a Look at the 2013 Results
Here’s how each screen performed at the end of each quarter in 2013.
These are not quarterly results, but YTD results at the end of each quarter.
 2013 Performance at the End of Each Quarter | Click to Enlarge
- Green shows the percentage by which the screen beat the index
- Red shows the percentage by which the screen under-performed the index
The first and most obvious point is that except for the Graham Checklist Screen, all the screeners did very well by the end of the year.
Q1 started off slowly where mostly all the screens were under-performing. I recall being worried that it would be a bad year for value strategies, but that goes to show how short term my thinking was.
Although 2013 was a year where all stocks and mostly all portfolios were raised to another level, these value strategies performed extremely well.
Value Stock Screeners – Quick Explanations of Each Screen
You can find more detailed descriptions of each screen from the screener page, but here is a quick overview of each in the order of 2013 performance.
Piotroski Best: Looking for just 3 stocks from the original Piotroski score. Simplifying and keeping things simple.
Negative Enterprise: There was a CFA article written about this idea here and here. Companies with negative enterprise values are flush with cash, beaten down and have a bad reputation often making it great investments as long as you can close your eyes and stomach the wild ride.
FCF Cow: Stocks increasing FCF on a yearly basis. Emphasizing profitable and solid companies.
NNWC Increasing: NNWC stands for Net Net Working Capital and this screen looks for companies improving the tangible assets on the balance sheet.
Insider Buys: Stocks with insider buying.
Graham Formula: Based on Graham’s growth formula to value stocks.
NNWC: Purely a net net screen looking for extremely cheap stocks on an asset basis.
Low Expectations: Companies with a low PE with low market expectations.
Share Buybacks: Companies buying back their own shares make for good investment ideas.
Piotroski: Stocks matching all 9 points in the original Piotroski score.
CROIC: Cash Return On Invested Capital. Instead of just looking at ROIC, looking at the ROIC based on cash gives insight into how well the business is managed and cash is deployed by management.
Altman Z: Looking for healthy companies.
NCAV: Net Current Asset Value. The original method for calculating net nets. Cheap stocks.
Graham Checklist: The worst performing screen to date. Graham had a checklist that he used to measure stocks against. The screen attempts to replicate the best performing points from the checklist.
Finally, All Stock Screen Performances from 1999 – 2013
Here’s a breakdown of how each screen has performed since 1999 along with the total and annualized returns.
Net nets have performed the best to date.
The Graham Checklist screen has been a disappointment and will soon be deleted from the screeners as it doesn’t seem to be able to generate any alpha.
Does this mean that Graham’s original checklist no longer works?
Maybe.
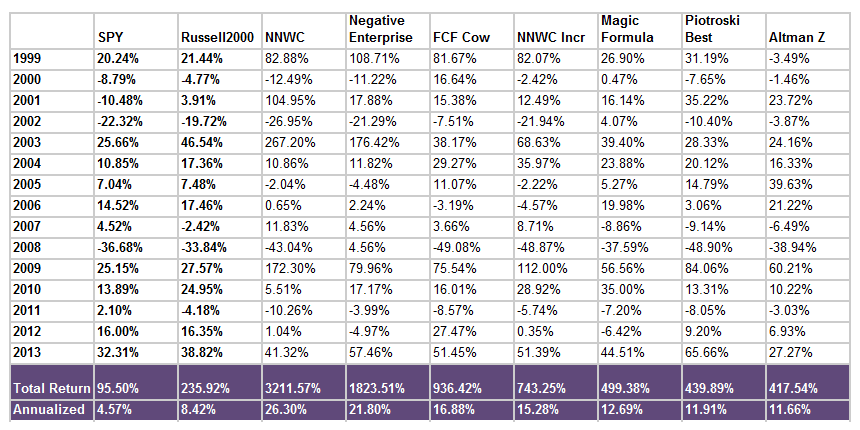 Value Stock Screener Annual Performances | Click to Enlarge
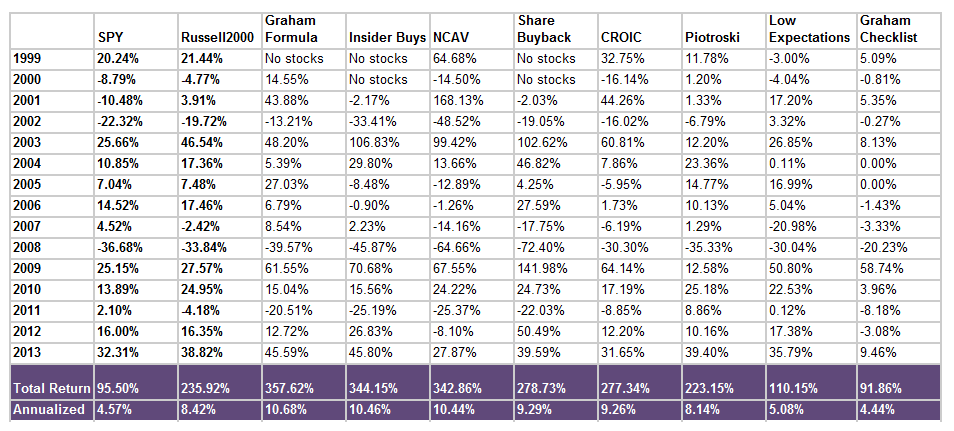 Value Stock Screener Annual Performances | Click to Enlarge
Value Stock Screeners – The Best Value Screen of 2013
The Piotroski Best Screen had a staggering 65.66% return.
The Piotroski Best Screen is simply a screen that was created with the intention to see which of the original 9 criteria in the Piotroski score help maximized returns.
You can read which criteria are the best in the Best Piotroski Combination Backtest.
Starting 2014, here are the 20 stocks that made up the portfolio and how each stock performed.
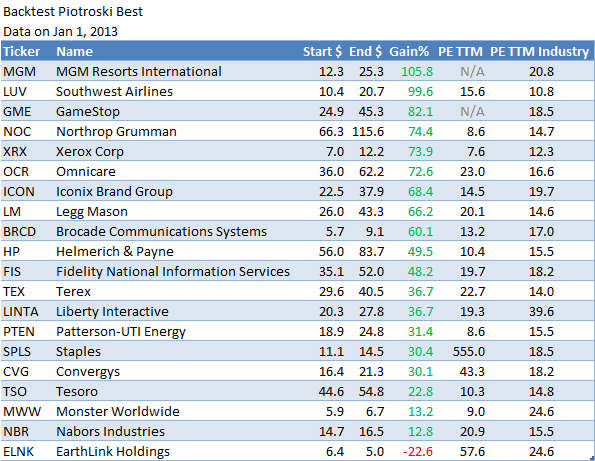 The 20 Stocks from the Piotroski Best Screen in 2013
Just one stock was down for the whole year. Quite a feat.
Although none of my personal portfolios follow any quant strategy 100%, this is an area that I am interested in trying out.
Of the 20 stocks you see here, if I had to make a decision, I would not have invested in many of them. Thankfully, a benefit of creating a mechanical portfolio is that the stocks are very diversified and not clustered around one single sector.
For busy folks, the time saved by just buying and selling once a year is a big plus.
Value Stock Screeners: The 2014 Best Piotroski Combo Stocks
Now take a look at the stocks in the 2014 list.
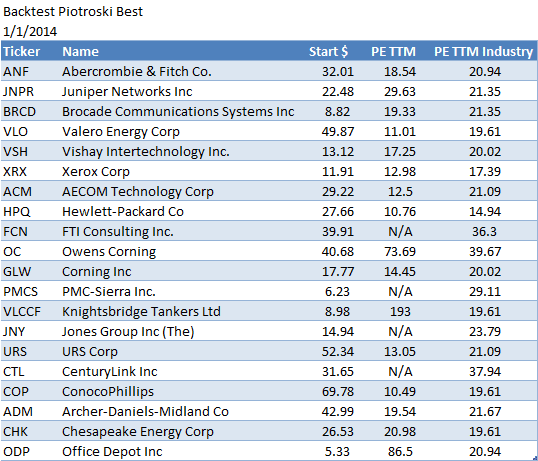 The 2014 Best Piotroski Combo Stocks
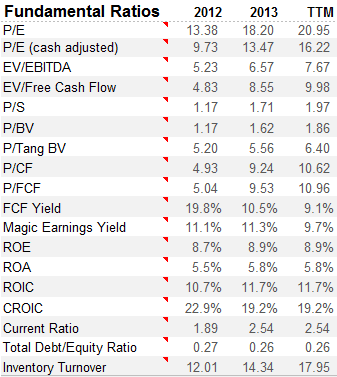
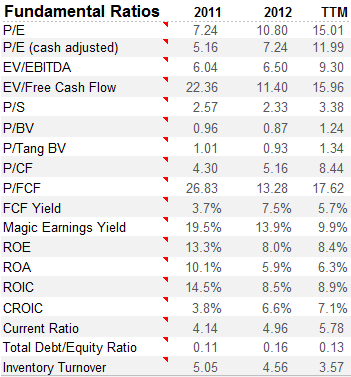
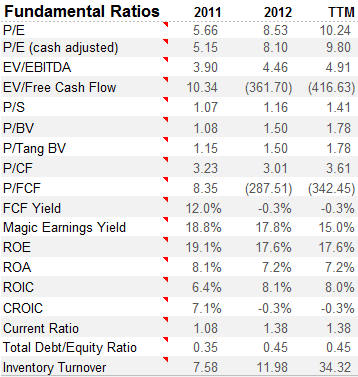
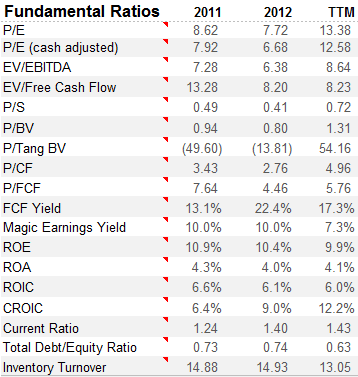
Here are some valuation stats for several companies I have chosen at random. The valuations have been calculated by the OSV stock analysis software.
Brocade Communications (BRCD)
 Brocade Communications | Click to Enlarge
Corning (GLW)
ConocoPhilips (COP)
Xerox (XRX)
Disclosure
No positions
Value Stock Screeners was first published at old school value.
You can read the original blog post here The 2013 Value Stock Screeners Performances.


