Americans take great pride in their work ethic. America is after all the most overworked country on the planet. There are however some people and some cities that tend to work harder than others at their job. In order to rank the hardest-working cities in America, Kempler Industries recently analyzed data from the U.S. Census Bureau from nearly 200 cities across the U.S. with a population of 150,000 or more. They then ranked each city from hardest-working cities to the least based on five key metrics:
Q2 hedge fund letters, conference, scoops etc
- Average commute time
- Average workweek hours
- Percentage of workforce population aged 16-64
- Percentage of senior workforce aged 65 and up
- The percentage of unused vacation days
Each metric was graded on a 100-point scale. Here are some key takeaways from the analysis from Kempler Industries:
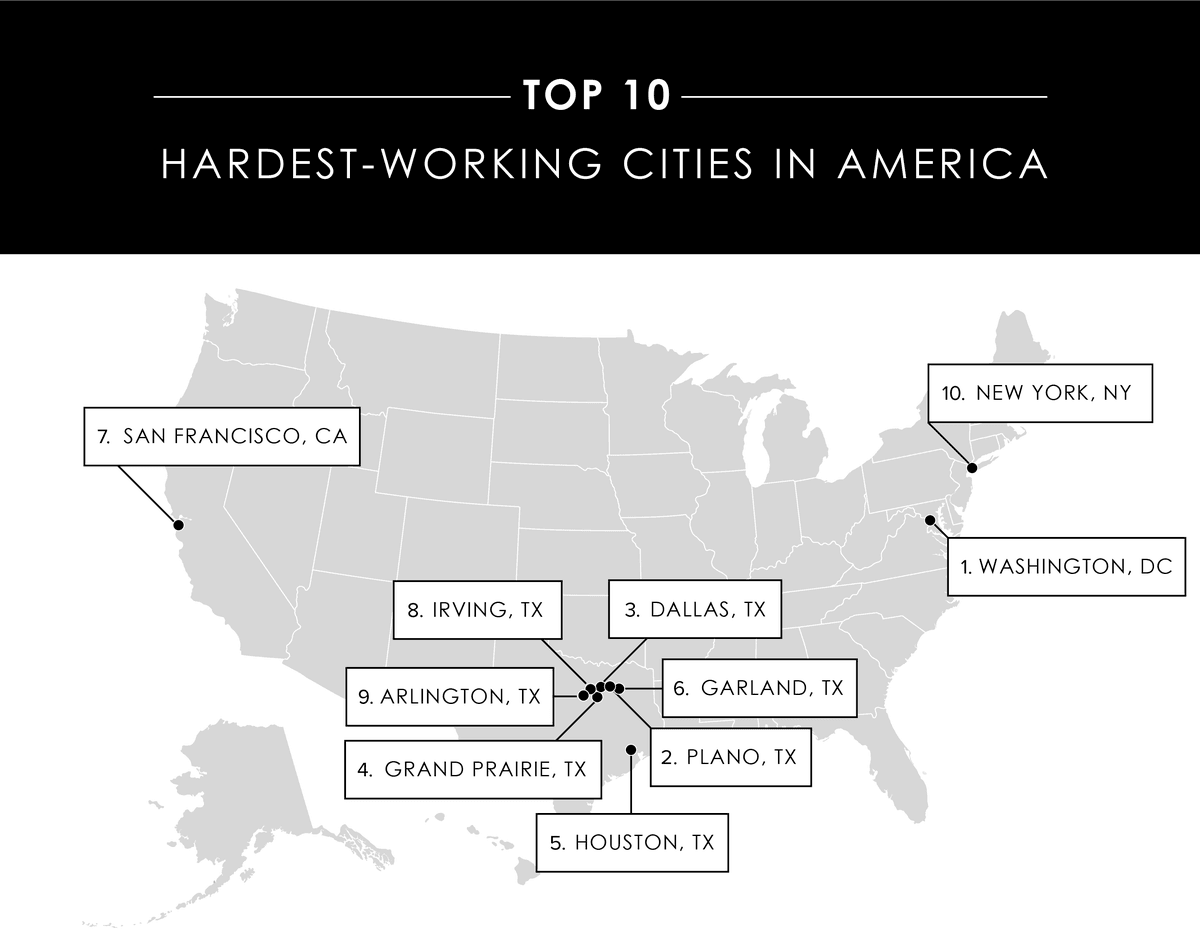
- Washington D.C. tops our list at No.1 with an overall score of 90 points out of 100. D.C. exceeds the national average commute time, average workweek hours and percent of seniors still in the workforce.
- Seven out of the top ten hardest-working cities within our list are located in the Lone Star State. A big factor for cities in Texas ranking so well is the high number of senior citizens in the workfoce.
- With the exception of Irving, every Texas city within the top 10 has an average commute that is longer than the national average (26.4 minutes).
- In terms of population, the largest cities on our list are Chicago and New York City while Pembroke Pines, Florida and Grand Prairie, Texas are the smallest cities on our list.
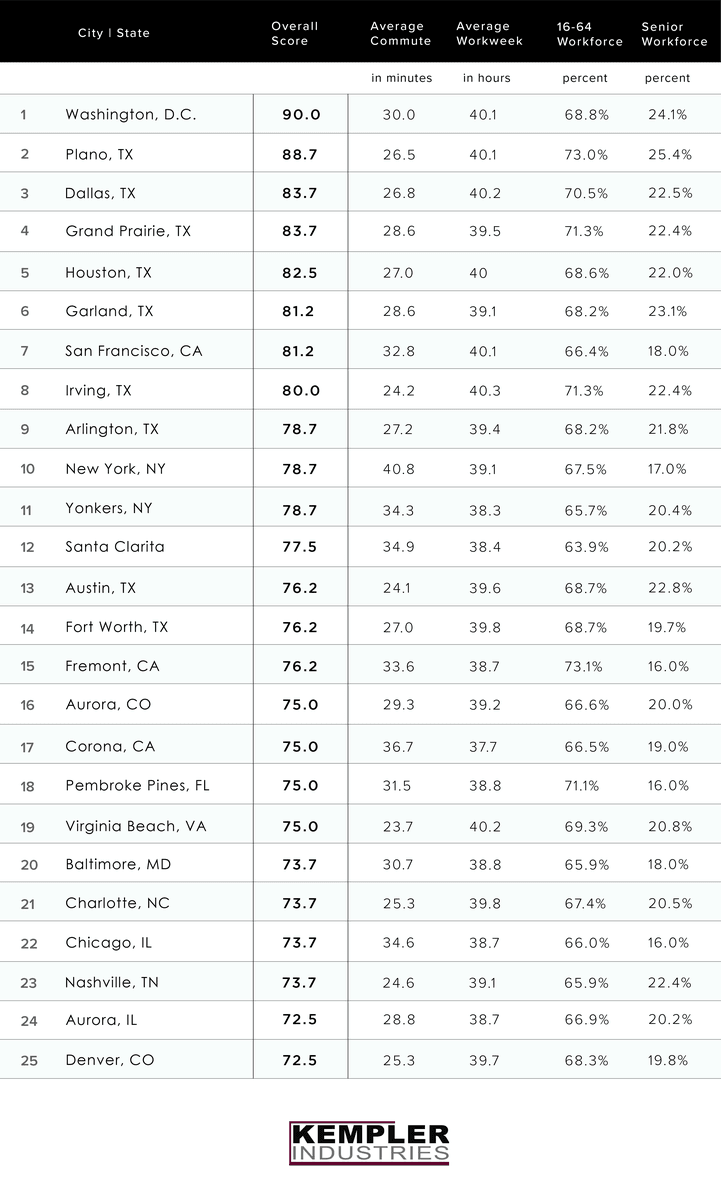
Listed below are the top 25 hardest-working cities in the United States:
- Washington D.C (Overall score of 90.0)
- Plano, Texas (Overall score of 88.7)
- Dallas, Texas (Overall score of 83.7)
- Grand Prairie, Texas (Overall score of 83.7)
- Houston, Texas (Overall score of 82.5)
- Garland, Texas (Overall score 81.2)
- San Francisco, California (Overall score of 81.2)
- Irving, Texas (Overall score of 80.0)
- Arlington, Texas (Overall score of 78.7)
- New York, New York (Overall score of 78.7)
- Yonkers, New York (Overall score of 78.7)
- Santa Clarita (Overall score of 77.5)
- Austin, Texas (Overall score of 76.2)
- Fort Worth, Texas (Overall score of 76.2)
- Fremont, California (Overall score of 76.2)
- Aurora, Colorado (Overall score of 75.0)
- Corona, California (Overall score of 75.0)
- Pembroke Pines, Florida (Overall score of 75.0)
- Virginia Beach, Virginia (Overall score of 75.0)
- Baltimore, Maryland (Overall score of 73.7)
- Charlotte, North Carolina (Overall score 73.7)
- Chicago, Illinois (Overall score of 73.7)
- Nashville, Tennessee (Overall score of 73.7)
- Aurora, Illinois (Overall score of 72.5)
- Denver, Colorado (Overall score of 72.5)
The full analysis of the hardest-working cities can be seen in the graphic below.


