
ETFGI reports ETFs and ETPs listed in the US gathered 28 billion US dollars in net inflows in April
LONDON — May 14, 2018 — ETFGI, a leading independent research and consultancy firm on trends in the global ETF/ETP ecosystem, reported today that ETFs and ETPs listed in the US gathered US$28.00 billion net inflows during April 2018, after suffering net outflows of US$10.60 Bn in February and US$2.56 Bn in March, according to ETFGI’s April 2018 US ETF and ETP industry landscape insights report. Year-to-date net inflows into US listed ETFs/ETPs reached US$93.22 Bn at the end of April which is significantly less than the US$169.71 compare to this point last year. (All dollar values in USD unless otherwise noted.)
Q1 hedge fund letters, conference, scoops etc, Also read Lear Capital
Highlights
- ETFs and ETPs listed in the US gathered $28.00 billion net inflows during April 2018, after suffering net outflows in prior 2 months
- US-listed Fixed Income ETFs/ETPs gathered $13.74 Bn net inflows during April 2018, the largest since October 2014, which saw $16.87 Bn in net outflows
- In April 2018, 15 new ETFs/ETPs were launched by 12 providers while 59 ETFs/ETPs closed by 8 providers
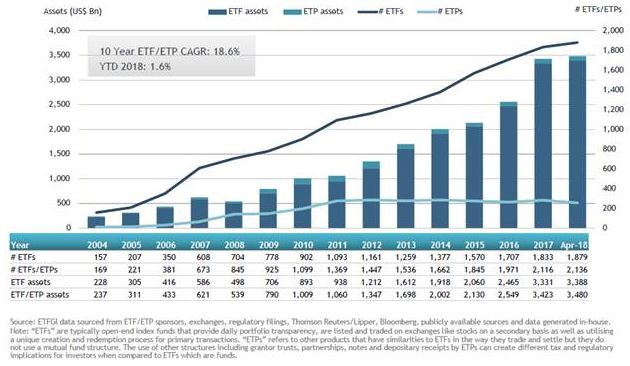
At the end of April 2018, the US ETF industry had 1,879 ETFs, assets of $3.388 trillion, from 121 providers on 3 exchanges. At the end of April 2018, the US ETF/ETP industry had 2,136 ETFs/ETPs, assets of $3.480 Tn, from 140 providers on 3 exchanges.
Overall the assets invested in ETFs/ETPs listed in the US increased by $38.60 Bn during April 2018. The increase of 1.12%, from $3.441 Tn at the end of March 2018 to $3.480 Tn at the end of April, also represents the highest monthly growth in assets since January 2018, which saw a monthly increase of 6.38% from $3.423 Tn to $3.642 Tn.
US ETF and ETP asset growth as at the end of April 2018
In April 2018, ETFs/ETPs saw net inflows of $28.00Bn. Fixed income ETFs/ETPs gathered the largest net inflows with $13.74 Bn, followed by equity ETFs/ETPs with $10.12 Bn.
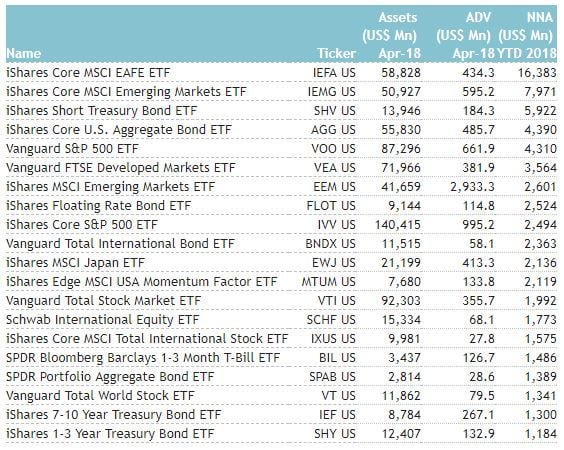
The majority of these flows can be attributed to the top 20 ETFs by net inflows, which collectively have gathered $68.82 Bn during 2018. The iShares Core MSCI EAFE ETF (IEFA US) on its own accounted for net inflows of $16.38 Bn.
Top 20 ETFs by net YTD net inflows: US
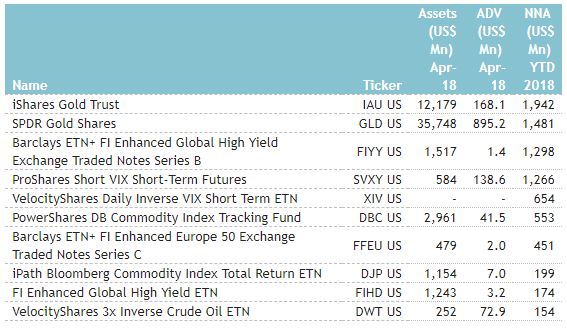
Similarly, the top 10 ETPs by net inflows collectively gathered $8.17 Bn during 2018.
Top 10 ETPs by YTD net inflows: US
During April investors chose to move from US Equity ETFs to Fixed Income and Commodities products.
Please contact us at [email protected] if you would like further information on our services.


