
Hedging when the market is up is like buying an umbrella when it’s sunny out: you’ll be protected when it rains
Buying An Umbrella Before It Rains
Those of you who’ve been to Manhattan when it’s raining will be familiar with the site of people selling umbrellas on the street. You generally don’t get the best prices on umbrellas on that situation -you’re better off buying one in a store when it’s sunny out, and having it with you when it starts raining. Hedging the market when it’s up is somewhat analogous.
For Slopers who are considering insurance now, I’ll show a way to hedge market risk below using the SPDR S&P 500 ETF (SPY).
Protecting A $500k Stock Portfolio With SPY
Here’s a simple way of protecting a stock portfolio against further market risk using optimal, or least expensive, puts on SPY. For the purposes of this example, I’ll assume your portfolio is worth $500,000, that it’s closely correlated with SPY, that you have enough diversification within it to protect against stock-specific risk, and that you can tolerate a decline of up to 20% over the next several months (if you have a smaller risk tolerance, you can use the same approach entering a smaller decline threshold).
Step 1
Divide $500,000 by the current price of SPY, which was $289.97 as of Monday’s close, to get 1,724 (rounded).
Step 2
Scan for the optimal, or least expensive, puts to protect against a >20% decline in 1,724 shares of SPY over the next several months (screen captures below via the Portfolio Armor iPhone app).
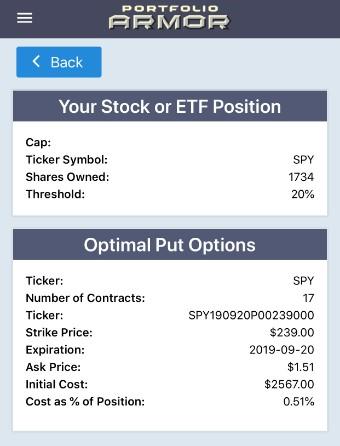
Note the cost here: $2,567, or 0.51% of portfolio value, which was calculated conservatively, using the ask price of the puts.
Step 3
Round up the number of SPY shares to the nearest 100 and repeat step 2.
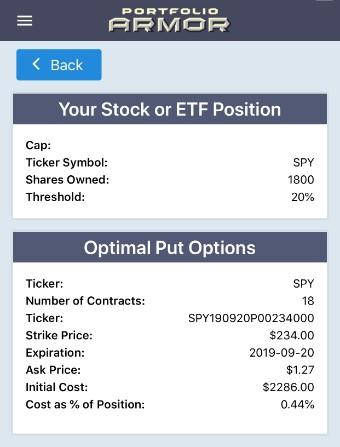
Note that, in this case, it’s cheaper to hedge rounding up to the nearest round lot: The cost was $2,286, calculated conservatively, at the ask. That’s about 0.44% of a $500,000 portfolio.
Continuing This Approach
If you hedge your portfolio this way and repeat the process before the hedge expires in September, you’ll be protected against >20% declines during each time period, and your annual hedging cost will be about 1.02% (assuming, for the sake of simplicity here, that hedging costs are similar in September). So, if we don’t slide into a bear market, you should generate a somewhat competitive return: Roughly, the market’s return minus 1.02%.
A Potentially Market-Beating Approach
The approach above might beat the market over a time period that includes a severe decline, but it’s not going to beat SPY in a bull market, because of the drag of hedging cost. To beat SPY while hedging in a bull market, you need to beat the market by enough with your underlying securities that your performance, net of your hedging cost, is still higher than the market. You’re not going to do that with a diversified portfolio that’s highly correlated to SPY. You need a different approach to have a shot at that.
One such different approach is the concentrated, hedged portfolios generated by Portfolio Armor. Since 2017, I’ve been presenting these portfolios to Marketplace subscribers and tracking their performance in real time. Here’s how the ones hedged against >20% declines have done so far (performance represents six-month periods starting on the starting date).
PORTFOLIOS HEDGED AGAINST > 20.0% DECLINES
| Starting Date | Expected Return | Actual Return | SPY Return |
|---|---|---|---|
| June 22, 2017 | 8.43% | 20.08% | 11.27% |
| August 31, 2017 | 8.03% | 9.10% | 10.87% |
| October 12, 2017 | 9.00% | 2.12% | 5.38% |
| October 19, 2017 | 10.07% | 13.05% | 6.08% |
| October 26, 2017 | 8.57% | 9.39% | 5.13% |
| November 2, 2017 | 9.77% | 10.67% | 3.11% |
| November 9, 2017 | 9.59% | 4.45% | 5.34% |
| November 16, 2017 | 8.95% | 5.18% | 6.22% |
| November 22, 2017 | 9.39% | 7.31% | 5.90% |
| November 30, 2017 | 8.55% | -4.74% | 3.80% |
| December 8, 2017 | 8.34% | 4.50% | 5.73% |
| December 14, 2017 | 7.75% | 17.49% | 5.87% |
| December 21, 2017 | 9.33% | 12.33% | 3.36% |
| December 28, 2017 | 9.92% | 9.45% | 1.99% |
| January 4, 2018 | 9.65% | 12.92% | 0.59% |
| January 11, 2018 | 8.93% | 9.14% | 1.12% |
| January 18, 2018 | 9.40% | 7.89% | 1.55% |
| January 25, 2018 | 9.82% | 6.19% | 1.10% |
| January 29, 2018 | 9.29% | 10.48% | -0.30% |
| February 1, 2018 | 9.00% | 0.84% | 0.59% |
| February 8, 2018 | 7.35% | 12.49% | 11.75% |
| February 15, 2018 | 8.19% | -6.14% | 4.08% |
| February 22, 2018 | 8.54% | 6.90% | 6.73% |
| March 1, 2018 | 7.98% | 6.66% | 9.37% |
| March 8, 2018 | 8.32% | -3.20% | 5.82% |
| March 15, 2018 | 7.90% | 2.50% | 6.68% |
| March 22, 2018 | 7.62% | 9.58% | 11.74% |
| March 22, 2018 | 7.65% | 8.82% | 11.74% |
| March 29, 2018 | 8.26% | 7.72% | 11.48% |
| April 5, 2018 | 10.59% | 0.20% | 9.33% |
| April 12, 2018 | 9.36% | 4.63% | 4.71% |
| April 19, 2018 | 11.04% | 17.36% | 3.67% |
| April 26, 2018 | 10.32% | 17.44% | 0.53% |
| May 3, 2018 | 10.08% | 7.54% | 4.47% |
| May 10, 2018 | 8.64% | 2.61% | 3.03% |
| May 17, 2018 | 11.53% | -4.37% | 1.54% |
| May 24, 2018 | 11.74% | -6.80% | -2.63% |
| May 31, 2018 | 7.76% | -4.70% | 2.66% |
| June 7, 2018 | 8.62% | -11.51% | -4.12% |
| June 14, 2018 | 13.05% | -9.78% | -5.71% |
| June 21, 2018 | 12.44% | -17.22% | -11.31% |
| June 28, 2018 | 11.80% | -7.95% | -7.58% |
| July 5, 2018 | 9.11% | -13.03% | -6.61% |
| July 12, 2018 | 9.97% | -8.37% | -6.32% |
| July 19, 2018 | 10.82% | -10.54% | -3.83% |
| July 26, 2018 | 9.87% | -6.70% | -5.21% |
| August 2, 2018 | 9.76% | -3.91% | -3.36% |
| August 9, 2018 | 12.78% | -1.44% | -4.12% |
| August 16, 2018 | 14.60% | 0.79% | -1.33% |
| August 23, 2018 | 15.20% | 0.71% | -1.30% |
| August 30, 2018 | 13.16% | -7.98% | -2.99% |
| September 6, 2018 | 13.66% | -4.72% | -2.75% |
| September 13, 2018 | 17.32% | -5.23% | -2.25% |
| September 20, 2018 | 13.73% | -0.28% | -2.66% |
| September 27, 2018 | 14.71% | -7.29% | -2.80% |
| October 4, 2018 | 10.11% | -0.33% | 0.25% |
| October 11, 2018 | 9.61% | 4.16% | 6.99% |
| Average | 10.09% | 2.39% | 2.18% |
Table via Portfolio Armor.
I post these portfolios each week because investors start putting money to work at different times, but the idea, obviously, isn’t to invest in a different portfolio each week, the idea is to invest a third or a half of your money in one portfolio now, then do the same in two or three months, and then when each portfolio expires in six months, to repeat the process. As you can see above, on average, the performance of these portfolios, net of hedging cost, outperformed SPY, despite some individual portfolios lagging.
Wrapping Up
An advantage of both of the approaches above is that they don’t just limit your downside risk, but your fear of further declines as well, since you know your downside risk is strictly limited. Being able to take a breath and consider your next move, without risking everything, can be beneficial in volatile markets. Another advantage is that having appreciated put options, as you would in both approaches in the event of significant market declines, gives you dry powder: Something you can sell for cash, which you can use to put to work if you’re an enterprising investor and see compelling opportunities. That’s true of holding cash as well, but an advantage of optimal put options is that since it often only takes a small dollar amount of them (about 0.44% of your portfolio, in the second hedge above) to give you the protection you need, you can keep most of your money invested in up markets without the drag of a large cash position.


