
Trading energy ETFs outside of US exchanges can be tricky, as it often means lower liquidity and some latency, but is it worth trying? Definitely!
Q2 2021 hedge fund letters, conferences and more
Let’s do a comparative study between the WTI Crude Oil (CL) and an Exchange-Traded Fund (ETF) tracking this energy commodity as the underlying asset.
Prelude
In the previous two-part series (see Part I & Part II), we presented different ways to trade energies such as stocks, ETFs, CFDs and futures. We saw that picking the right instrument or vehicle depended on businesses, regions, risk profiles, psychology, etc. So, today, as an example, we will compare the well-known WTI Crude Oil (CL) futures contract (quoted in US dollars) with a 2:1 (2x) leveraged ETF traded in Toronto, in Canadian dollars.
Crude Oil (CL) Futures Vs. Horizons BetaPro Crude Oil Leveraged Daily Bull ETF
Here is a comparison table between the two products:
| CME/NYMEX WTI Crude Oil Futures Codes: CL (Standard), MCL (Micro) Currency: USD Specs: CME (standard), CME (micro) |
Horizons Crude Oil 2x Daily Bull ETF Code: HOU Currency: CAD Specifications: Horizons ETFs |
| WTI Crude Oil Futures: CL (Exchange: CME Group) Higher liquidity No management fees Higher leverage 24-hour access Cross-margining Tighter correlation to physical market |
Other Crude Oil ETFs (quoted in USD): USO/UCO/DBO/USL/SCO/OILK/OIL Lower liquidity Low management fee Lower leverage (2:1) and less risk Easy access to the market Less maintenance for position rolling Read more: CME Group – ETF Database |
| Brent Crude Oil Futures: B (Exchange: ICE) |
Brent Crude Oil ETF: BNO (ETF Database) |
And here are the latest charts:
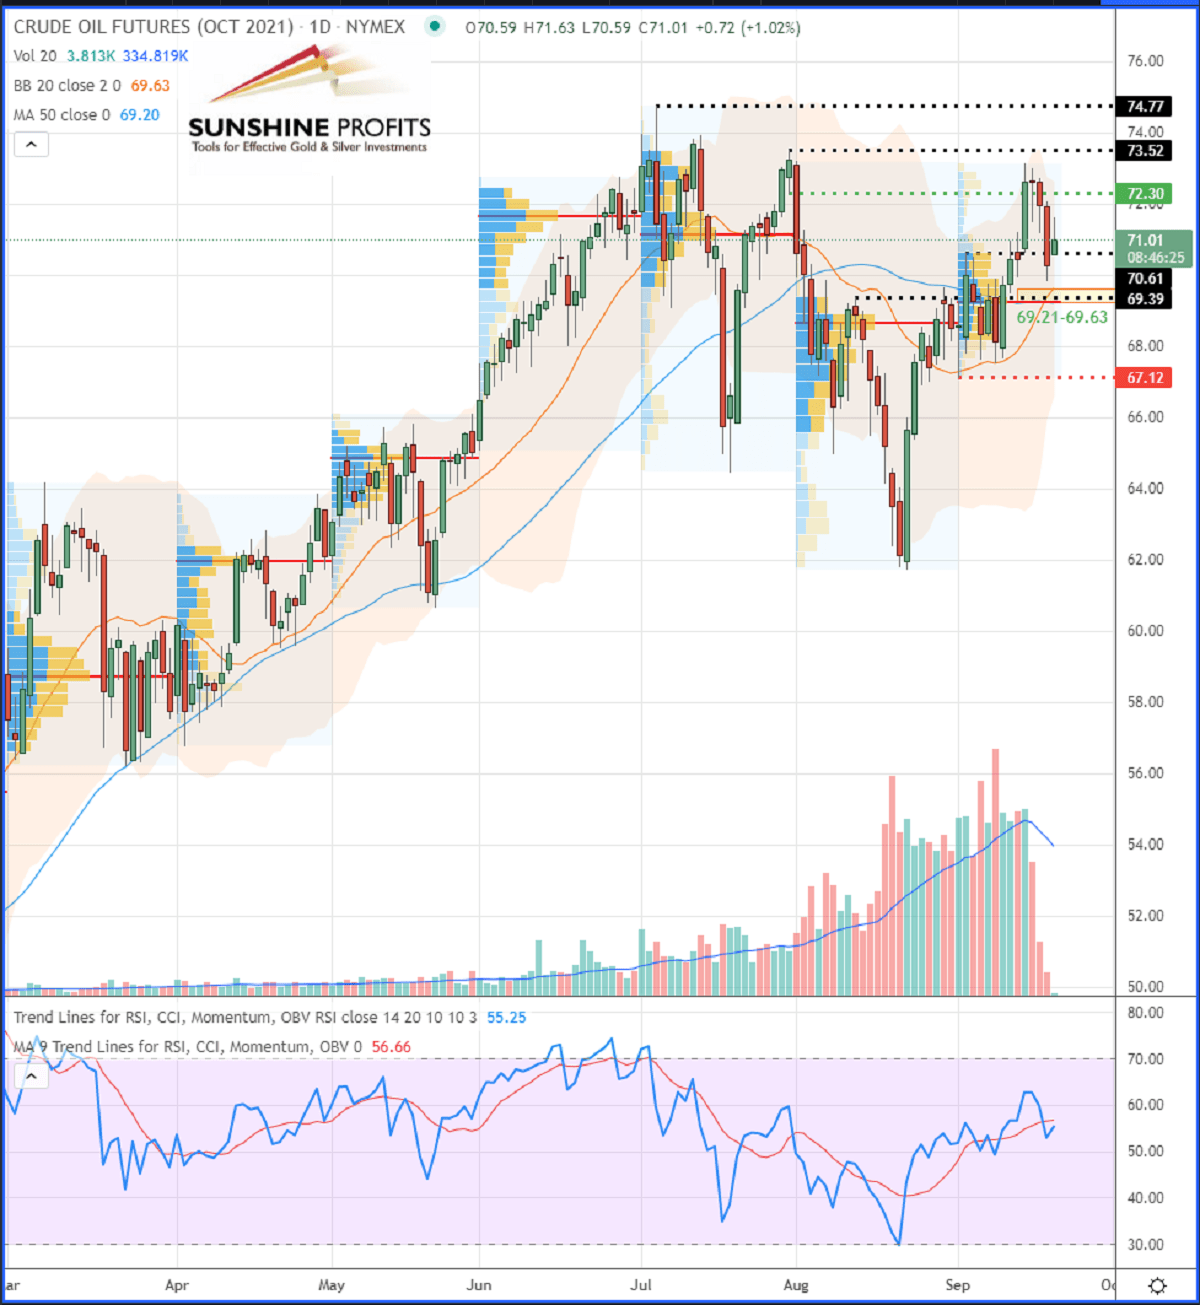
- CL:
- HOU:
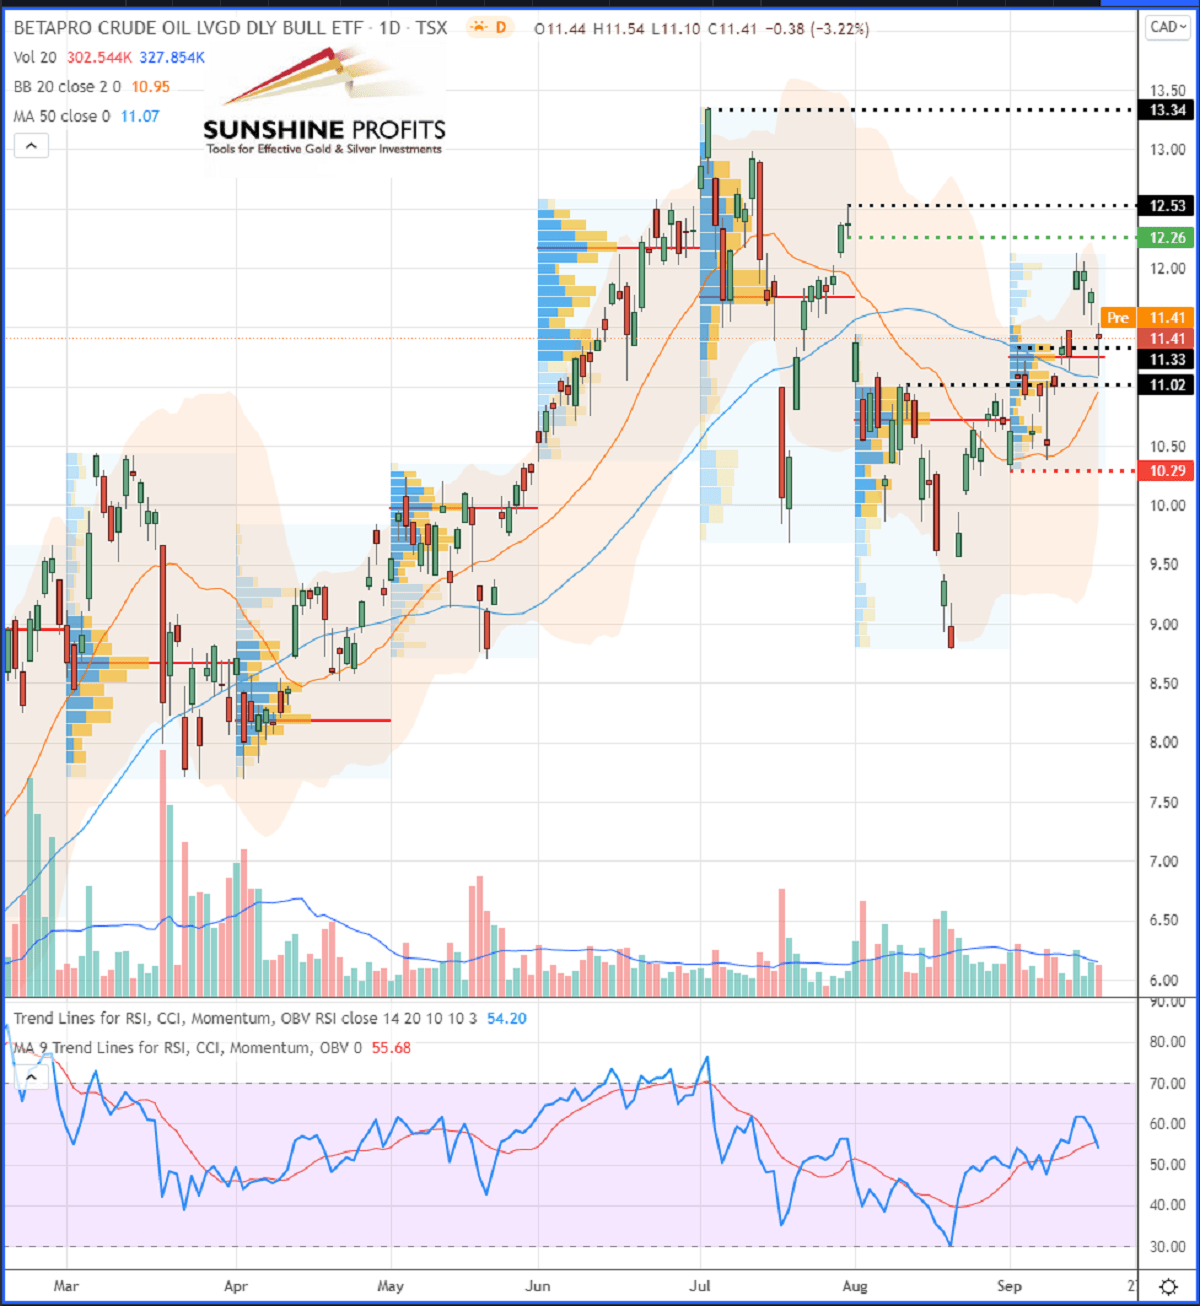
As an example, we take our last oil trading alert about CL Futures that we somehow “translate” into HOU (ETF). It is noticeable that the prices on the HOU ETF are completely different from the Futures, even though the correlation coefficient is 1 since they are perfectly correlated. Therefore, if both assets move similarly together (as the ETF by definition tracks the WTI Crude Oil futures), it is quite simple to draw the same levels that we give for CL to HOU (or any other ETF trackers).
However, some pricing discrepancies may appear on the ETF chart sometimes. Those are due to a delay in tracking the underlying asset, notably due to the fact that the ETF tracker has to catch-up with the Futures prices at the open (because there is no complete market close for the futures the latter benefits from extended market hours). Some other slight discrepancies in the ETF pricing are also present due to the fact that the fund offering the product automatically processes to contract-rolling on the underlying futures. In short, we could equate the ETF to a hypothetical lagging (delayed) indicator of the WTI CL futures.
Volume Profile Accuracy
By comparing the volume profiles respectively for both products, we can also notice some differences. For example, the Volume Point of Control (VPOC) is not always located at the same place, since there are much fewer trade prices (and obviously much less traded volume) for ETFs than Futures. So, the accuracy of Volume Areas and their respective VPOCs (red horizontal lines) could be discussed. However, would that make them less reliable levels for ETFs? Not sure.
Actually, it may sometimes give another view of the market by removing some noise – therefore, they could potentially be used to confirm levels in a clearer way while ignoring/excluding the Asian-Pacific trading session as well as the first half (morning and early afternoon) of the European one, since the HOU prices will be based solely on the Canadian trading session that overlaps most of the Western region, including the U.S. trading session.
Dichotomy Method
A good way to spot the same levels on such a chart (of a product quoted in a different price scale or in another currency) could be to use some sort of “dichotomy” method: drawing the supports and resistance levels from extremities to the center to mark the swing lows/highs and then recentre the scope by taking some mid-point levels. For example, by drawing each support and resistance levels in the same manner as we provide them on futures charts to “translate” them into the desired correlated instrument such as an ETF. This method could help spot the equivalent entry/exit levels, stop loss, targets, etc.
An alternative would consist of using the same indicators on both charts to show similar data at similar levels, like, for example, Fibonacci levels, Ichimoku Kinko Hyo, Pivot Points, etc.
And finally, setting price alerts on the underlying chart in order to enter the trade through a market order in the ETF is possible as well, however it’s not very convenient…
In conclusion, we explored in this article the different ways to trade our Oil and Gas Trading Alerts using a broader range of products: instruments with more or less leverage, in your local currency, different time zones and other price scales. However, the abovementioned methods are practicable as long as the main condition is respected: it requires at least a very high correlation between the main instrument(s) for which we provide alerts and your favourite product(s).
Like what you’ve read? Subscribe for our daily newsletter today, and you’ll get 7 days of FREE access to our premium daily Oil Trading Alerts as well as our other Alerts. Sign up for the free newsletter today!
Thank you.
Sebastien Bischeri
Oil & Gas Trading Strategist
The information above represents analyses and opinions of Sebastien Bischeri, & Sunshine Profits’ associates only. As such, it may prove wrong and be subject to change without notice. At the time of writing, we base our opinions and analyses on facts and data sourced from respective essays and their authors. Although formed on top of careful research and reputably accurate sources, Sebastien Bischeri and his associates cannot guarantee the reported data’s accuracy and thoroughness. The opinions published above neither recommend nor offer any securities transaction. Mr. Bischeri is not a Registered Securities Advisor. By reading Sebastien Bischeri’s reports you fully agree that he will not be held responsible or liable for any decisions you make regarding any information provided in these reports. Investing, trading and speculation in any financial markets may involve high risk of loss. Sebastien Bischeri, Sunshine Profits’ employees, affiliates as well as their family members may have a short or long position in any securities, including those mentioned in any of the reports or essays, and may make additional purchases and/or sales of those securities without notice.


