Stanphyl Capital commentary for the month of July 2019, discussing a sign of a massive looming economic slowdown.
Friends and Fellow Investors:
For July 2019 the fund was down approximately 4.8% net of all fees and expenses. By way of comparison, the S&P 500 was up approximately 1.4% while the Russell 2000 was up approximately 0.6%. Year-to-date 2019 the fund is up approximately 11.8% while the S&P 500 is up approximately 20.2% and the Russell 2000 is up approximately 17.7%. Since inception on June 1, 2011 the fund is up approximately 83.9% net while the S&P 500 is up approximately 162.9% and the Russell 2000 is up approximately 107.9%. Since inception the fund has compounded at approximately 7.8% net annually vs 12.6% for the S&P 500 and 9.4% for the Russell 2000. (The S&P and Russell performances are based on their “Total Returns” indices which include reinvested dividends.) As always, investors will receive the fund’s exact performance figures from its outside administrator within a week or two and please note that individual partners’ returns will vary in accordance with their high-water marks.
Q2 hedge fund letters, conference, scoops etc
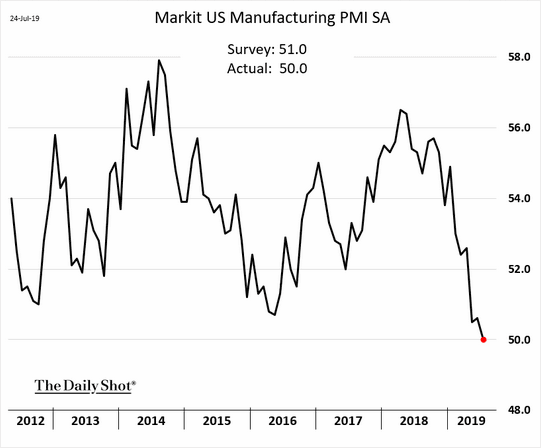
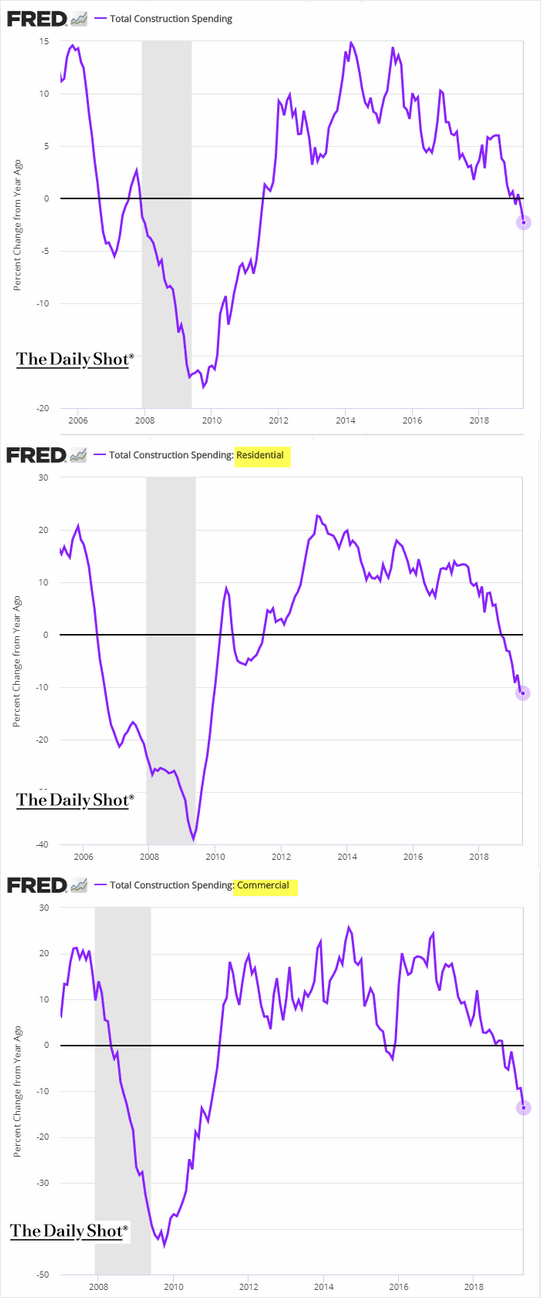
The fund remains very net short, as I continue to believe we’re about to enter a bear market for U.S. stocks as the U.S. economic slowdown worsens. Here are some charts explaining why:
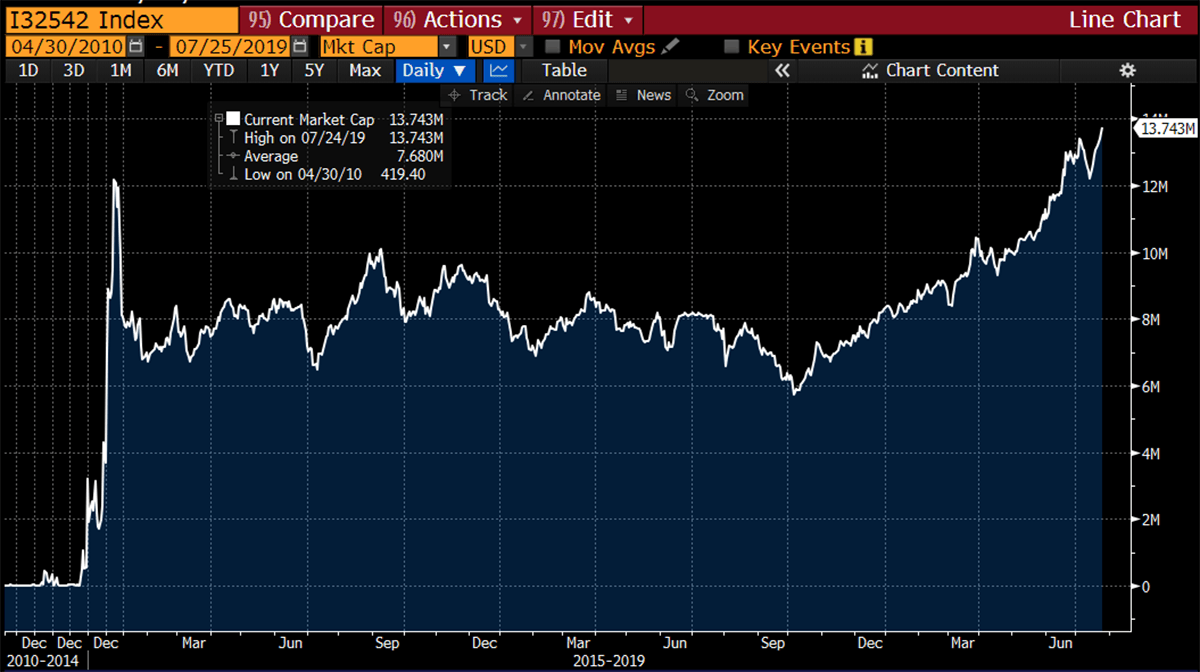
…while global negative yielding debt (a sign of a massive looming economic slowdown) has broached the insane level of nearly $14 trillion:
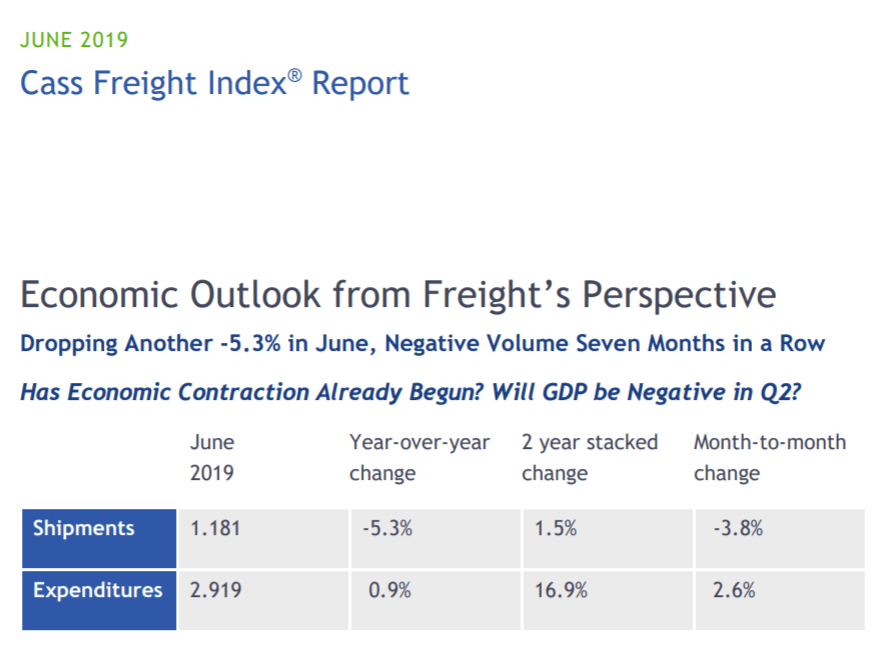
And have a look at how ugly U.S. rail traffic is and the horrible Chicago PMI out today.
Anticipated 2019 Fed rate cuts of 50-75bp (starting with today’s 25bp) will do little to prevent this slowdown; here’s how things look now relative to the peak of the last bull market, in September 2007 when the Fed did a 50bp cut:
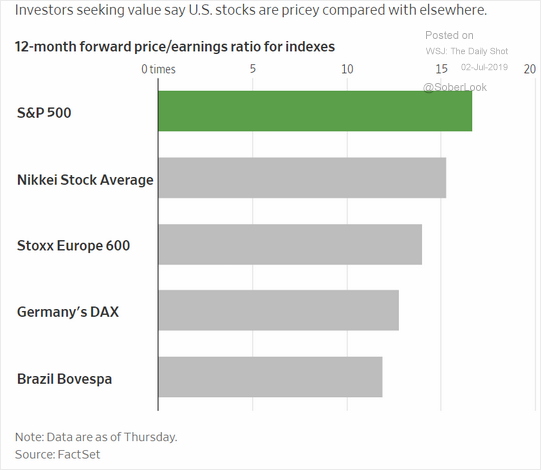
And for those who think that low interest rates necessarily mean higher PE multiples, here’s an excellent rebuttal to that in a single chart (although this is somewhat distorted by the fact that the U.S. has more growth stocks):
And keep in mind that much of the U.S. bull market’s rise came from corporate buybacks, and those tend to slow drastically when the economy does. As the looming recession unfolds and those buyers disappear, look out below.
On the other hand, our current, short-lived era of net “quantitative tightening” among the big three central banks (the Fed, ECB and BOJ) is over. The Fed’s balance sheet contraction stops in August, and it’s rumored that in October the ECB will resume printing money to buy still more bonds (while, the BOJ continues doing so). I’m very aware of the effect these moves may have on already grossly inflated asset prices, and thus am a bit more cautious in my short bias than I had been before the new European QE was telegraphed at July’s ECB meeting. On the other hand, this ECB stupidity may blow up its banks and perhaps even the euro, resulting in all kinds of stock market carnage. After all, if printing money is the solution to economic stagnation, why bother collecting taxes and having government budgets? (There’s no need to answer that—it’s a rhetorical question!) So we’re short, but a bit more cautiously so.
Seeking the most overvalued of all stock indices (and the one least likely to be bought by overseas investors with their newly printed yen and euros), we thus remain short the Russell 2000 (IWM), which has a trailing twelve-month GAAP PE ratio of 40 on what I believe are peak earnings, while 35% of its constituents lose money. I also put on a short position in the S&P 500 (SPY) last Friday evening, immediately after Trump said it’s likely China won’t make a trade deal until after the 2020 Presidential election. As rumors of such a deal have been a huge positive driver of stocks and international trade is much more important for the constituents of the S&P 500 than it is for those in the Russell 2000, I think this position is worth a shot with a tight stop set at SPY’s all-time high, just 25bp above our short basis.

