
Excerpted with permission from the publisher, Wiley, from Strategic Risk Management by Campbell Harvey, Sandy Rattray and Otto Van Hemert. Copyright © 2021 by John Wiley & Sons, Inc. All rights reserved. This book is available wherever books and eBooks are sold.
Q1 2021 hedge fund letters, conferences and more
Seeking Crisis Alpha – Introduction
The idea of risk management is to provide some protection during adverse events. However, the cost of that protection must be balanced against the benefit. For example, in a strategy that uses costly long put options to eliminate the downside, the portfolio’s return should not be greater than the risk-free rate. By contrast, we focus on the idea of crisis alpha, which uses dynamic methods that lower risk and also preserve excess returns. In this sense, they provide alpha when it is most needed – during crisis periods.
Trend following is one technique that works especially well with a crisis-alpha strategy. Theoretically, trend-following strategies sell in market drawdowns (mimicking a dynamic replication of a long put option) and buy in rising markets (mimicking a dynamic replication of a long call option). This resembles a long straddle position and induces positive convexity. While it is possible to purchase the long straddle directly, that is expensive. Implementing a trend-following strategy is not expensive, but it is not as reliable as taking option-based insurance.
Much of our book focuses on these costs and benefits. We assess the after-cost performance of different strategies (including option-based strategies) in various risk-on events.
Our starting point is a deep dive into time-series momentum (trendfollowing) strategies in bonds, commodities, currencies, and equity indices between 1960 and 2015. Over the last few years, institutional investors have turned to futures trend-following strategies to provide “crisis alpha.”2 Our analysis shows that these momentum strategies performed consistently both before and after 1985, periods which were marked by strong bear and bull markets in bonds, respectively.
We document a number of important risk properties. First, returns are positively skewed, which is consistent with the theoretical link between momentum strategies and a long option straddle strategy. Second, performance was particularly strong in the worst equity and bond market environments, giving credence to the claim that trend following can provide equity and bond crisis alpha. Putting restrictions on the strategy to prevent it being long equities or long bonds has the potential to further enhance the crisis alpha, but reduces the average return. Finally, we examine how performance has varied across momentum strategies based on returns with different lags and applied to different asset classes.
Backdrop
Government bonds have experienced an extended bull market since 1985. This is illustrated in the left panel of Figure 1.1, where we plot the cumulative excess return of U.S. 10-year Treasuries and the S&P 500 index, relative to the U.S. T-bill rate. This shows a steady increase in cumulative bond returns since 1985. The right panel of Figure 1.1 plots the drawdown level, which rarely exceeded 10 percent for bonds in the post-1985 period. A trend-following strategy holding a (predominantly) long bonds position would have benefited from the consistent upward direction after 1985.
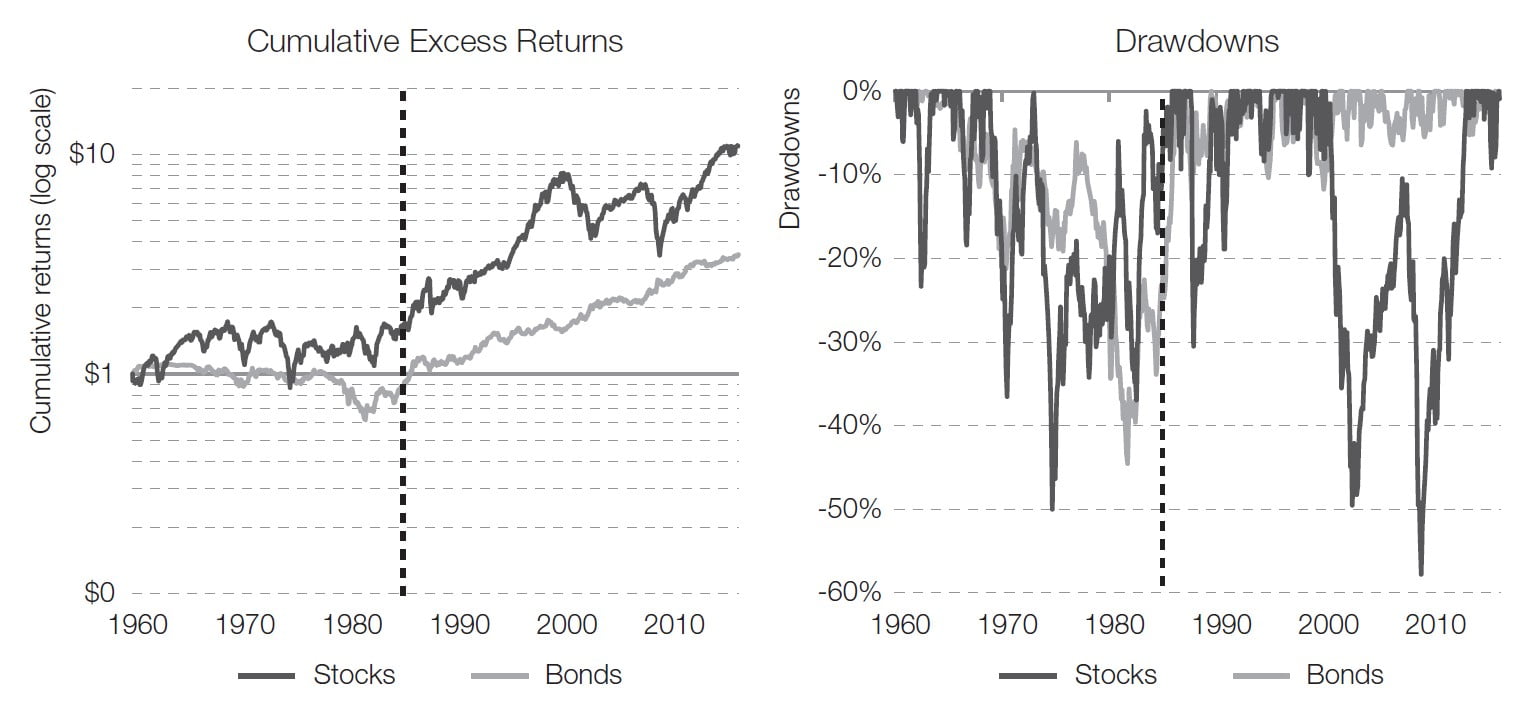
FIGURE 1.1 Cumulative excess returns and drawdowns in the stock and bond markets (1960–2015). The left panel shows the cumulative return of stocks (S&P 500 index) and bonds (U.S. 10-year Treasury), in excess of the U.S. T-Bill rate. The right panel shows the drawdown relative to the highest cumulative return achieved to date for both stocks and bonds. The data period is January 1960 to December 2015 and the dashed, vertical line separates the pre- and post-1985 period.
The strong bond performance was driven by significant interest-rate compression. U.S. yields fell from almost 16 percent in the early 1980s, to below 2 percent in March 2016. While in some countries yields have turned slightly negative, most economists believe yields cannot become very negative, and as such we are unlikely to see a similarly large yield compression in future decades. In light of this, it is natural to ask whether, in the absence of a bond market tailwind, trend-following strategies can maintain performance and protect against bond-market stress similar to that seen in the 1960s, 1970s, and early 1980s.
Outline
In this chapter we seek to shed light on three questions by studying trendfollowing strategies from 1960 onwards:
- Should we expect futures trend following to be profitable in an environment where government bond yields rise?
- Are the protective characteristics of trend following confined to equities, or do they work for government bonds as well?
- Is it possible to improve the protection characteristics of a futures momentum strategy by removing the ability to be long equities?
Importantly, there is a stark difference between the pre-1985 period and the post-1985 period. Between 1960 and 1985, bonds experienced negative excess returns on average while stock markets provided modest positive average excess returns and quite frequent drawdowns (Figure 1.1).
In the first section, we discuss the available data to ground our understanding of the markets between 1960 and 1985. The second section defines a straightforward momentum strategy. Extending our analysis back to 1960 requires us to use monthly data and augment the available history of futures and forward returns with proxies based on cash returns, financed at the local short-term rate.
In the next section, we show that strategies based on the past four months’ returns (lag 1 to 4) experience consistently strong performance, as do strategies based on returns of almost a full year ago (lags 9 to 11). However, strategies based on returns at the intermediate horizon (lags 5 to 8) underperform consistently over time and across asset classes. Next, we form a momentum strategy that places weights on historical lagged returns, such that it best matches the representative BTOP50 managed futures index (we label our strategy momCTA) and find that this replicating strategy allocates almost all weight on lags 1 to 4, thus largely ignoring the predictability of lags 9 to 11.
In the two sections that follow, we show that momCTA inherits two important risk characteristics that are particularly associated with momentum strategies based on recent returns. In the section about skewness, we show that momCTA has positively skewed returns, in particular when returns are evaluated over multiple months. (We specifically consider 3- and 12-month evaluation windows.) We argue this result is intuitive and related to the strategy’s property of adding to winners and cutting losers, which is similar to the dynamic replication of a long option straddle position.
Then, in the section on crisis alpha, we show that momCTA performed particularly well in the worst equity and bond market environments, giving empirical support to a claim that trend-following can provide crisis alpha for both equities and bonds. Performance was strong in not only the worst but also the best equity and bond market environments, revealing a well-known equity market smile and a lesser-known, but even more pronounced bond market smile.
We find that the equity and bond crisis alpha was further enhanced when we restricted the equity and bond position to be non-positive. However, this comes at the cost of lower general performance and unfavorable cross-market effects. Indeed we find that a non-positive equity (bond) restriction worsened the performance during bond (equity) market declines.


