The Second Wave of Covid-19 and Government Choices by Greg Presseau of Perennial Capital
Q1 2020 hedge fund letters, conferences and more
- Since 2013, there are on average 79.25 deaths/month of blacks/Hispanics/whites attributed to police. This means there are plenty of sparks to trigger unrest due to injustice
- US inequality has been increasing for over 40 years and the economic fallout from COVID-19 is making income inequality more pronounced
- Income inequality can be modeled as a function of income tax rates for highest earners and the number of manufacturing jobs in the US
- A second wave of Covid-19 should hit the US
- Due to income inequality and the unlikelihood that we address this problem, we see a much higher probability that the government will push to forge forward with limited lockdowns regardless of the risk we run to older, at risk individuals
Deaths With Police Involved
The economic and societal shock from COVID-19 have become visible with increased civil unrest. While some have stated that the current unrest is attributed to police brutality or excessive force toward blacks, there is no clear trend in police brutality. That is, deaths from police involved incidents have been steady from 2013 to 2019 according to the chart below of police involved deaths by race:
Source: mappingpoliceviolence.org
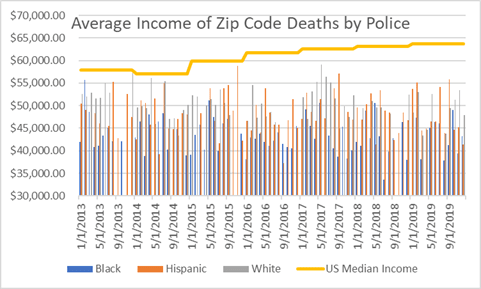
Notice that there is no clear trend by race. Looking at median income for the zip codes where the deaths occurred, we see that most of the deaths are in low income areas:
Source: mappingpoliceviolence.org, University of Michigan
Notice that on average all deaths occur in low income areas with black deaths occurring in communities that are .66 Z-score below the average median-income. The key take-away is that there are deaths every month from police involved incidents and at a time of high-income inequality across races, there will be plenty of sparks to unify.
Income Inequality: Tax Rates And Jobs
Looking closer at income inequality, we see the that the Gini Index for the US has been steadily going up since at least the 1960’s. Thomas Picketty wrote a 753 page book on income inequality and the following is a broad generalization, but when doing a multi-regression, we only need to look at two factors that explain most of the problem of income inequality in the US: the tax rate for the highest earners and manufacturing jobs in the US. Looking at these two factors by year, we get an R^2 of .86 for our sample back to 1967 to 2018:
Source: BLS, US Census, CP Capital
It is unlikely that we see any changes to either input in the near term: tax rates most likely will not get adjusted and manufacturing jobs cannot be created overnight (although longer term it looks likely that we see jobs come back).
The Second Wave Of Covid-19
A second wave of COVID-19 is increasingly looking likely. Looking at southern states, we see that the three-week average in cases is starting to increase:
Source: Wikipedia
Now that we have more data, rather than taking forecasts for deaths, we can look at NYC data to quantify who is at risk by age and health. By interpolating and extrapolating from NYC stats, we can create the below death rate curves:
Source: NYC.gov, CP Capital
What we see is that the death rate goes up exponentially over 55 years of age.
Putting Everything Together
When we look at income inequality, COVID-19, the economy and how we should respond to the second wave, it is clear that we cannot stop the economy again. In order to illustrate, let’s look at the below probability tree of whether we see mass civil unrest under a lockdown and no lockdown response to a second wave:
Source: CP Capital
To clarify, we see a 65% chance of mass protests returning if we lockdown. This was calculated by looking at the number of jobs lost due to a second lockdown and goes up exponentially as more people are pushed into poverty. We expect the number of people living in poverty to double if we have a second lockdown as businesses are already short on cash from the first lockdown.
If we do not lockdown, we see a lower economic hit but the number of deaths range from 3.3-13mm. We calculated the number of deaths by taking the curves above and multiplied by the percent of the population that normally contracts the flu at 5-20% and then multiplied that number times the death rate and estimate of population for each age.
With the economic and health risks quantified, we can now make some assumptions on how to respond to the second wave of COVID-19. Clearly the loss of 3.3-13mm is scary. However, if we are to go into another lockdown, we will undoubtedly have a spark to trigger mass unrest due to the fact that deaths from police incidents are roughly two a day. Whether this unrest spirals out of control is too hard to predict but there is a real risk that the permanent loss of jobs results in an unsustainably high income inequality. High unemployment with a loss of confidence for a brighter future are the ingredients for revolution.
To summarize the above, the society we are trying to save by locking down again may not exist after we emerge from locking down. Furthermore, the risk of dying is much lower for younger people and near zero for healthy, young individuals. Due to the risk of losing society and lower death rate for much of the population, we believe the best decision will be to move forward with keeping the economy running.
In a follow up to the above we will will address the longer term question of inequality, bringing jobs back to the US and ultimately, increasing tensions with China.


