Why Use The Price Earnings Ratio by Federico Garcia
This blog has previously shown statistical evidence that shows one should avoid high PE (price earnings) ratio stocks. A number of academic studies back this up. And value investors like Warren Buffett or Benjamin Graham essentially look for “cheap” stocks with good growth prospects. A quick way to see if a stock is “cheap” or “expensive” it to look at the PE ratio or the ratio of the price you pay to the earnings or profit you get associated with the stock.
Q4 2019 hedge fund letters, conferences and more
Filtering for the Right Stock
If I were to filter for a low PE stock today (March 2020) which one would I pick? Looking at big blue-chip companies, JPMorgan Chase, the biggest bank in the US, has had strong results recently. Its earnings grew from $9 a share in 2018 to $10.72 a share in 2019. It had positive results in both its lending business and its other financial businesses. Looking at today’s price of $120 and dividing by the $10.72 a share 2019 earnings gives JPMorgan Chase a PE ratio of 11.
What’s a “blue chip” company with a high price earnings ratio that I would avoid? Let’s look at Johnson & Johnson (JNJ). Although Johnson & Johnson, the biggest consumer goods company, saw revenues grow slightly in its fiscal year ended in 2019, the growth was minimal. The sales growth rate in 2019 was close to 0%, with the weakest results in the baby care segment. Compare that to the sales growth rate in 2018, which was almost 7%. Looking at today’s price of $140 and dividing by the $5.63 a share 2019 earnings, gives Johnson & Johnson a PE ratio of 25.
Comparing Results
The price earnings ratio tells a little bit about the business of these companies and a little bit about the price of their stocks. If PE ratio was your only guide you would choose to pay less for earnings. So you would buy JPMorgan at a PE ratio of 11, rather than Johnson & Johnson with its 25 PE ratio.
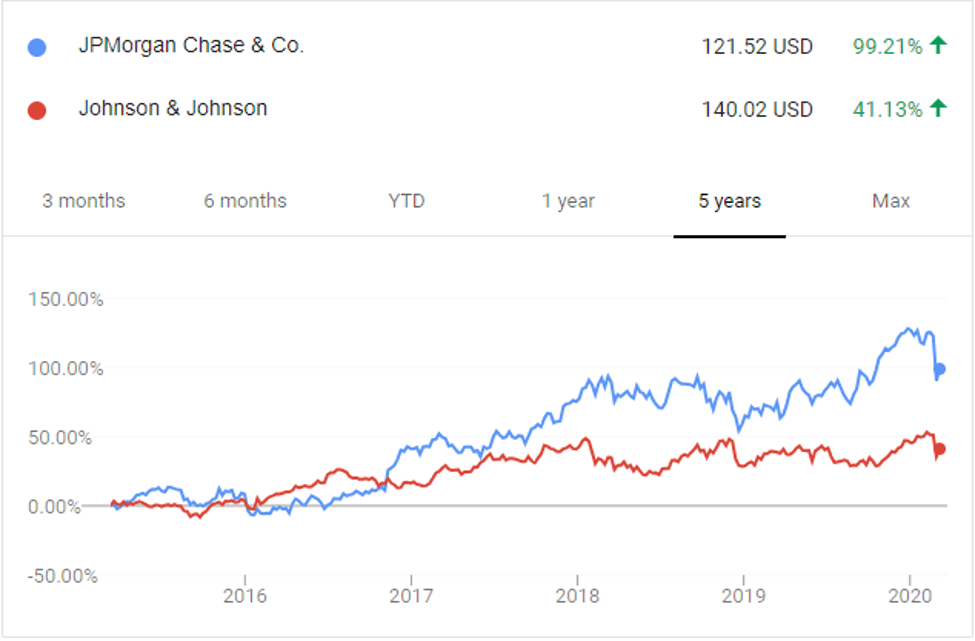
In this case, performance history would back you up. JPMorgan’s stock price (the blue line below) has outperformed if you look at the past 5 years or past 1 year. I would expect this trend to continue. Academic studies suggest that JPMorgan’s below average PE Ratio should increase over time or revert to the mean. That would mean the price would go up.
Exceptions to the Rule
Although using this statistical takeaway is a great way to make sure you generally get good returns over time, there are exceptions to the rule. For example, over the past ten years or so many tech stocks have had price earnings ratios well above average, but have shown great performance in terms of their price growth. Take Amazon (AMZN) for example. It has shown amazing stock price growth with a PE ratio currently at 85, which is extremely high! And sometimes stock prices grow when the companies have no earnings at all. This is often the case with companies in an initial growth stage that exhibit strong sales growth but are reinvesting a lot as well.
Another extreme case is the case of a value trap. Value trap is an investing term for a stock that has a seemingly low valuation, but the stock price never goes anywhere. UBS stock has a PE ratio at 10, which is lower than JPMorgan’s, but its stock price has been stagnant since the Great Recession over a decade ago.
Conclusion
Since there are exceptions to the price earnings ratio rule of thumb, it’s important to understand the growth prospects of the companies you want to invest in. A great way to do this is to look at their quarterly SEC filings and investor relations homepages online.
The Price Earnings Ratio Stock Value Tracker is a great mobile app that provides you with an easy-to-use dashboard that shows you which stocks have low price earnings ratios and which ones have high PE ratios with live stock market data. Click here for more information!
Article by Federico Garcia


