
Overview
In this article, we provide a broad market index review with a 2020 outlook, present an analysis of the S&P 500 Index, highlight the Components of the Otos MoneyTree Avatar before and finally close with an invitation to experience your financial reality as FREEDOM AND EMPOWERMENT.
[bufffett]Q3 2019 hedge fund letters, conferences and more
2020 Outlook
Sell your extended-share-price stocks of companies with falling growth. We are very likely to see lower and potentially much lower share prices as the cyclical decline in growth evolves.
Sell your equity mutual funds and index ETFs. Company growth continues to fall and recently at a more rapid rate. The average gross profit margin fell from the highest level in the 25-year record and these peaks have been a reliable predictor of lower stock prices. The market decline (relative to long treasury bonds) that began last year is now a clear downtrend. The stronger stock market last month lifts shares to the top of that declining trend range and signals a clear sell for stocks.
The Broad Market Index was up 0.16% last week and 53% of stocks out-performed the index.
Do not wait. Act now!
The average sales growth of U.S. companies fell to 8% down from 10% last quarter and 14% at the peak last year. The gross margin also down in the recent quarter for the first time this cycle. This double top-line weakness is very commonly associated with lower stock prices. The population of extended-share-price companies has increased with the rally in shares last month. This provides many good opportunities to sell lower growth companies at attractive prices. Otos will help you find them.
S&P 500 Index
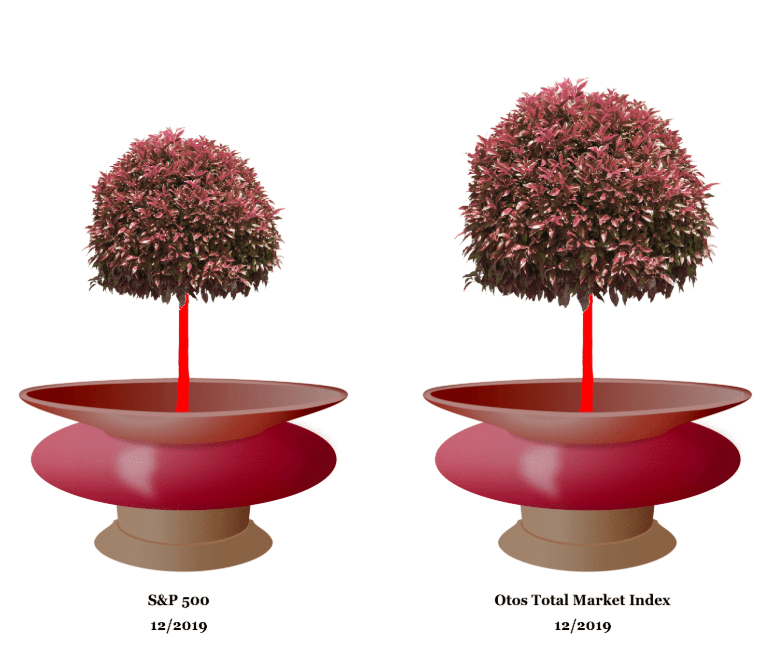
The share price index of the S&P 500 Index has advanced by 30% relative to the Otos Total Market Index since the February 2014 low. Current relative price to sales is near the lowest level in the record of the Index.
Last week the share price index of the S&P 500 Index fell by 1.2% compared to a 0.1% advance for the Otos Total Market Index. Gaining stocks in the S&P 500 Index numbered 148 or 52.1% of the Index total compared to a 28.0% gaining stocks frequency across the 3979 stocks in the Otos Total Market Index (Otos U.S. stocks universe).
We have collected fourth quarter sales data for 271 of the 284 comparable record companies in the S&P 500 Index representing 98% of the capital value. The Index capital weighted average sales growth rate is 6.6%. The proportion of Index market capital accounted for by rising sales growth companies is up to 29.6%, compared to 23.5% last quarter.
Currently, sales growth is low in the record of the S&P 500 Index and lower than last quarter.
The proportion of total market capital accounted for by rising gross profit margin companies is up to 66.6% compared to 53.1% last quarter.
The Index is recording a high and falling gross margin. Inventories are up, diminishing the chance of a further increase in the gross margin. SG&A expenses are high in the record of the Index and falling. That implies that the Index has further capability to accelerate EBITDA relative to sales with lower costs. SG&A expenses are falling at a more rapid rate than the gross margin, producing a rising EBITDA margin. This is a poor-quality growth trend to the extent that lower costs can insulate the bottom line from top line weakness for only a short time. Interest costs are low in the record of the Index and rising. Higher interest costs not only slow the free cash flow growth rate of the Index but are often associated with lower valuation.
Why OTOS and what is the MoneyTree Avatar?
Otos (visit otos.io) makes it possible to make an active decision for every stock that passes your preference search. Once you are logged in, try clicking your portfolio avatar.
It creates a better-than-this search that finds all companies that have at least one attribute that is better than the portfolio average.
Request a Notos or make a transaction to indicate your decision. As we go through the quarterly update Otos manages, learns and accommodates your decisions and preferences, alerting you to any requested developments.
A better-than-this search for a selected attribute is available from the avatar factors link on every company page. Otos is displaying benchmark indexes, sector and industry groups. All accessible from your profile page.
This avatar represents your current portfolio updated for the recent annual financial statements filed with the SEC.
The animation on otos.io represents the changes in avatar attributes over past 14 months. The avatar attributes and correlations with share price are accessible from the company report page.
The more stable the pot appears, the better the attributes. Green and gold are good. Red is bad and the more intense the red the more urgent the call to action.
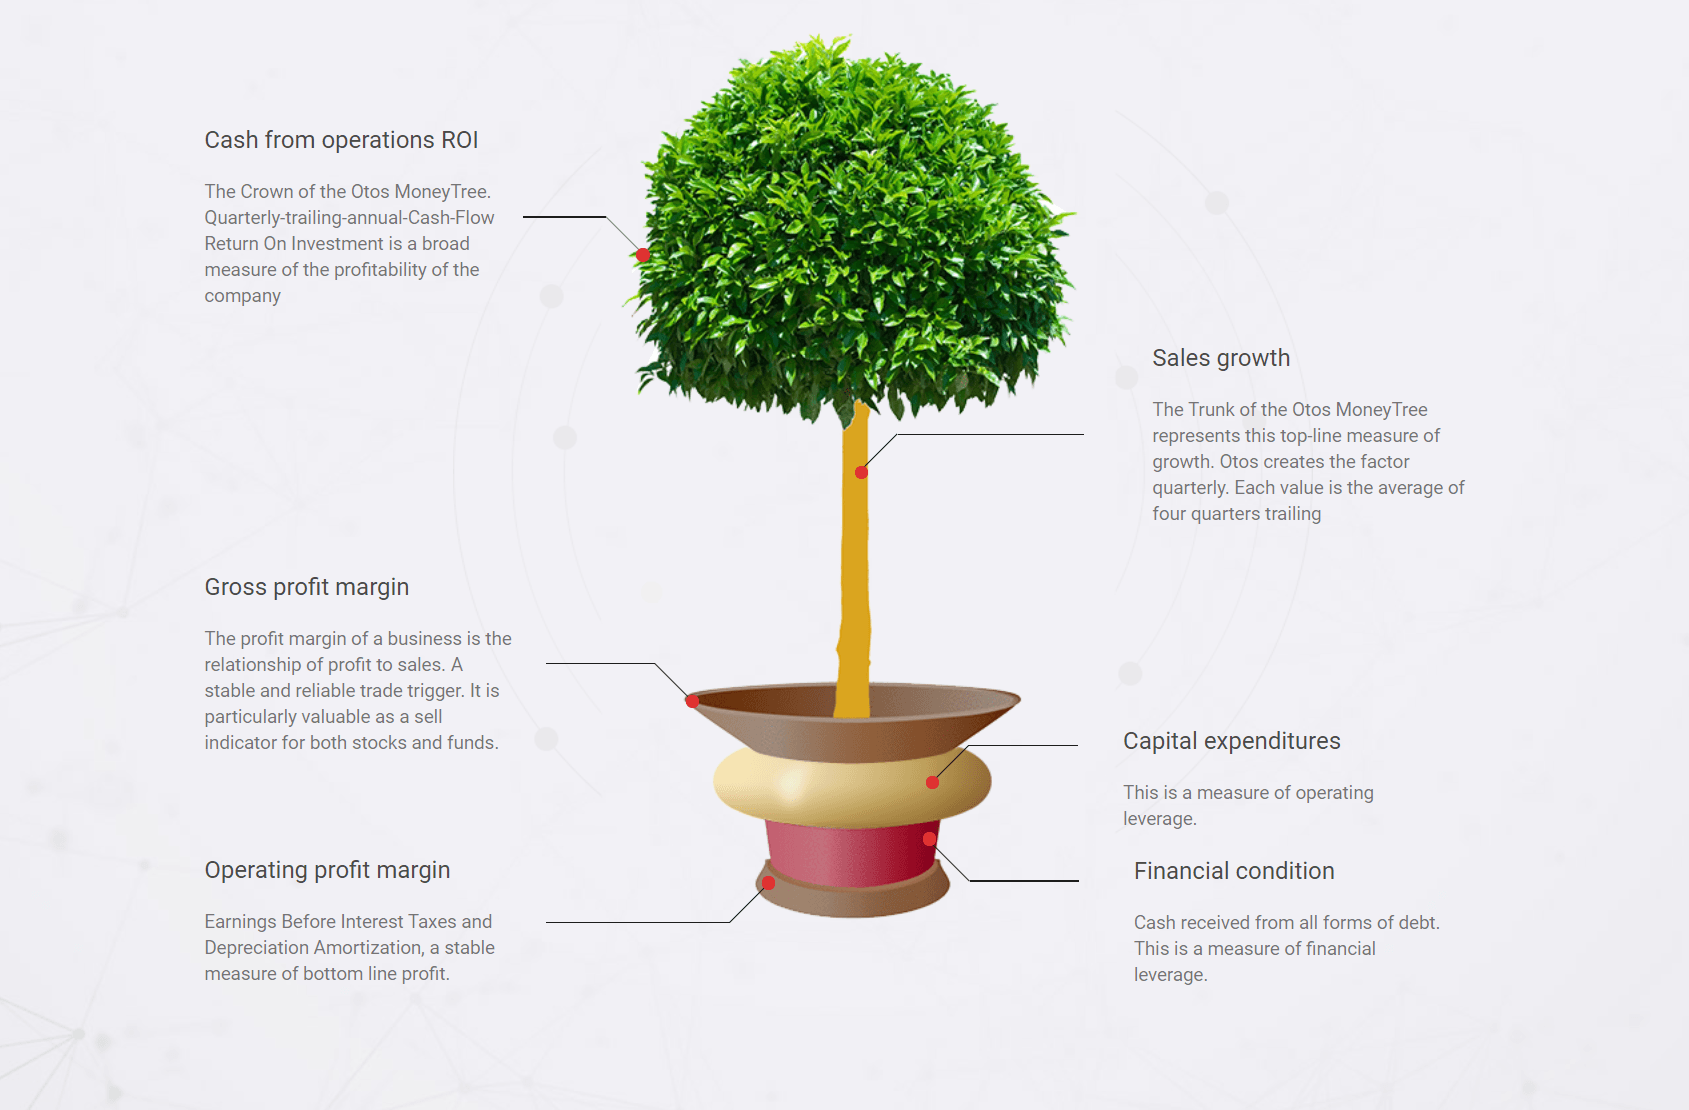
The Components of the Otos MoneyTree Avatar:
Cash from operations ROI: The Crown of the Otos MoneyTree. Quarterly-trailing-annual-Cash-Flow Return on Investment is a broad measure of the profitability of the company.
Sales growth: The Trunk of the Otos MoneyTree represents this top-line measure of growth. Otos creates the factor quarterly. Each value is the average of four quarters trailing.
Gross profit margin: The margin of a business is the relationship of profit to sales. The top rim of the MoneyTree pot displays the gross profit margin. The ratio of sales to variable costs (“cost of goods sold” on most income statements).

Capital expenditures: The convex of the pot illustrates cash expended for the purchase and construction of property plant and equipment. It is a measure of investment for the future.

Borrowing: The concave of the pot measures cash received from all forms of debt. It is a measure of financial condition.

EBITDA Profit margin: The Bottom Rim of the pot of the Otos MoneyTree displays Earnings Before Interest Taxes and Depreciation/Amortization. This factor measures profit after all direct costs, both variable costs (“cost of goods sold” on most income statements) and fixed costs (“selling, general and administrative expenses” on most income statements).
Otos will help to isolate the best sell opportunities now. More important, Otos will clearly indicate the timing of when to buy back, so sell now and rely on Otos.
Thank you for your continued support as we work to grow our capital together. As always, we are happy to discuss our investment outlook with you at your convenience.
Here is a how-to video around this weekly article.


