The most innovative companies, states and countries in the world
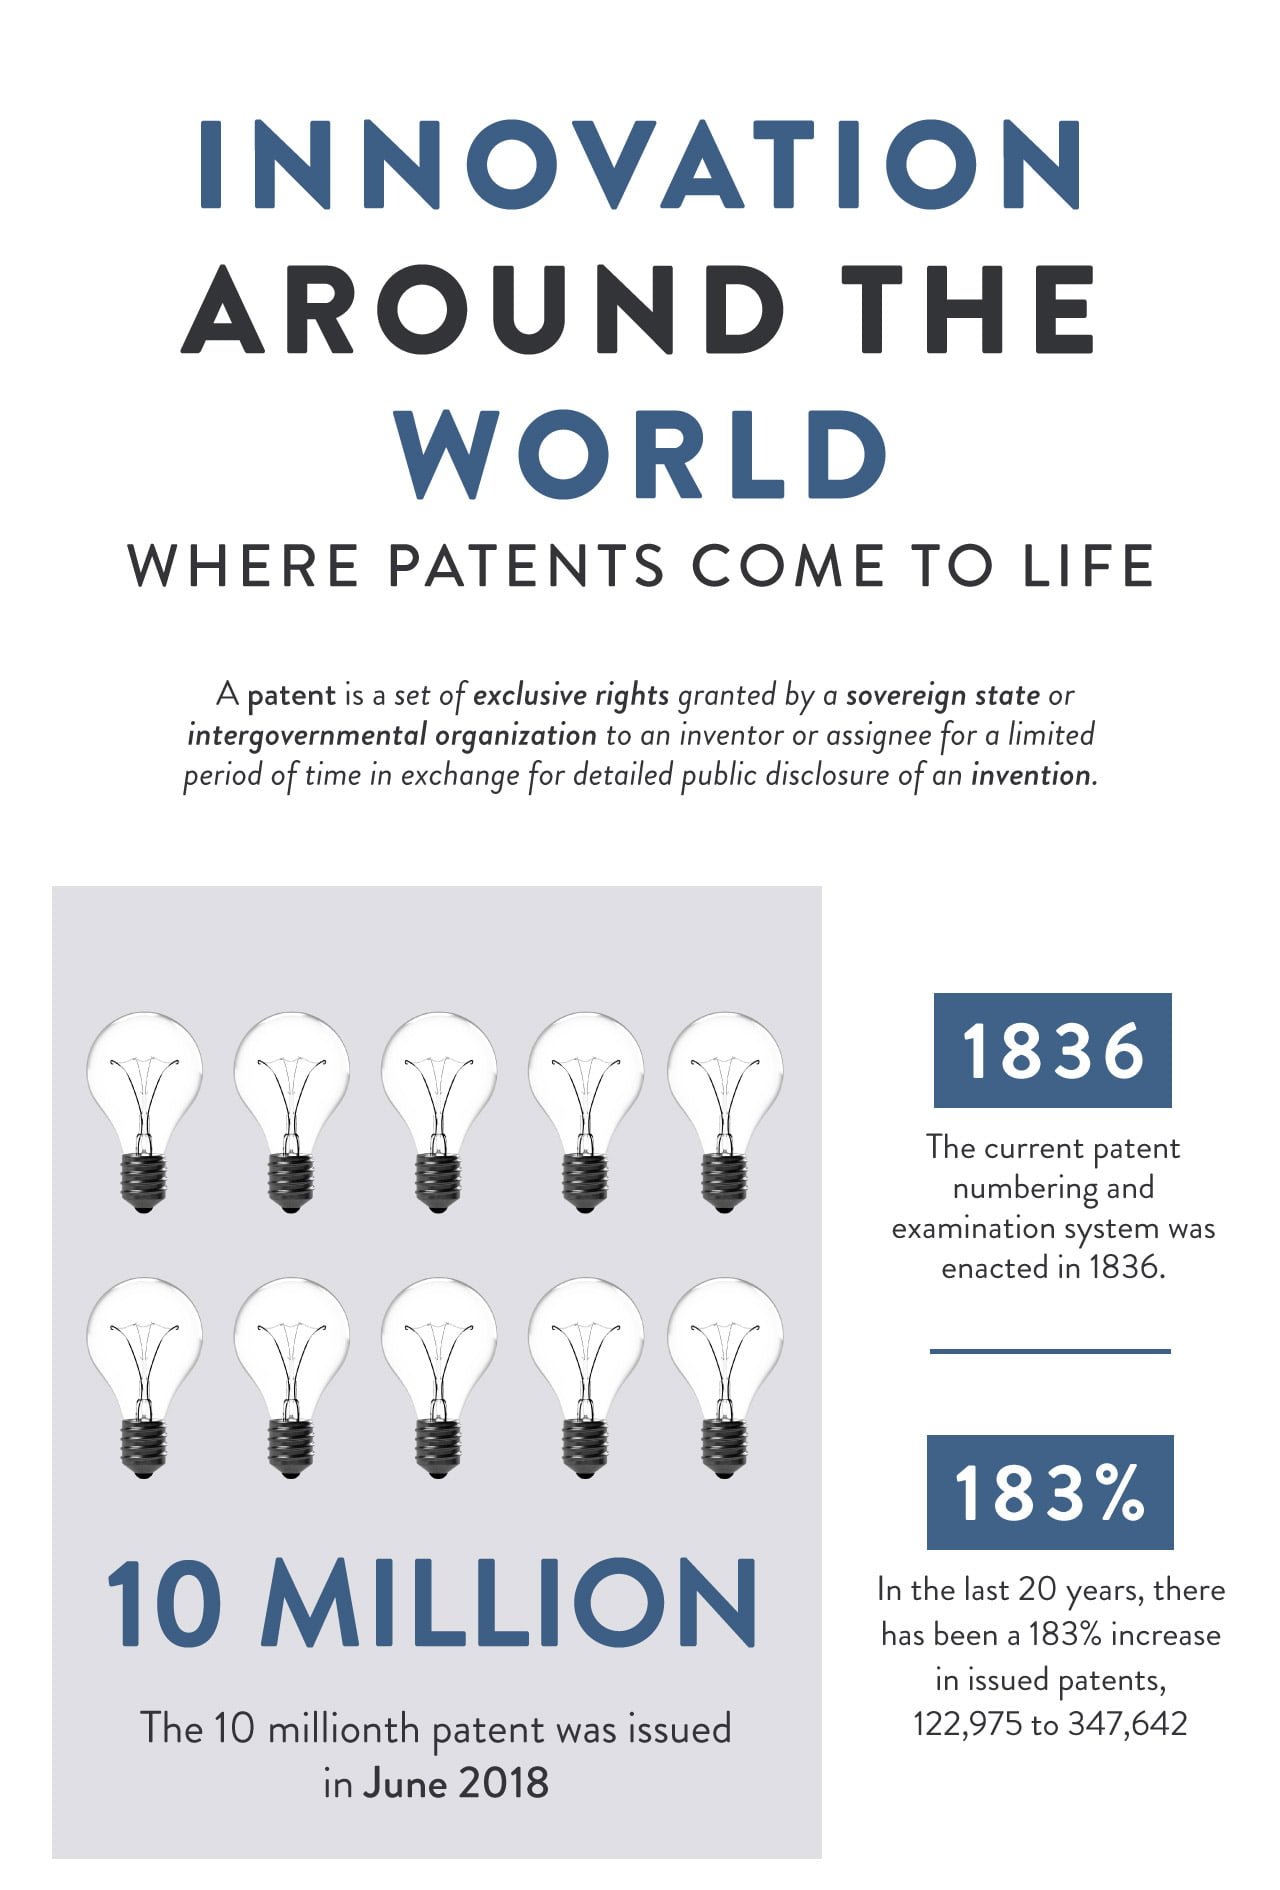
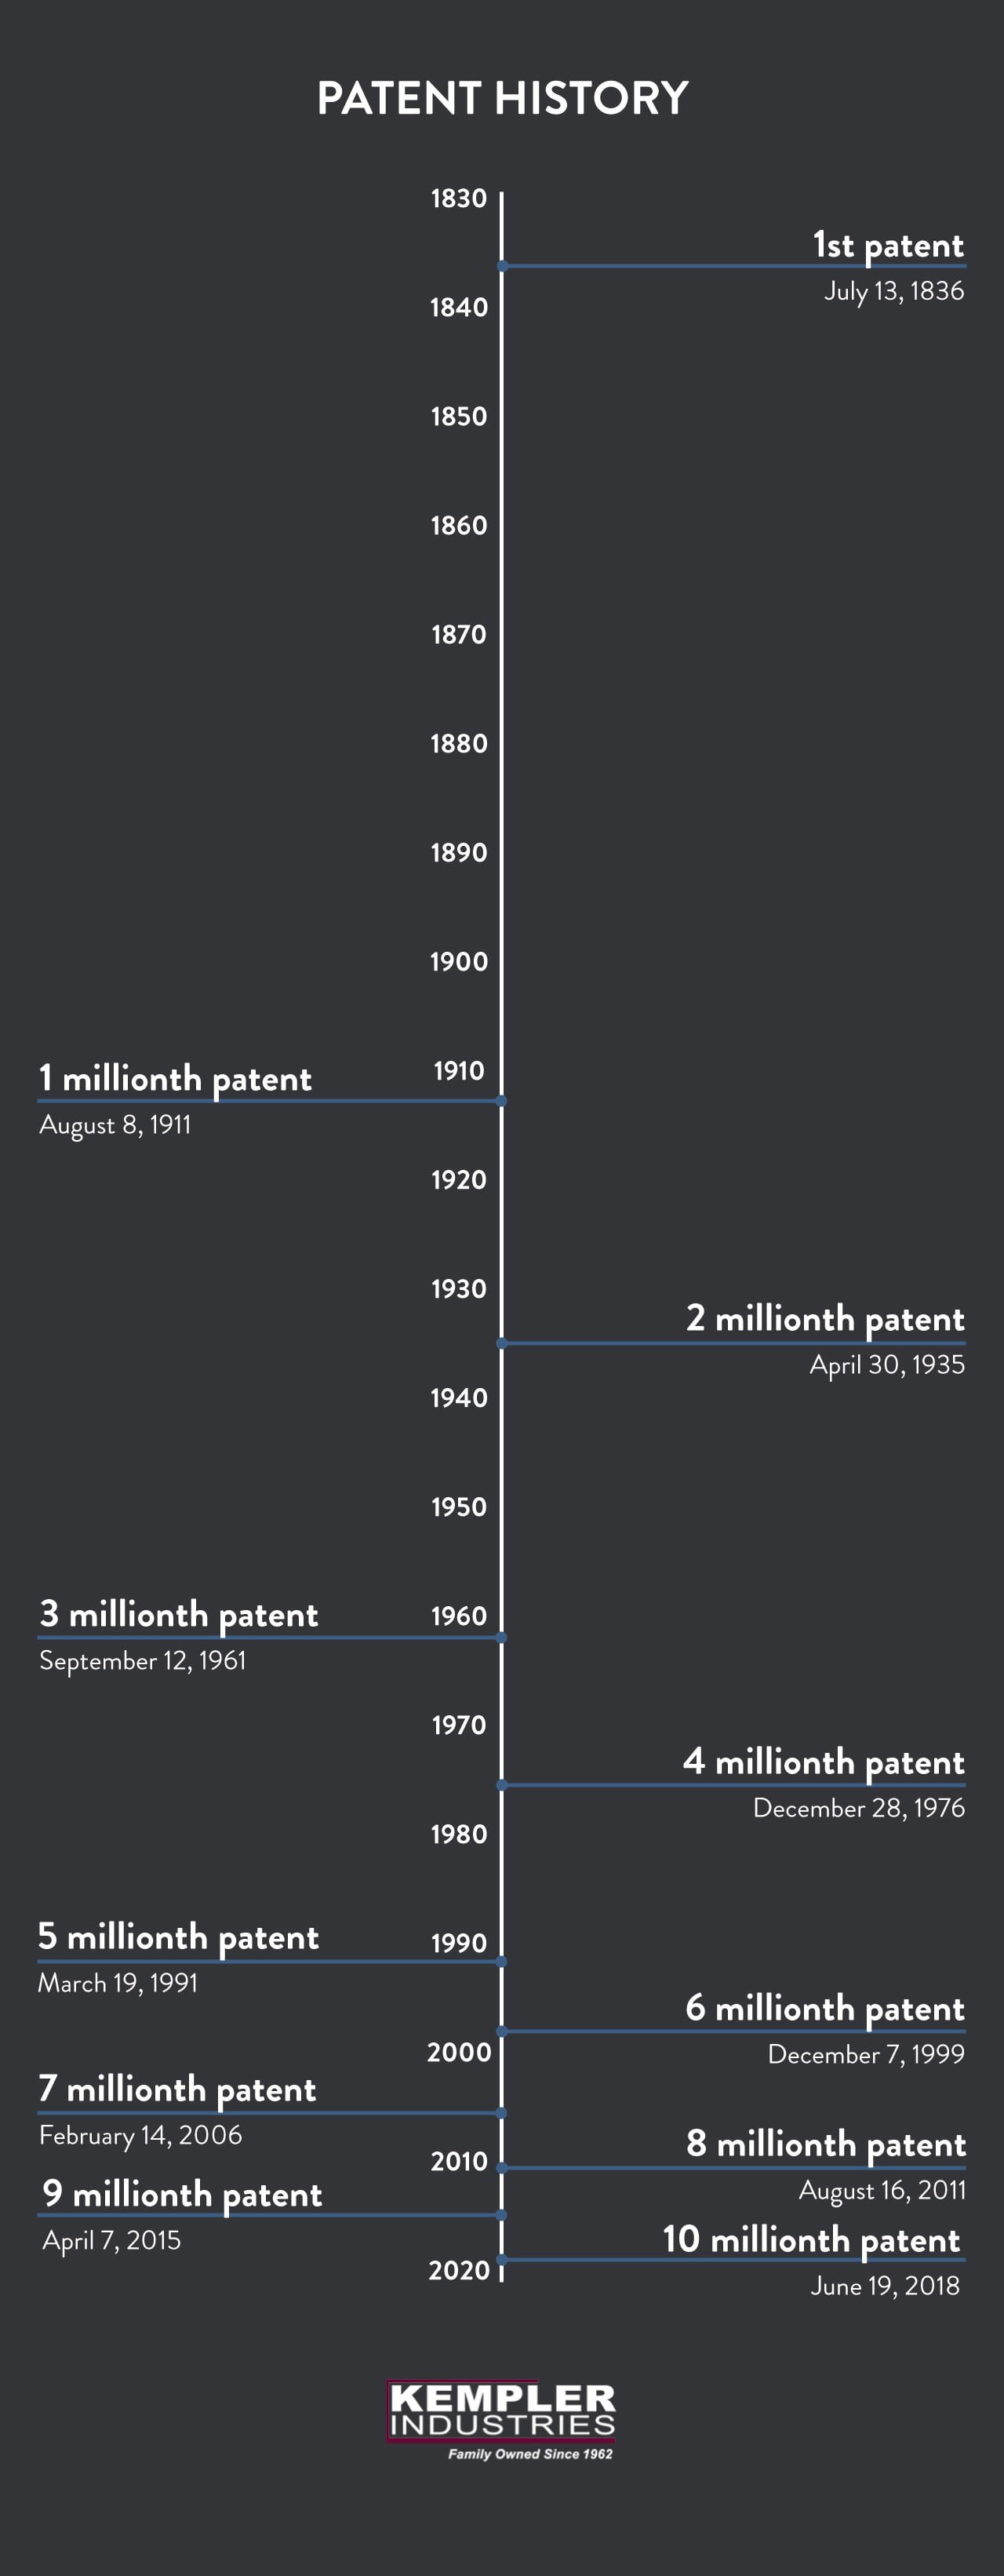
In June, the United States Patent and Trademark Office issued its 10 millionth patent. That got us thinking, where are the most patents in the world being issued? Who are today’s leaders in innovation?
[klarman]Q2 hedge fund letters, conference, scoops etc
Kempler Industries recently dug through the data from the US Patent and Trademark office to find out. The more they dug through the data, they more surprises they found.
For example:
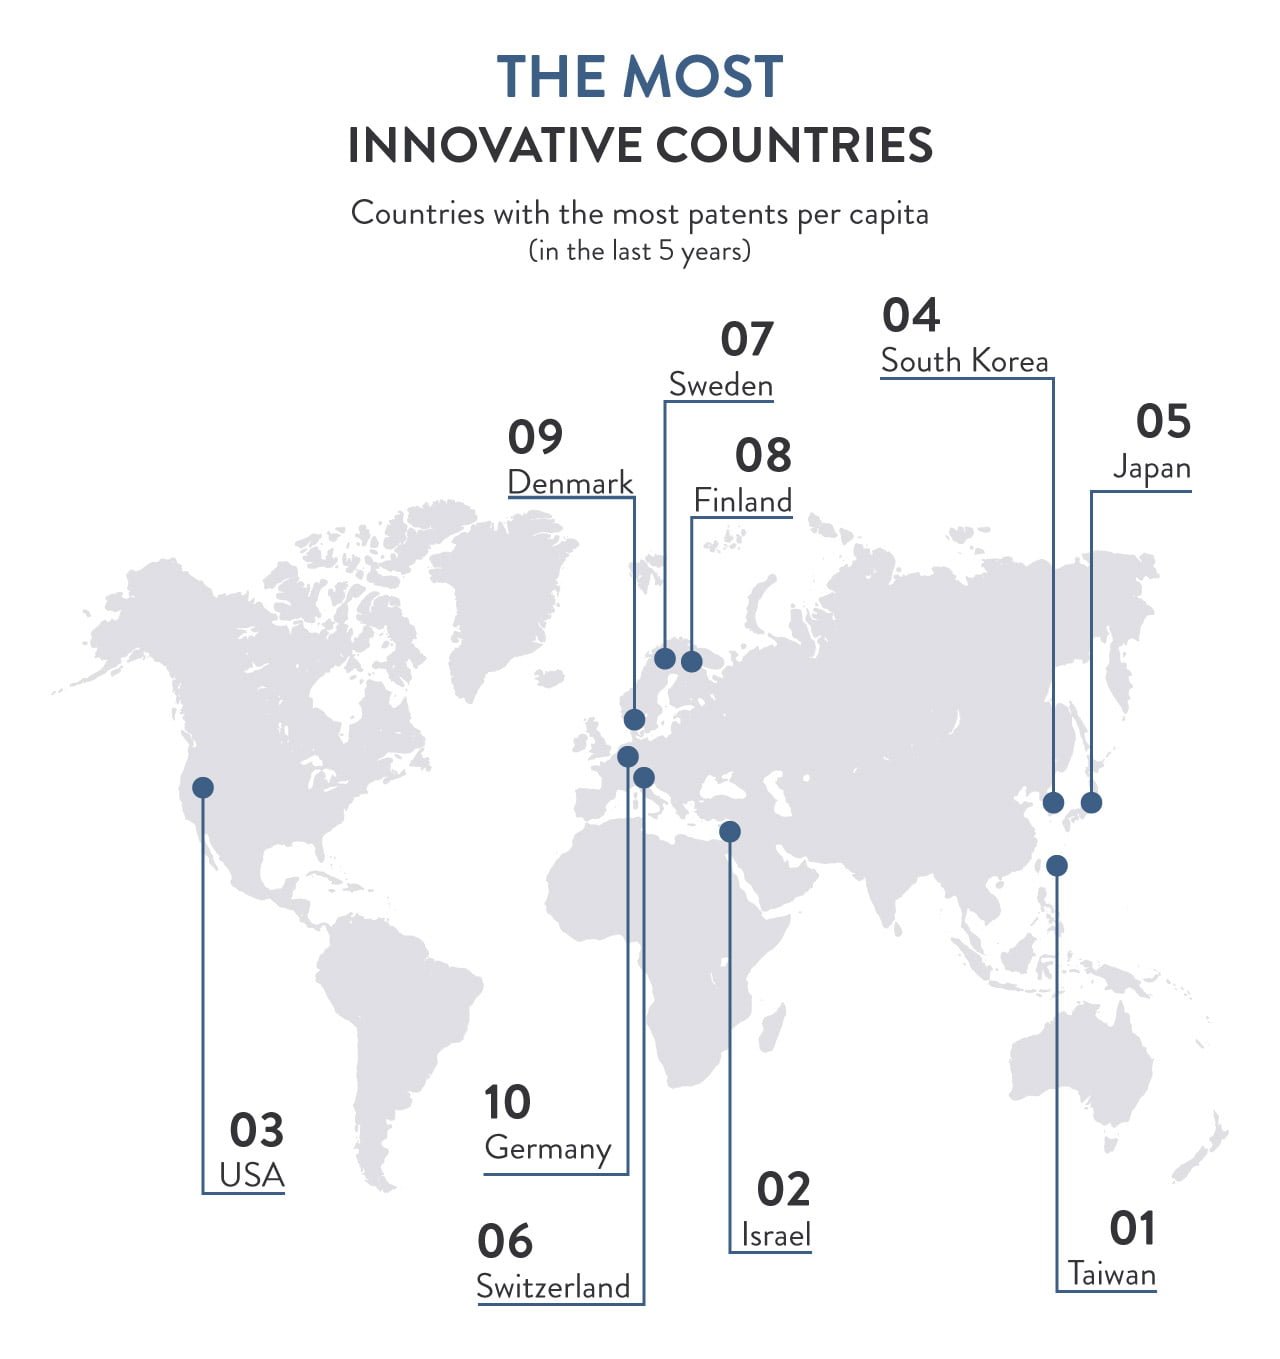
- The United States is not the #1 country when it comes to patents issued by the USPTO (Taiwan takes that honor and is number on the list)
- In the United States, Idaho is the best place to apply for a patent grant
- Washington D.C. is the worst
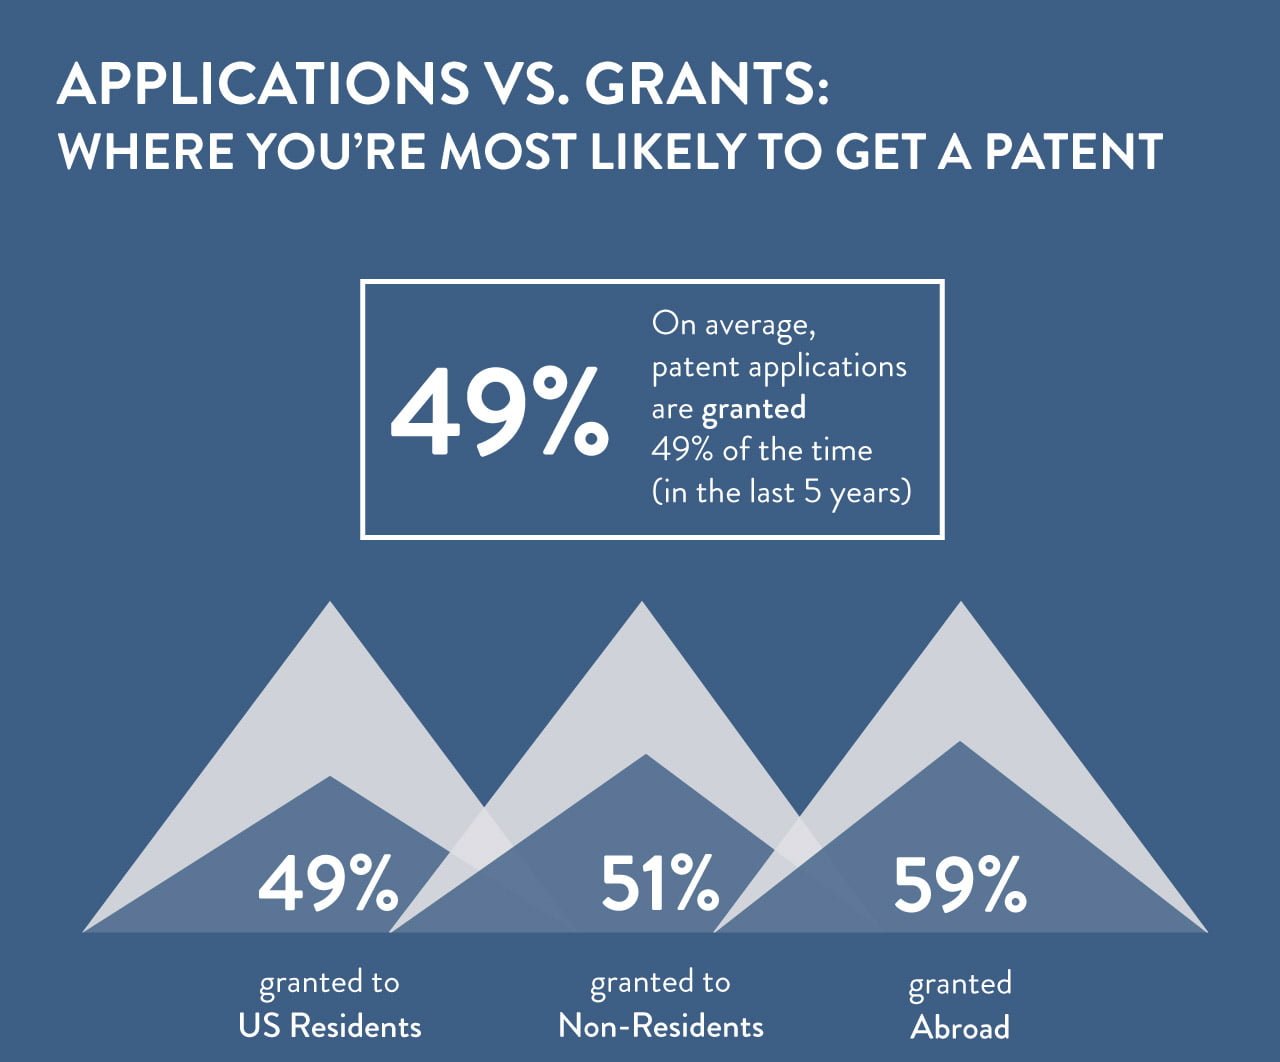
- Patent applicants from abroad are most likely to be granted patents
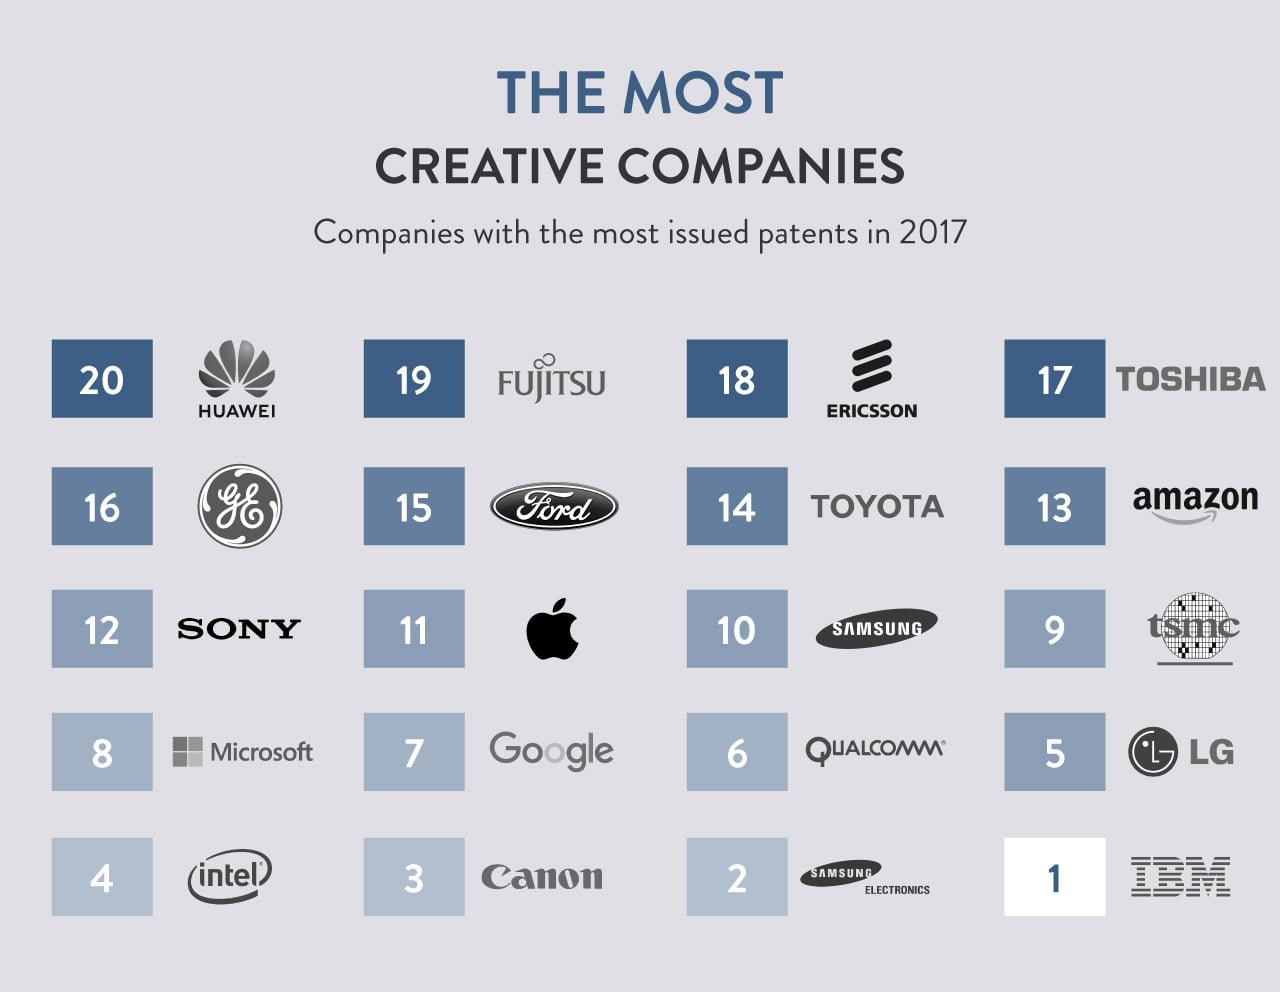
- Surprisingly enough, both Apple and Amazon fall just outside of the top list of most innovative companies (this was judged by the companies with the most patents issued in 2017).
- In the last 20 years, there has been a 183% increase in the number of patents issued going from 122,975 annually to 347,642 annually.
In the full analysis, Kempler industries examined the following metrics:
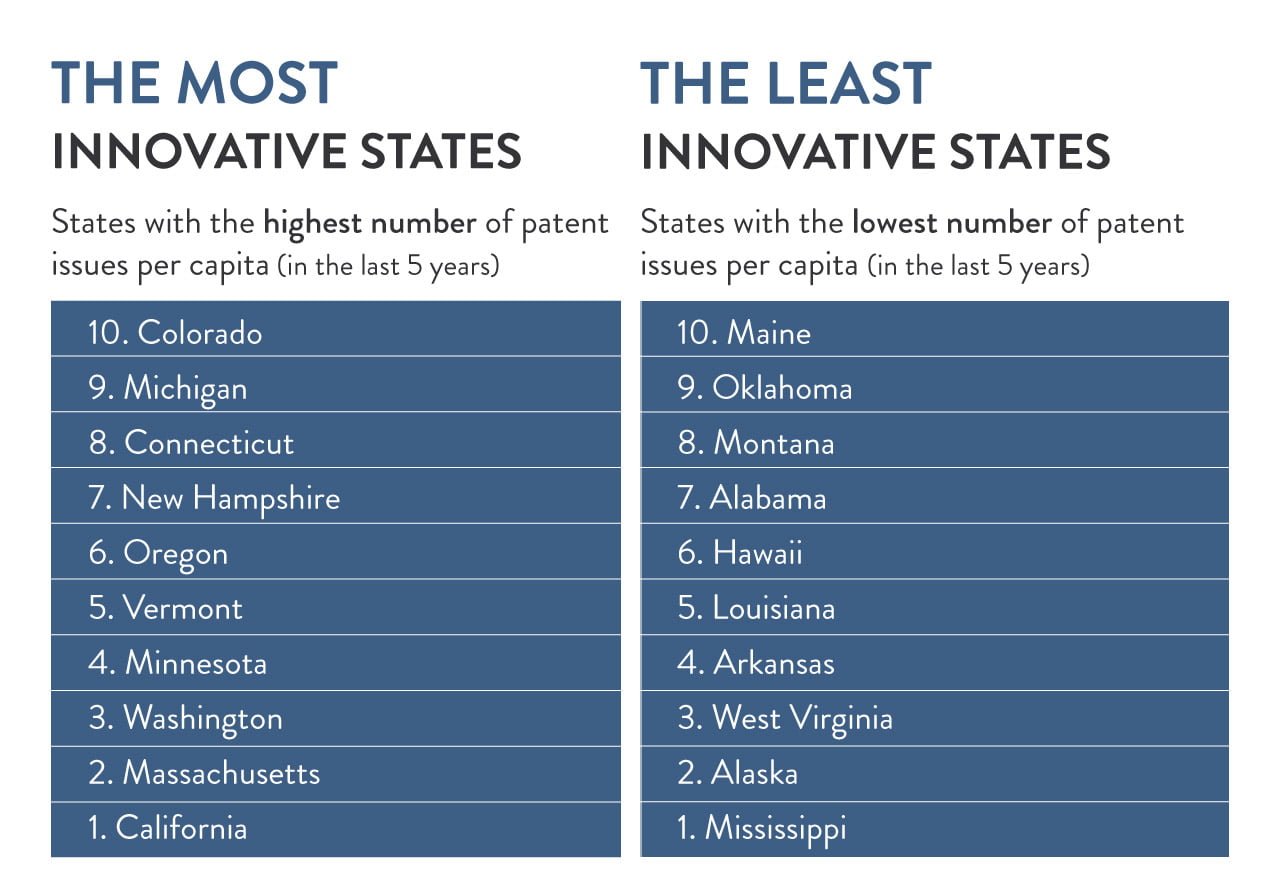
- The most innovative states in the U.S. (states with the highest number of patents issued per capita in the past 5 years)
- The least innovative states in the U.S. (states with the lowest number of patents issued per capita in the past 5 years)
- The most innovative countries worldwide (countries with the most patents per capita in the last years)
- The most creative companies (companies with the most issued patents in 2017)
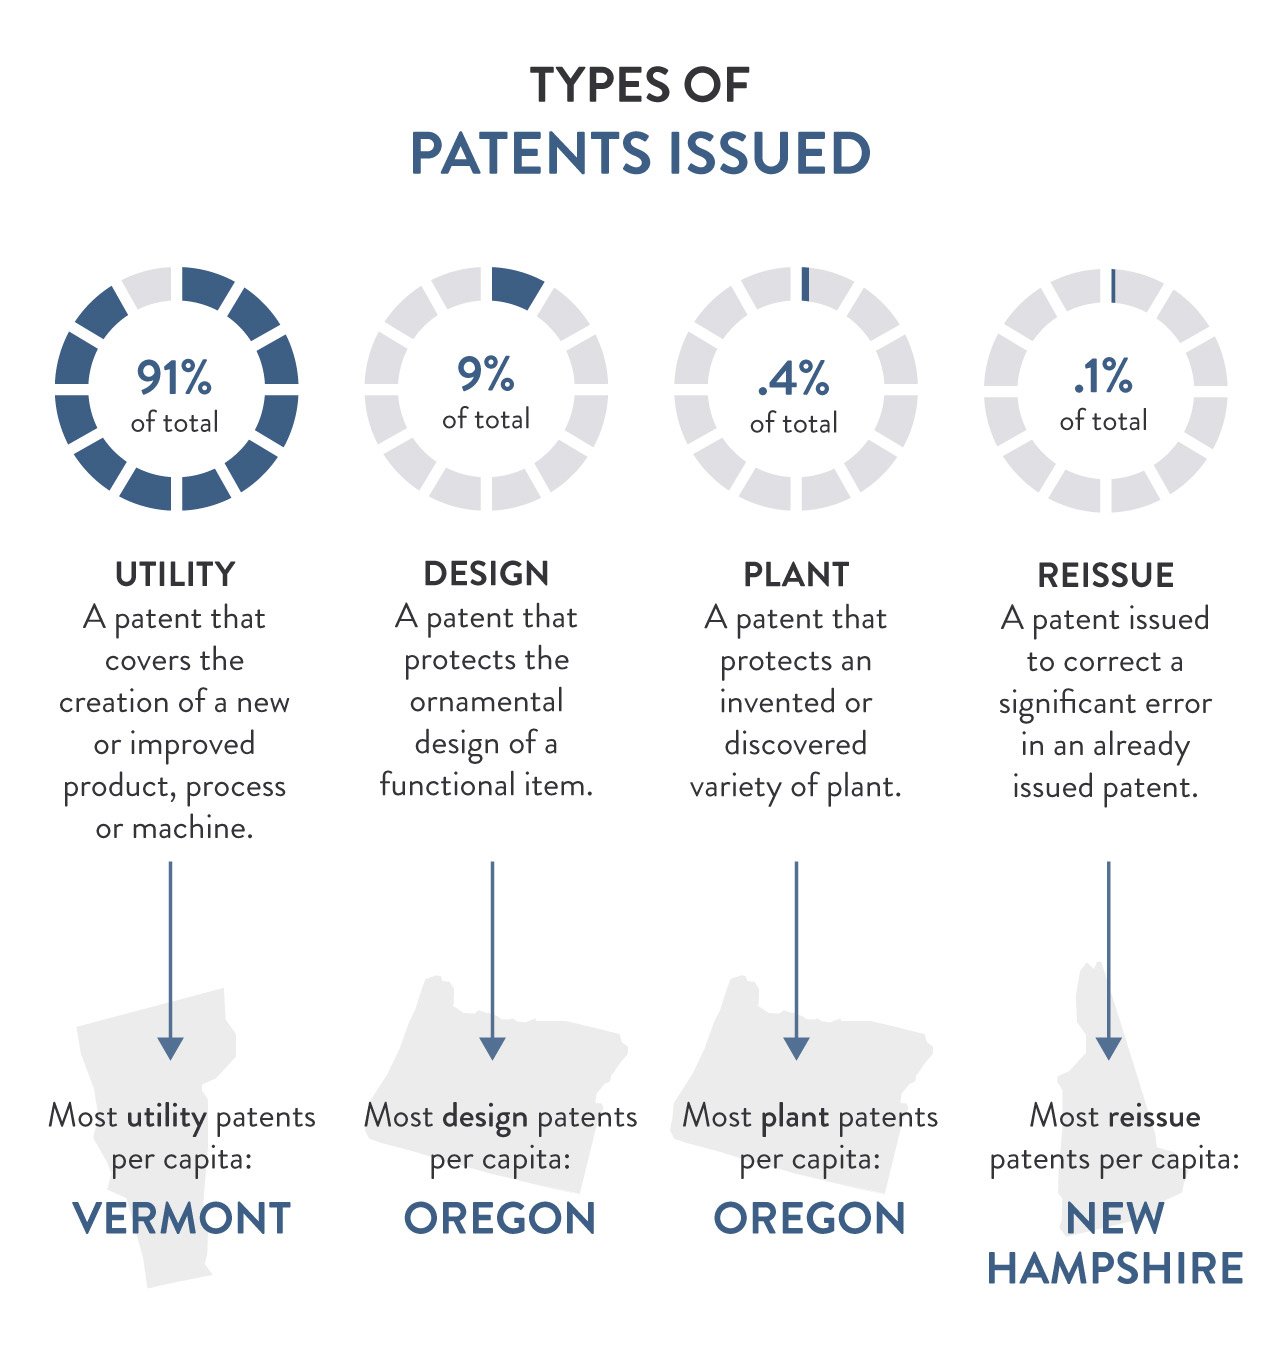
- The most common types of patents issued (Utility was the bigger winner here with 91% of all patents)
- The easiest states for patent issues (% of grants vs applications)
- The most difficult states for patent issues (% of grants vs applications)
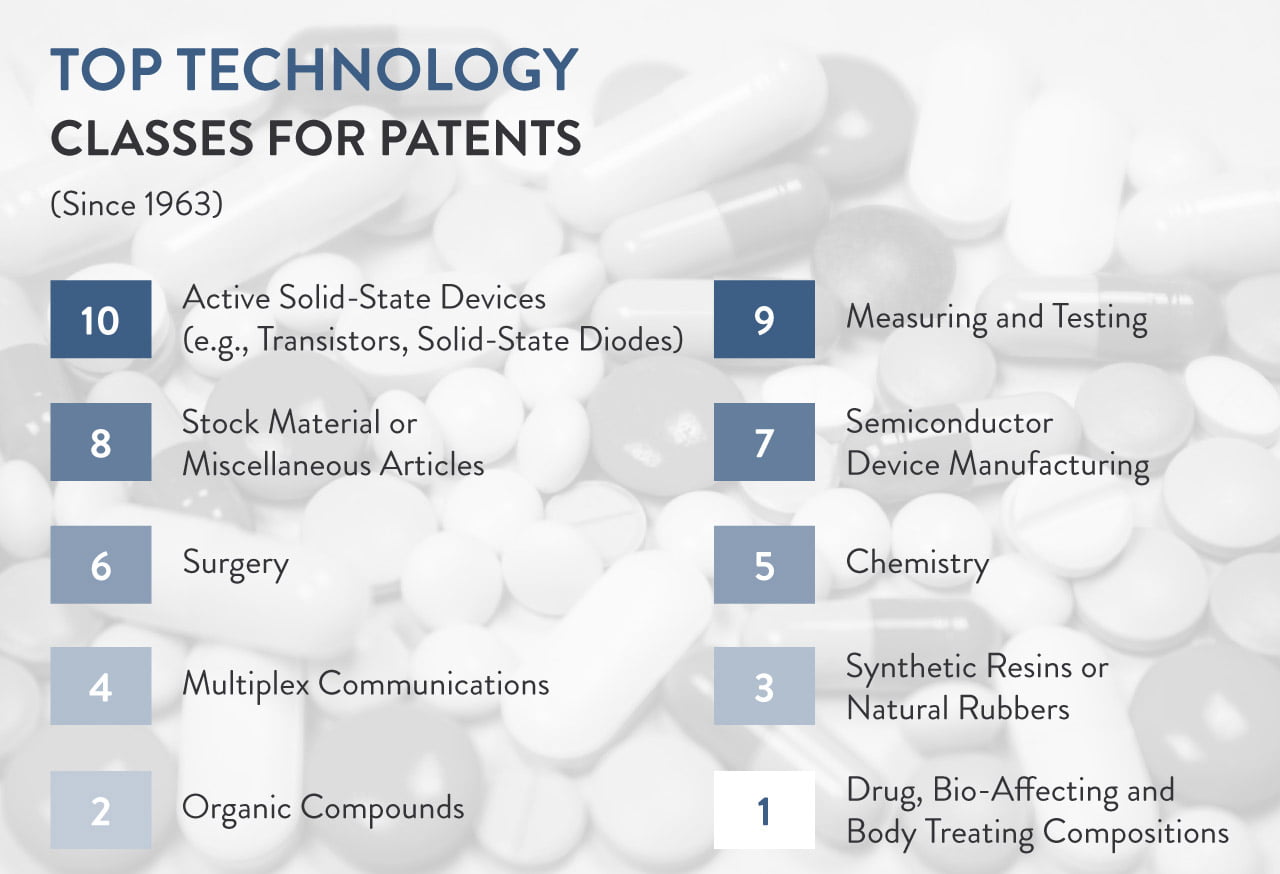
- The top technology classes for patents (since 1963)
To see the full analysis from Kempler industries, check out the infographic below.