
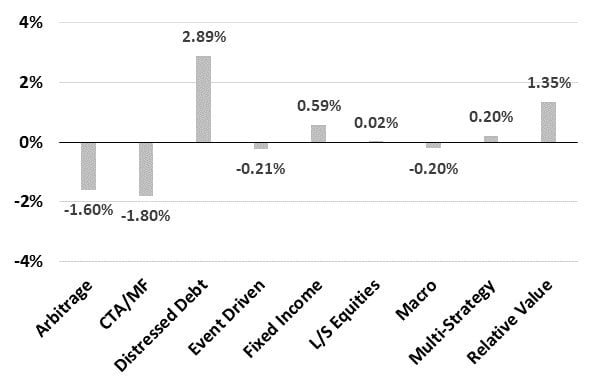
Best and Worst Performing Strategies
Q1 hedge fund letters, conference, scoops etc
Distressed Debt
+2.89% YTD
+US$0.61 billion AUM YTD
Distressed debt continued to be the best performing strategy on a year-to-date basis as corporate debt exposure to oil and Puerto Rican debt contributed to gains for some managers in March.
CTA/Managed Futures
-1.80% YTD
-US$13.52 billion AUM YTD
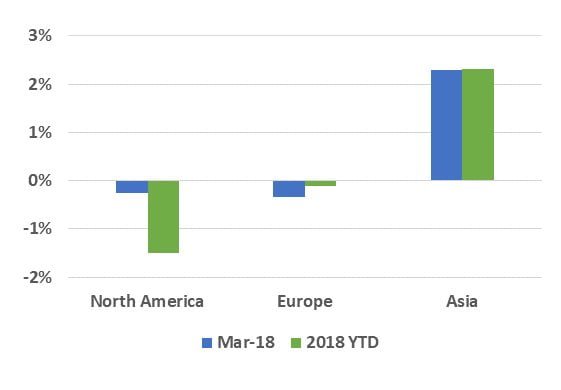
The significant losses incurred by CTA/managed futures fund managers in February completely depleted the gains they made in January, and left their year-on-year AUM growth deep in the red. Among regional CTA/managed futures focused strategies, Asian CTA/managed futures hedge fund managers generated the best returns in Q1 2018, up 2.32%
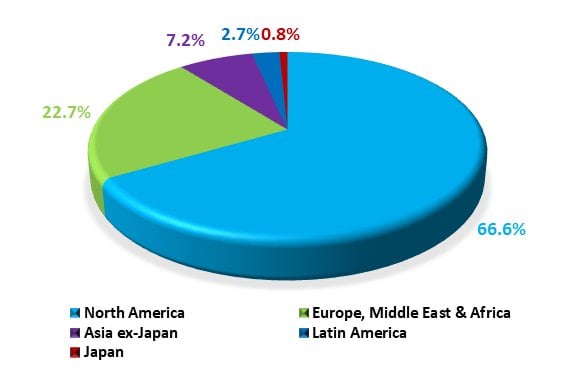
The North American hedge fund industry accounts for 66.6% of the total hedge fund assets as of March 2018.
Global hedge fund fees climbed to three year highs
| Year | Performance Fees (%) | Management Fees (%) |
| 2015 | 14.27 | 1.28 |
| 2016 | 15.56 | 1.31 |
| 2017 | 15.64 | 1.24 |
| 2018 | 15.76 | 1.36 |
Article by Eurekahedge


