Logica Capital commentary for the month ended March 31, 2023.
Summary
Markets/factors continued to diverge further in March, with the Nasdaq 100 Index gaining +9.46%, while the Russell 2000 fell -4.98%, in part due to failures of Silicon Valley Bank and Signature Bank. Through the end of Q1, we saw the Dow Jones Index up a paltry +38bps, while the Nasdaq 100 gained +20.5%.
Separately, VIX/Implied Volatility came down slightly month over month in March but did see a nice intra-month pop due to the short-lived banking scare. At the close of Q1, VIX was down nearly -3.0 points for the quarter.
Commentary & Portfolio Return Attribution
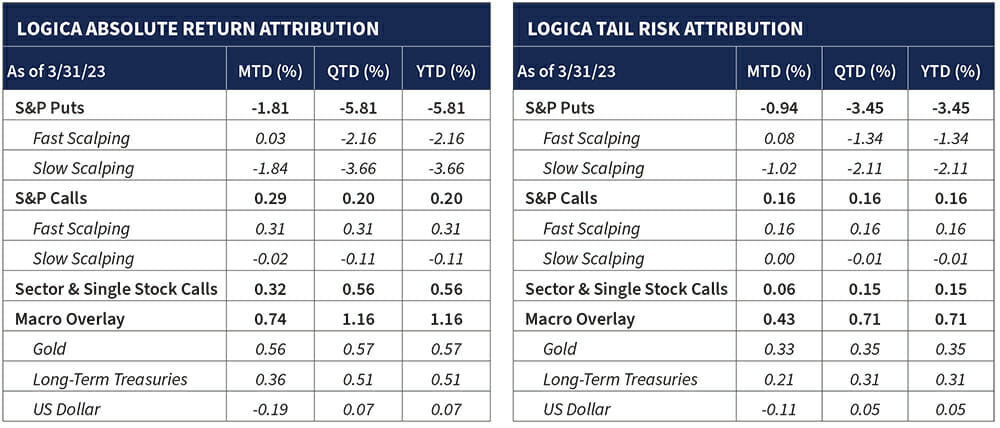
5) For illustration purposes only. Attribution returns are composed of daily returns, gross of fees
Our strategies in June saw S&P puts (and calls) lose slightly more than the VIX return might imply. This was a result of at-the-money (ATM) getting punished a bit more than OTM due to a change in skew.
As many of you know, the VIX is a 30-day weighted average of pricing across strikes (a “vertical” slice of the implied volatility surface). As such, if there were a more dramatic change in OTM versus ATM options it would be muted by the averaging inherent in VIX (-2.00 points in March).
The VOLI index (-2.57 points), by contrast, which measures implied volatility (“IV”) of ATM options on SPY interpolated to 30 days to expiration, provides a more precise measure of ATM volatility. Broadly, the VIX index incorporates noise generated by factors to which Logica is not exposed, including options skew, relative distance between option strikes, and number of strike prices listed, etc…
Sector & Single Stock Calls underperformed in March, as we’ve seen factor dispersion increase further so far in 2023. Our “diversified” bucket as a standalone returned +74bps while our momentum bucket saw a -21bps loss on the month, as compared to the S&P 500 gaining 3.51%, albeit driven powerfully by the constituents that comprise the Nasdaq 100 gaining 9.5% on the month.
As a remnant of 2022, our models happened not to be positioned much in the technology sector this month, so we missed out on the heavily tech-driven broader market gains.
Our Macro Overlay provided a nice boost, led by Gold, which after a particularly bad February, bounced back in a substantial way with its best month since July 2020 (+8.3%).
“Any time I make a record it’s followed by a painting period. It’s good crop rotation.”
– Joni Mitchell
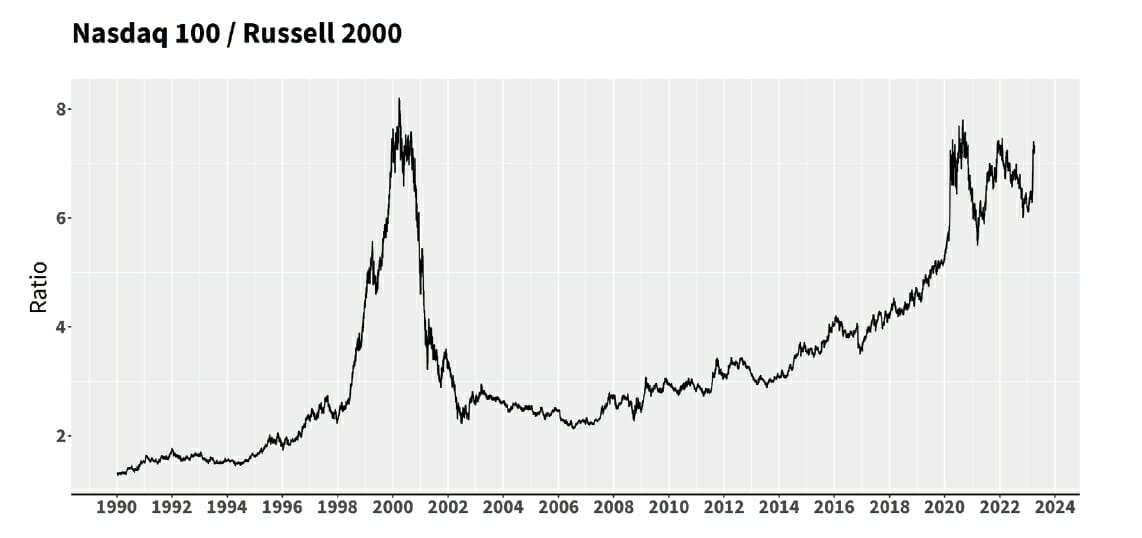
Turning toward the factor rotation and accompanying variance, we saw record dispersion between some indices in March. When we compare the monthly returns of the Russell 2000 index with the Nasdaq 100 in the chart below, we see that March 2023 was in fact the largest calendar month spread between the 2 indices (14.4% differential) since the 1999-2002 era (with March 2020 being a close 2nd)!
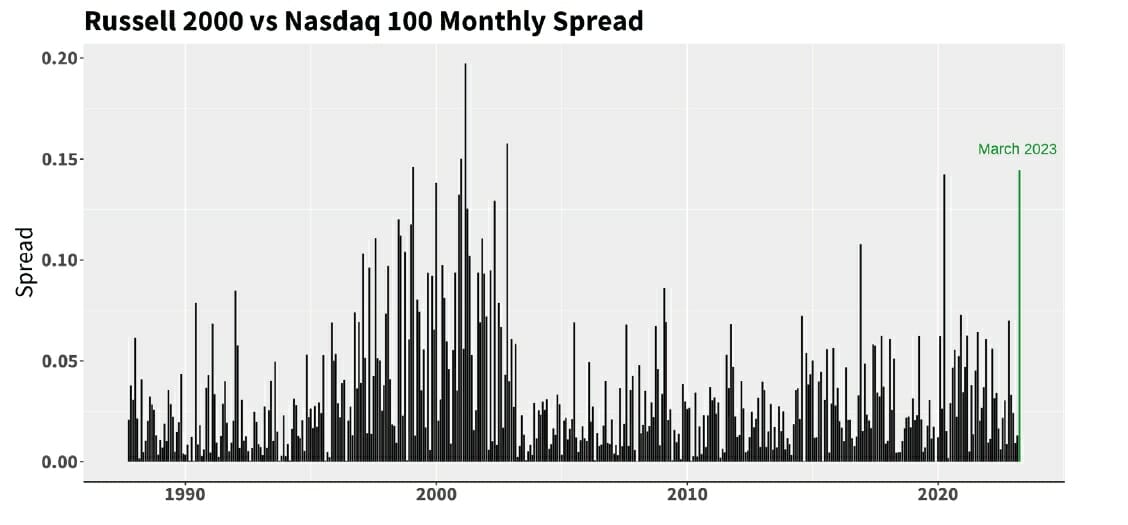
Further, we can see this disparity in another form, shown in a chart we have referenced in prior letters (simply, the price ratio between the 2 indices):
As we’ve been mentioning in our recent letters, our Sector & Single Stock Calls have been hurt by this recent regime that has thus far favored large cap and tech. This is not to say that we are small cap biased, as we certainly are not, nor do we have any models that would specifically target that.
Our basket, however, was exposed to the -5% drawdown Russell 2000 via an approximately 2% delta-notional position in IWM calls.
The broader point behind illustrating this outsized capitalization spread is that there were various other factors that showed meaningful spreads in the face of the tech-dominated upside, including underperformance from various value driven sectors, such as energy, utilities, financials, and real estate – to all of which we had some exposure.
As a broad result, we experienced a fair portion of the “long” side of our book underperforming the S&P 500. Concurrently, the short side of our book, focused on minimizing basis risk to market downside, holds only S&P 500 puts that, of course, perform closely in line with a short position of the underlying S&P 500 index itself.
In this somewhat ironic twist, in trying to minimize basis risk for downside events, we were stung by our deliberate embracing of basis risk for upside participation.
But to be clear, we would, and do, continue to make this thoughtful decision by constructing our portfolio in this way; having experienced and rigorously tested the long-term value-add of taking basis risk for upside participation, while seeking to minimize it in the area we pride ourselves on: market downside participation.
“Your assumptions are your windows on the world. Scrub them off every once in a while, or the light won’t come in.”
– Alan Alda
With that idea in mind, however, we must ask ourselves if there is any piece of our up-capture models that need a review, or more drastically, a change? In fact, we ask ourselves this very question in both good periods, and bad – as the very essence of our investment philosophy (as so beautifully expressed above by Alan Alda) rests on continuous questioning of our assumptions.
Thankfully, the answer, this time, is a resounding no, and for several good reasons. The 6 month to multi-year time frame of our trend models are simply too long to adjust to a violent factor rotation like we have experienced thus far in 2023.
But we have settled on these wider time frames after years of research that demonstrated that shorter look-back periods caused excessive whipsaw and far too frequently would shake us out of profitable long-term trends – such as the trend we captured last year in energy and value.
We must also remind readers that our up-capture stock/sector selection models are intended to be “mean expansionary” in their nature (commonly dubbed “trend” but calibrated by us as “mean expansion” in a complementary balance to our “mean reversion” up capture models, including our SPX gamma and vega scalping models).
With that said, this variance (our basket’s performance relative to the S&P 500 over shorter time frames) is well within the historical bands of expectation. That is, over ample years of real-time execution, and over far longer historical testing, we see an acceptable rubber band of performance stretching to and fro around the benchmark.
And while the models demonstrate a positive expectancy over long runs, negative spreads can occur over short ones. Secondly, and perhaps more interestingly, is the why. The why, we believe, is because rotation is a necessary behavior – call it, organic – to trend evolution in markets.
What has underperformed for us in the last few months is largely what outperformed for us in much of 2022. The excess run, quite simply, has taken a breather – as we have seen occur time and time again over the years.
And, having seen this rodeo before, are quite familiar with what so often comes next; those positions that needed breathing take in their healthy breath of discounted oxygen so that they can re-emerge with a stronger foundation and continue on with their longer-term uptrend, and those positions that struggle to get back up on their feet, get replaced with newer emerging strength.
Apropos to this, we have just started to see our model slowly increasing positioning in Semiconductors and Communications.
“A strategy is necessary because the future is unpredictable.”
– Robert Waterman
Now, of course, some might argue that our basket should’ve rotated quicker, perhaps more rapidly assessing the shift from last year’s winners to this year’s darlings either right as, or fairly rapidly after the turn begun.
And, yes, that would be nice if it could all be more perfectly timed. But in lieu of a crystal ball, our strategy, and associated portfolio construction, calls for balance at its core.
Because the future is unpredictable, we have strong conviction (experientially and experimentally) that the balance of mean expansion and mean reversion provides more stable alpha over time, inclusive of the characteristics of variance that ails each one of them during specific times.
“The lamps are different, but the light is the same.”
– Rumi
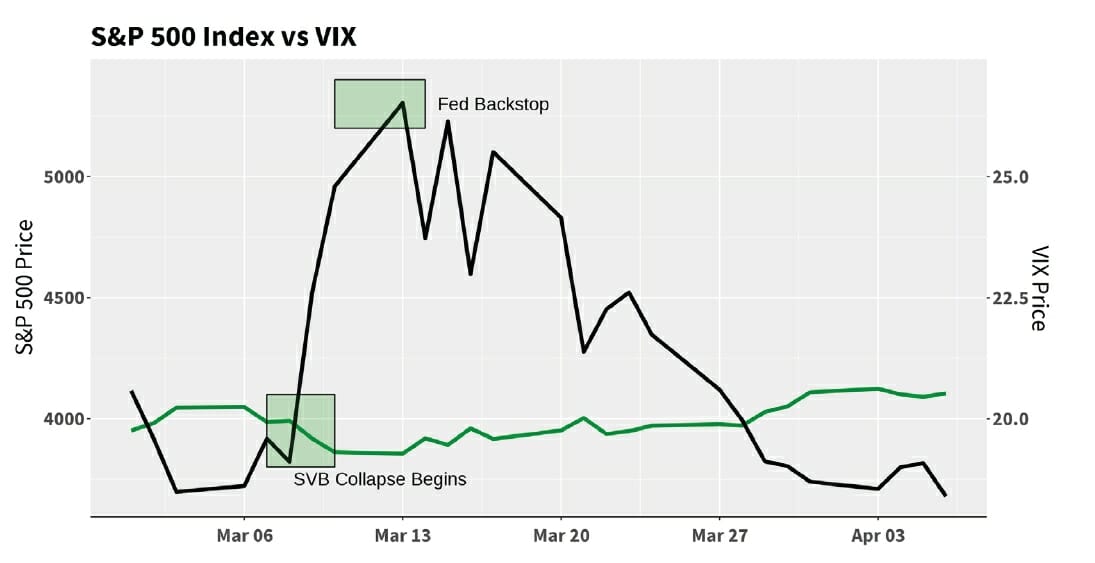
Looking more closely at implied volatility, the landscape was largely uneventful on a month over month basis, as shown in the chart below.
However, there were certainly some intra-month fireworks, beginning on March 9th with the start of the SVB collapse, and “end” on March 12th when the Fed stepped in to be the backstop for all depositors. In perfect alignment, we see the pop, and crush, in VIX (black line):
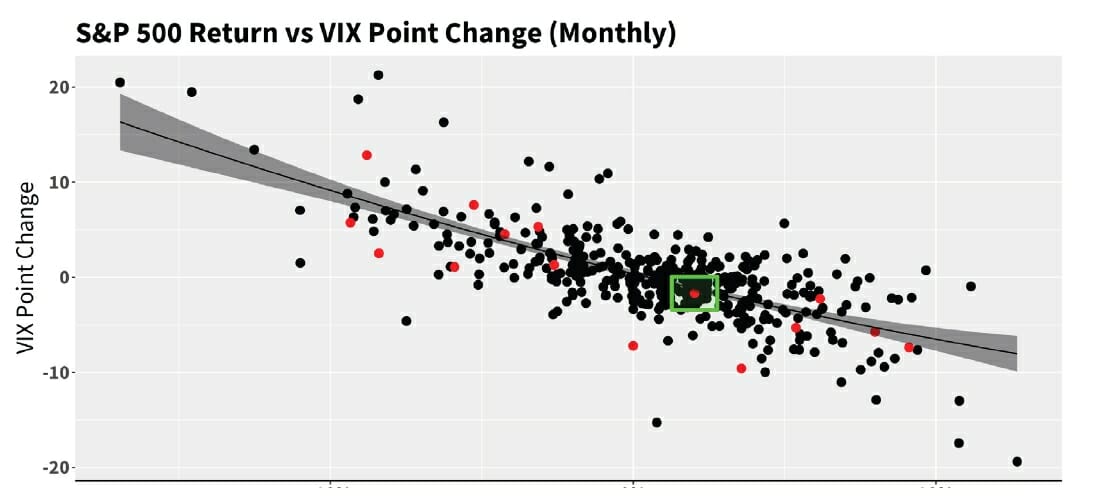
But widening the lens, despite the scare-driven action intra-month, on a month over month basis, the relationship between the two was largely normal, and nothing much to speak of:
Elsewhere, after printing its single lowest close of the “post-Volmageddon” era in January, the CBOE VVIX Index6 popped alongside the fireworks of defaulting banks, but quickly reverted in March:
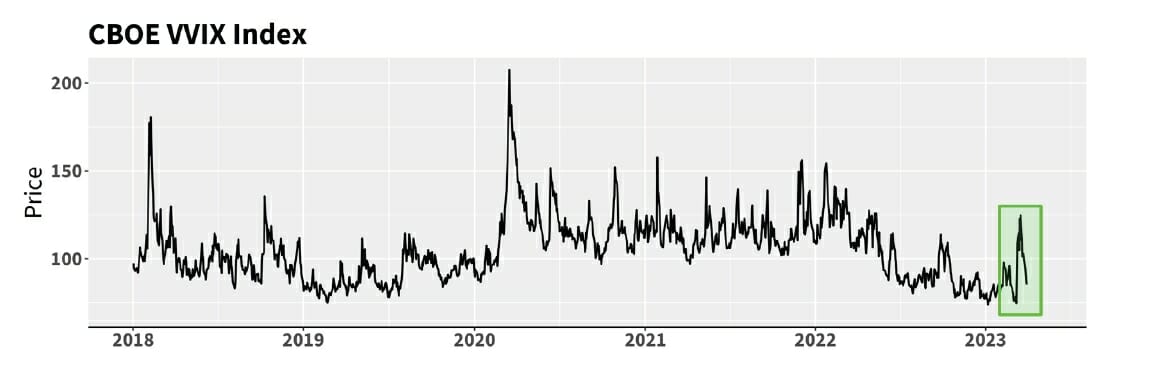
6) The VVIX Index, outside of some mathematical gymnastics, can basically be thought of as “volatility of volatility,” or, how much implied volatility itself (VIX, in this case) is bouncing around. If implied volatility is not bouncing around (as represented by a lower value of VVIX), there are typically fewer trading opportunities for those who scalp Vega, as Logica does.
This VVIX explanation is somewhat simplified for the sake of clarity of communication, and we encourage readers that are so inclined to take a look at its full methodology for themselves.
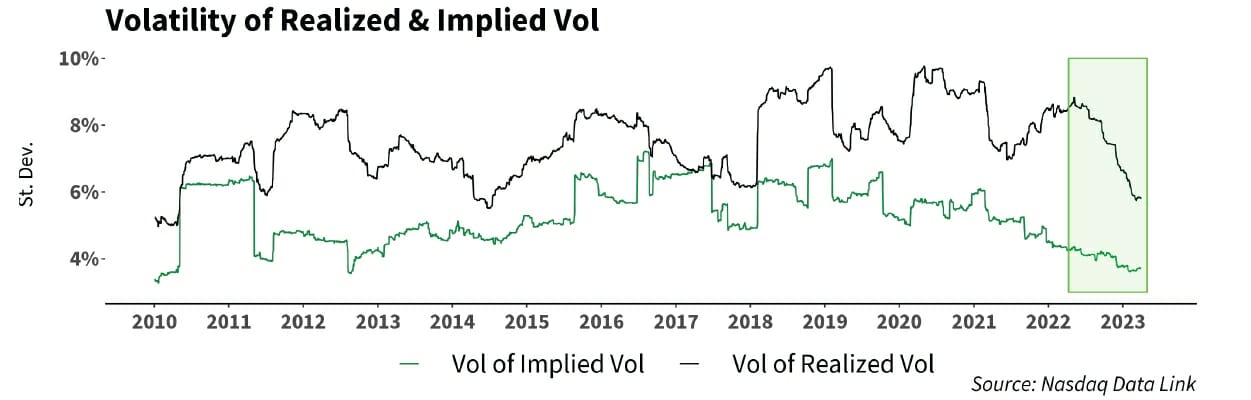
Relatedly, as we mentioned last month with our “coiled spring” analogy, we observe that the vol of realized vol has been falling at a far more dramatic rate than the vol of implied vol:
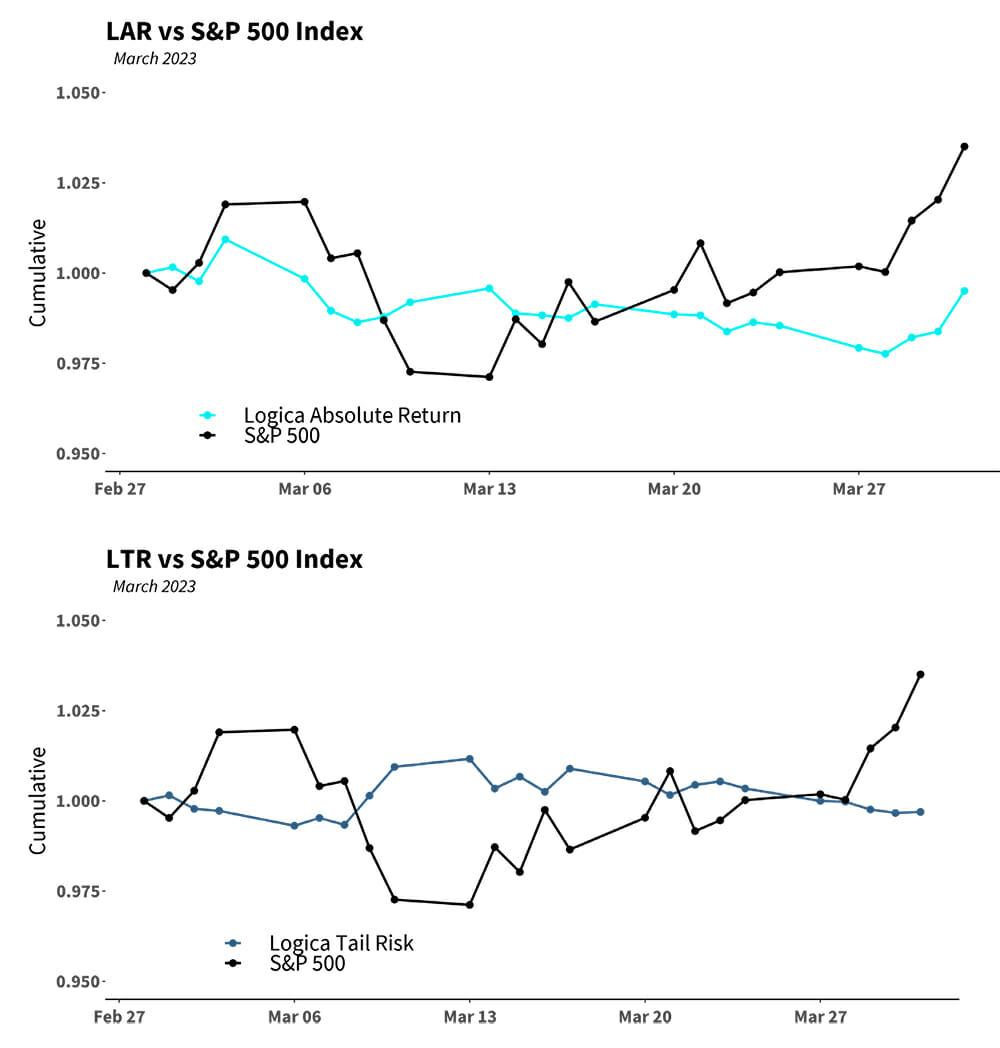
Finally, taking a closer look at the daily movement of our strategies for the month of March, we can see both LAR and LTR holding steady through the intra-month turmoil, followed by their expected correlations over the latter half of the month (LAR uncorrelated to positively correlated, and LTR uncorrelated to negatively correlated):