Recently I was discussing with a friend some of my favorite investments in the past year or so. One of them that stood out to me was JP Morgan. He asked if it was a company that I would buy today at the current prices. I said I wasn’t sure, that I would have to do some due diligence before answering that question.

Q2 hedge fund letters, conference, scoops etc
Before the Great Recession and the pummeling of all the big banks in that crisis, JP Morgan was among the leaders in the banking world. During the crisis, JP Morgan cut their dividend from $0.38 to $0.05. Harsh to be sure, but necessary to survive.
Since that period the bank has rebounded and thrived. Overtaking Wells Fargo, who has struggled mightily because of their self-inflicted wounds.
The Wells Fargo scandals have helped JP Morgan to become the largest bank recently by market cap in the US.
Let’s take a look at J P Morgan and see if we would still buy today.
Key Metrics
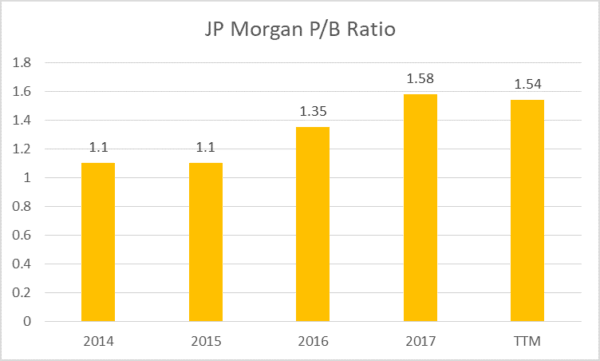
The first metric that we will take a look at is price to book. Of the metrics I like to use for banks, this is one of my favorites. It easily tells us the value of a banks assets, although it is not without its faults.
Chart courtesy of Intrinsic Value Formula
Over the last five years, we have seen a rise in the bank’s price to book ratio, indicating a rise in the bank’s assets. Additionally, it indicates an increase in the bank’s health.
Currently, J P Morgan's ratio is lower than the average for banks of 3.04. With JPM sitting at 1.54 as of the TTM.
Next, let’s look at price to tangible book to give us further an idea of the strength of the balance sheet.
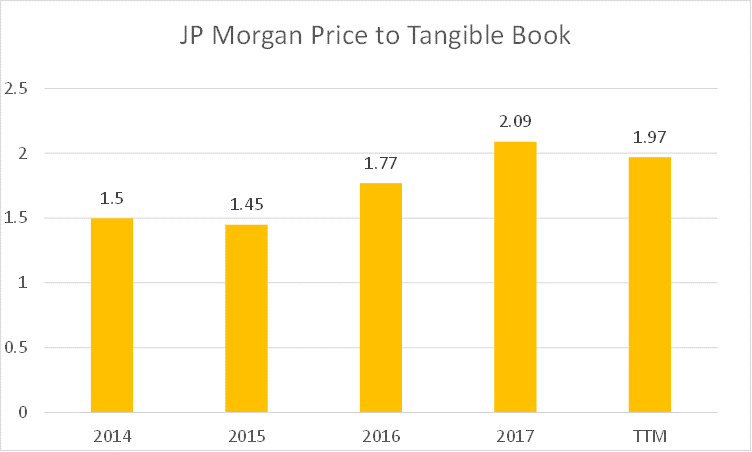
Courtesy of Intrinsic Value Formula
As we can see, there has also been an increase in this ratio over the last five years, with a slight dip over the last twelve months.
I like this metric because it takes out any opportunities for the accountants to do any funny business with things like goodwill, etc.
It gives us a great idea of the value of the assets in relation to the price it is trading at currently. Also, we can see that it is trading right in line with its peers. Bank of America is at 1.72, and Wells Fargo is at 2.06
Next up is a return on assets
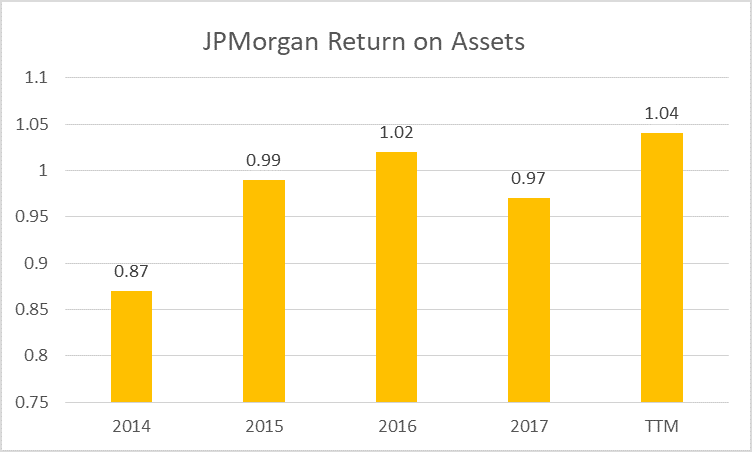
Chart courtesy of Intrinsic Value Formula
As we can see JPM’s ROA has risen in the last five years and is right in line with its other peers in the banking world. Bank of America has an average of 0.71% over the last five years, and Wells Fargo has 1.06%.
J P Morgan has made a little better-generating profit from its assets than it’s peers over the last five years. Bank of America has struggled in this realm, and Wells Fargo has seen a steady decline since their scandal of a few years ago.
Another note, any bank over 1% on ROA is doing very well and creating cash from their assets.
Next, to the last ratio, we will look at is a return on equity (ROE).
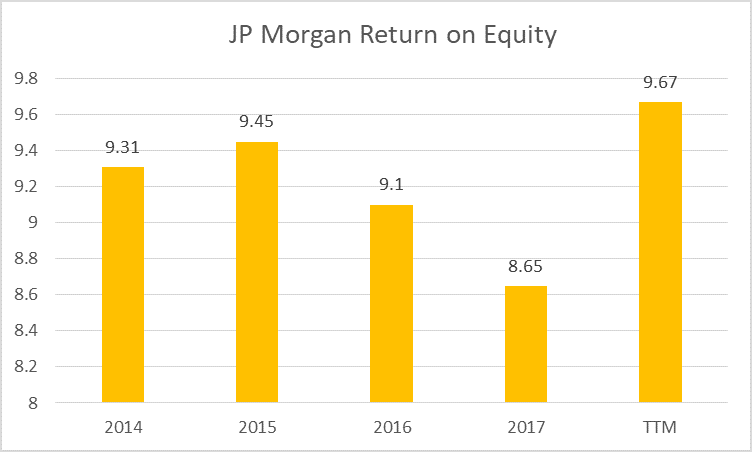
Ideally, we would love to see a return on equity of 10% or better, but J P Morgan is close and last year’s number were encouraging.
Comparing their ROE to BoA and WFC, they are right in line. BoA has a 6.94%, and WFC has a 9.87% last year respectively.
The last ratio is the efficiency ratio, which tells us how a bank is doing either increasing costs or decreasing revenues. The efficiency ratio is a quick and easy formula to measure a bank’s ability to turn resources into revenue.
The lower, the better, with 50% being the maximum optimal ratio. The lower it is, the more it indicates that the bank is earning more than it is spending.
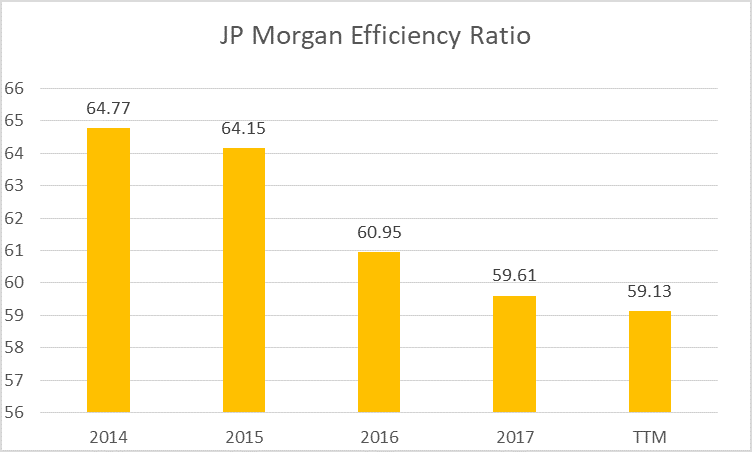
Chart courtesy of Intrinsic Value Formula
As we can see from the chart, J P Morgan’s efficiency ratio is on the decline, which is fantastic. As their revenues have increased over the last five years, their efficiency ratio has declined, indicating better profitability.
Comparing JP Morgan to other banks in the sector shows they are doing ok, but not as well as Bank of America, US Bank, and Citibank.
- US Bank 86%
- Bank of America 82%
- Citigroup 12%
Next up, let’s talk about some of the risks.
Risks
We can’t discuss investing without talking about risk. Just by the nature of how banks operate, the risk is involved. The very act of taking in deposits and using those monies to fund other investments leads to a risk of a run to have those funds returned at a moments notice.
Thus the risk.
Before the financial crisis, there was no mechanism in place to help mitigate this risk.
Enter the Stress Tests; these are the tests led by the Fed, which began in 2009.
“Recently the tests provided the most severe hypothetical scenario projects $578 billion in total losses for the 35 participating bank holding companies during the nine quarters tested. The “severely adverse” scenario, the most stringent scenario yet used in the Board’s stress tests, features a severe global recession with the U.S. unemployment rate rising by almost six percentage points to 10 percent, accompanied by a steepening Treasury yield curve.”
Which brings us to the common equity Tier 1 ratio. What is this exactly?
Tier 1 common capital ratio is a measurement of a bank’s core equity capital compared with its total risk-weighted assets that signify a bank’s financial strength. The Tier 1 common capital ratio is utilized by regulators and investors because it shows how well a bank can withstand financial stress and remain solvent. Tier 1 common capital excludes any preferred shares or non-controlling interests.
Analysts use the common equity Tier 1 ratio as a way to grade a bank’s capital adequacy as one of the following:
- Well-capitalized
- Adequately Capitalized
- Undercapitalized
- Significantly undercapitalized
To be considered well capitalized a bank must have a Tier 1 common equity ratio of 7% or greater, and not pay a dividend or distributions that would reduce that ratio below 7%.
Recently the stress tests were released, and JP Morgan came out with flying colors.
JP Morgan’s Tier 1 common equity ratio for the latest stress test was 12.2%. So well above the minimum requirements, which means that banks and financial institutions could begin announcing their capital return plans for the coming twelve months.
JP Morgan announced the biggest capital returns, as the company plans to pay out $11 billion in dividends and repurchase $24.5 billion in stock buybacks through June 2019.
Another risk to take into account when looking at any bank is the charge-offs compared to the loans it is making. Because obviously if a bank is making bad loan decisions and not recouping those losses, that can be a drag on profitability.
Net charge-off to loan ratio
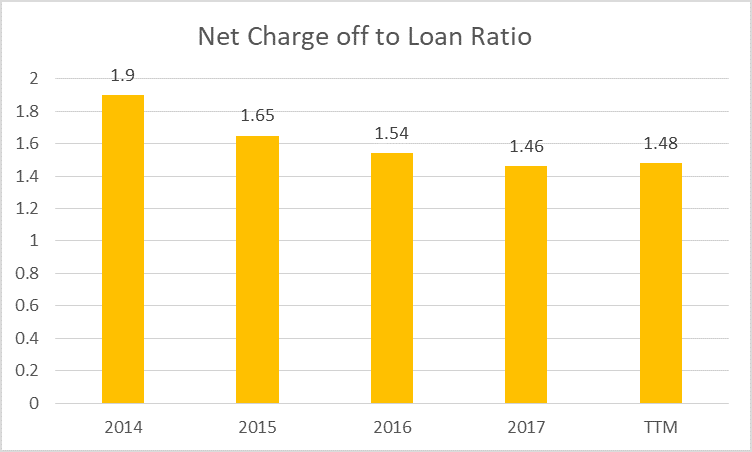
Chard courtesy of Intrinsic Value Formula
Net charge-offs refer to the debt owed to the bank that is unlikely to be recovered by the bank.
Net charge-offs are bad because that is money that is most likely lost forever to the bank and that is money lost to shareholders.
Finding this information takes a bit of digging into the notes of the financial statements, particularly in the Allowance for Credit Losses section.
But it is extremely worth it to get a better insight into the bank’s financials.
The beauty of this ratio is that it can show us how effective the bank is at controlling one of its biggest risk, bad loans, as you can see J P Morgan has seen a decrease in this ratio over the last five years.
The lower net charge-off to loan ratio is a good sign; it means it is doing a better job of mitigating its risks of bad loans. Or vetting it’s customers when doing the loan process.
Comparing this number to the data from FRED (Federal Reserve Bank of St. Louis) of 1.81 for the last four quarters indicates that J P Morgan has been doing a pretty good job of keeping this risk in line.
All in all, I would have to say based on the findings above that J P Morgan has done an outstanding job of mitigating its risks over the last five years.
The bank has improved its net charge-offs in regards to loans, and it’s Tier One Equity has been outstanding, especially considering this year the Fed put banks through the most stringent Stress tests to date.
Management
It all starts with Jamie Dimon, the CEO of JP Morgan. He has been with the bank since 2005 and helped steer it through the financial crisis and recession. The share price has more than doubled since he took over the reigns.
He has helped grow J P Morgan into the largest bank by market cap in the last few years. His annual letters are outstanding and provide lots of great advice and learnings.
They are probably the best annual letters, short of Warren Buffett’s annual letters, out there.
According to the latest poll by Business Insider, Dimon was rated the best CEO in the banking world.
He also tops the list in regards to being the highest paid CEO in the finance. As of 2017, he is raking in a paltry $28.3 million, of which $21.5 million was stock compensation. So his wealth is directly tied to the performance of the company. His compensation is tying into his wealth which can, of course, be good or bad.
Valuation
Let’s next talk about valuation. When assessing the value of a company I like to run several different calculations to give me a better feel for the range of possible values.
Remember what Buffet and Munger always like to say, “it is better to approximately right, then exactly wrong.”
First I like to use an oldie but goodie, the Graham formula.
Let’s look at the formula first.
V = EPS X ( 7 + 1g ) X 4.4 / Y
EPS = Current earnings per share
G = growth of the company, I like to use the last five-year average
Y = AAA corporate bond rate
Let’s gather some numbers and plug them in. Current EPS for J P Morgan is $7.51 for the TTM
Growth for the last five years from $5.29 to $7.51 would give us a growth rate of 7.26%.
The AAA corporate bond rate currently is 3.85%
So let’s plug in some numbers to see what the crystal ball will tell us.
V = 7.51 X (7 + 1*7.26 ) X 4.4 / 3.85
V = $122.39
Interesting, according to Graham’s formula J P Morgan would currently be undervalued at today’s prices, but not by much. Based on this number there would be a very slim margin of safety. Ideally, I would love 50%, but I would settle for 25%, and at that rate, I would be looking for a price of roughly $91.
Dividend Discount Model
Next up let’s use the dividend discount model, which is perfect for financials and banks. Especially a company that pays a dividend and a growing dividend like J P Morgan.
Recalling the formula:
V = Next year’s expected dividend / ( discount rate – growth rate )
First, let’s look at next year’s expected dividend. The current dividend is $2.24 TTM. The expected payout ratio will be 29.82%, and J P Morgan’s return on equity currently is 10.17%.
Therefore next year’s expected dividend will be $2.40.
Next, we will look at the discount rate, which will be the minimum required rate that would be acceptable to us. I will pick 10% as a starting point.
Finally, we will estimate the growth rate of the dividend over the last five years to give us a good range of numbers. Over the last five years, we have seen a 7.23% growth rate in our dividend.
Plugging in the numbers we get:
V = 2.40 / ( 0.10 – 0.0723 )
V = $86.64
If we did 8% required rate of return we would get $311 and if we did 12% rate of return we would get $50.
These are quite wide ranges, and one would have to be very skeptical of these numbers. This disparity is why we look at ranges as opposed to one specific number.
Valuation is an art form, and there are numerous formulas to help us achieve it. But the key is to remember to never rely on one calculation to make your decision.
Discounted Cash Flows
When digging into intrinsic value with a discounted cash flow model I like to take it two different ways.
- Comparing market caps
- Price per share
These numbers give a better visual of how much margin of safety I can look for my piece of mind.
First, using the market caps and discounted cash flows, over a ten year period using the free cash flow as my starting point to estimate what the cash flows will be ten years from now.
I will start by assuming a growth rate of 20% for years 1 to 3, 15% for years 4 to 6, and 10% for years 7 to 10.
Next, my discount rate will be 10%, and I am going to be using a framework I learned from Monish Pabrai’s The Dhando Investor. I like his “back of the envelope” calculations, which can make this a bit easier to research.
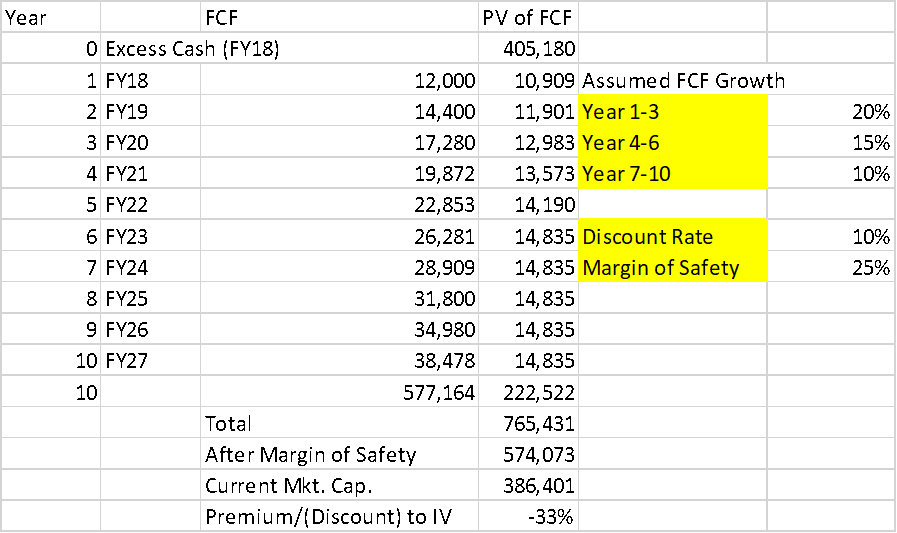
After running the numbers, I get a projected market of $774.13 million ten years from now.
Comparing that to the current market cap of $395.71 million it appears that the bank is undervalued. And if I add a margin of safety of 25% to the current market cap I get a future market cap of $555.95 million.
Which certainly seems doable and gives me a nice margin of safety.
Now, let’s see what happens if we run some numbers through a more traditional DCF.
Current earnings are $7.51 per share, and if we assume a 13% growth rate over the next ten years, and we have a terminal growth rate of 4% over those ten years. And finally a discount rate of 10%, as the minimum return we would like to see.
Once we calculate our formula, we come up with a future value of $160.48. Which comparing to the current price of $116.88 gives us a nice margin of safety of 27%.
I love doing this as it is a fantastic exercise to try to calculate the intrinsic value of a company. There are so many different variables, and we have to make a ton of assumptions in regards to discount rates, growth rates, and future values that this is a little like forecasting with a crystal ball.
Final Thoughts
In the words of Warren Buffett.
“In the Theory of Investment Value, written over 50 years ago, John Burr Williams set forth the equation for value, which we condense here: The value of any stock, bond or business today is determined by the cash inflows and outflows – discounted at an appropriate interest rate – that can be expected to occur during the remaining life of the asset.”
Calculating the intrinsic value using the discounted cash flows of the company can be a complicated exercise, but it doesn’t have to be.
We don’t even know if Warren Buffett even does them himself!
Using them to find a value can be helpful when we are trying to decide upon buying a company or adding additional shares to our portfolio.
The verdict on JP Morgan?
After looking closer at the many metrics that we explored and the recent stress test results you can see that J P Morgan is a well-run bank with many great things going for it.
Most notably it has a well-regarded leader in Jamie Dimon, with a great mix of deposit growth as well as investment bank growth.
The bank is very well placed to continue its fantastic growth over the last five years for many years to come.
And to answer my friend’s question, I still think that J P Morgan would be a great investment to add to any portfolio, even at the current dizzying heights of the market today.
Article By David Ahern, Intrinsic Value Formula


