Gold declined yesterday, or I should say, it rushed down at breakneck speed. And while it might have been a surprise for some, it wasn’t for me.
Q1 2021 hedge fund letters, conferences and more
However, we should stay alert to any possible changes, as no market moves in a straight line. Tread carefully.
On a side note, while I didn’t check it myself (well, it’s impossible to read every article out there), based on the correspondence I’m receiving, it appears I’ve been the only one of the more popular authors to be actually bearish on gold before the start of this week. Please keep that in mind, along with me saying that yesterday’s decline is just the beginning, even though a short-term correction might start soon. Having that in mind, let’s discuss what the Fed did (and what it didn’t do) in greater detail.
Look What You Did
With the U.S. Federal Reserve’s (FED) reverse-repo nightmare frightening the liquidity out of the system, I highlighted on Jun. 17 that the FED raised the interest rate on excess reserves (IOER) from 0.10% to 0.15%.
I wrote:
The FED hopes that by offering a higher interest rate that it will deter counterparties from participating in the reverse repo transactions. However, whether it will or whether it won’t is not important. The headline is that the FED is draining liquidity from the system and increasing the IOER is another sign that the U.S. federal funds rate could soon seek higher ground.
Please see below:
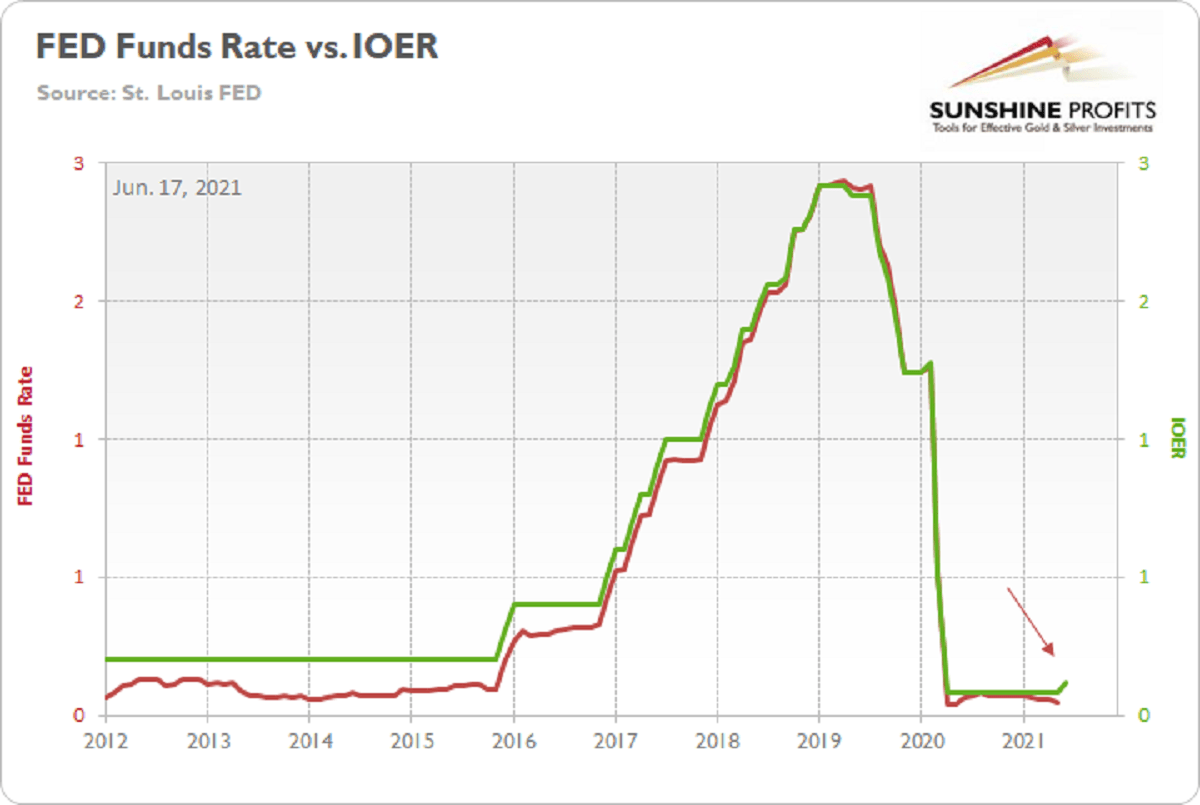
To explain, the red line above tracks the U.S. federal funds rate, while the green line above tracks the IOER. If you analyze the behavior, you can see that the two have a rather close connection. And while we don’t expect the FED to raise interest rates anytime soon, officials’ words, actions and the macroeconomic data signal that the taper is likely coming in September.
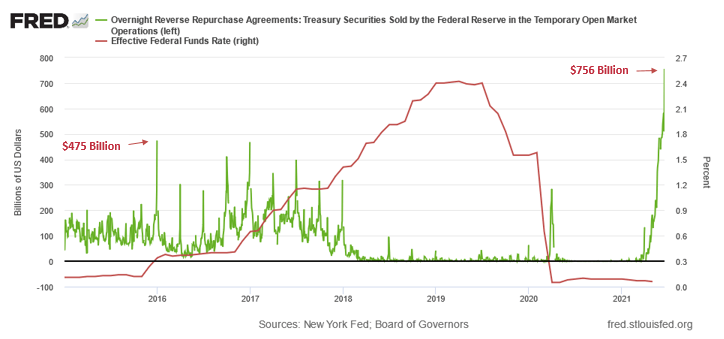
And in an ironic twist, while the question of whether it will or whether it won’t seemed reasonable at the time, the tsunami of reverse repurchase agreements on Jun. 17 signal that 0.15% just isn’t going to cut it. Case in point: while the FED hoped that the five-basis-point olive branch would calm institutions’ nerves, a record $756 billion in excess liquidly was shipped to the FED on Jun. 17 . For context, it was nearly $235 billion more than the daily amount recorded on Jun. 16.
Please see below:
To explain the significance, I wrote previously:
A reverse repurchase agreement (repo) occurs when an institution offloads cash to the FED in exchange for a Treasury security (on an overnight or short-term basis). And with U.S. financial institutions currently flooded with excess liquidity, they’re shipping cash to the FED at an alarming rate.
The green line above tracks the daily reverse repo transactions executed by the FED, while the red line above tracks the U.S. federal funds rate. Moreover, notice what happened the last time reverse repos moved above 400 billion? If you focus your attention on the red line, you can see that after the $400 billion level was breached in December 2015, the FED’s rate-hike cycle began. Thus, with current inflation dwarfing 2015 levels and U.S. banks practically throwing cash at the FED, is this time really different?
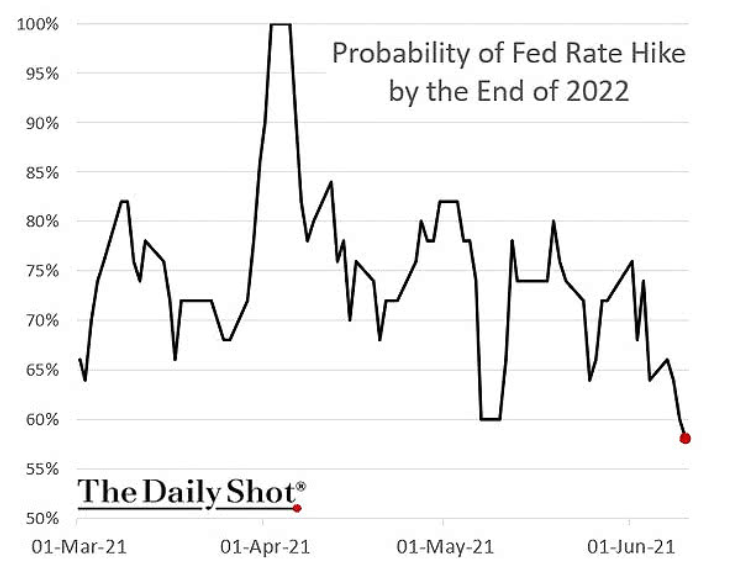
Furthermore, I noted on Jun. 17 that the FED’s latest ‘dot plot’ was a hawkish shift that market participants were not expecting.
I wrote:
The perceived probability of a rate hike by the end of 2022 sunk to a 2021 low on Jun. 12. However, after the FED’s material about-face on Jun. 16, I’m sure these positions have been recalibrated.
Please see below:
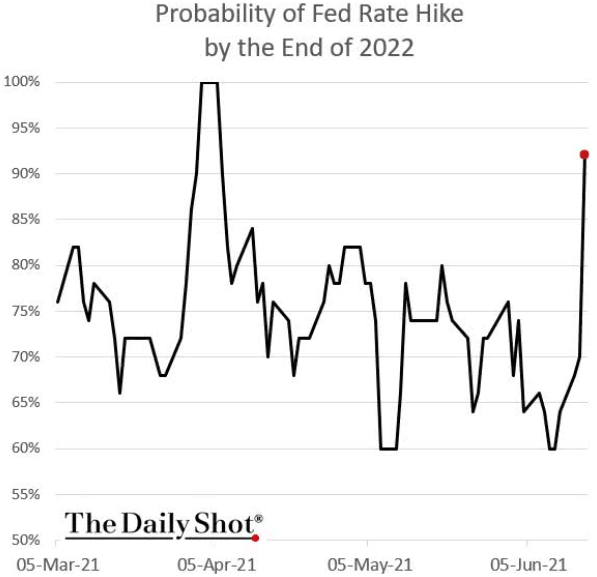
And as if the chart above had been inverted, the perceived probability of a rate hike by the end of 2022 has now surged to more than 90%.
The Death Toll of June 17th
In addition, while I’ve been warning for months that the bond market’s fury would eventually upend the PMs, not only has the FED’s inflationary misstep rattled the financial markets, but the U.S. 30-year fixed-rate mortgage (FRM) jumped to 3.25% on Jun. 17.
Please see below:
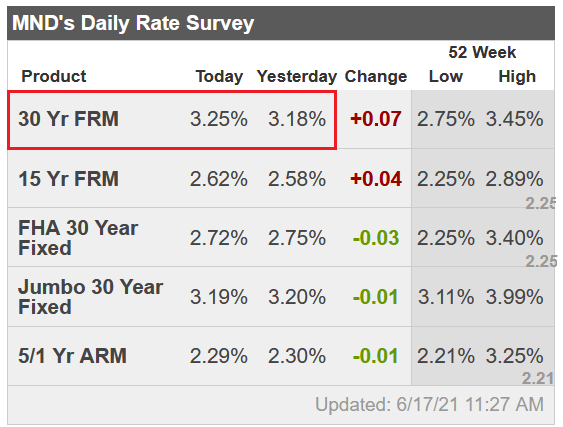
Source: Mortgage News Daily
Furthermore, please read what Matthew Graham, COO of Mortgage News Daily, had to say:
“Markets were somewhat surprised by the Fed’s rate hike outlook. Granted, the Fed Funds Rate (the thing the Fed would actually be hiking) doesn’t control mortgage rates, but the outlook speaks to how quickly the Fed would need to dial back its bond buying programs (aka “tapering”). Those programs definitely help keep rates low. The sooner the Fed begins tapering, the sooner mortgage rates will see some upward pressure .”
To that point, with tapering prophecies officially morphing from the minority into the consensus, the PMs weren’t the only commodities sent to slaughter on Jun. 17. For example, the S&P Goldman Sachs Commodity Index (S&P GSCI) plunged by 2.37% as the inflationary unwind spread. For context, the S&P GSCI contains 24 commodities from all sectors: six energy products, five industrial metals, eight agricultural products, three livestock products and two precious metals.
Exacerbating the selling pressure, China’s National Food and Strategic Reserves Administration announced on Jun. 17 that it would release its copper, aluminum and zinc supplies “in the near future” in a bid to contain the inflationary surge that’s plaguing the region. As a result, if the psychological forces that led to the surge in cost-push inflation come undone, the USD Index could move from the outhouse to the penthouse.
To explain, I wrote on Apr. 27:
Why is the behavior of the S&P GSCI so important? Well, if you analyze the chart below, you can see that the S&P GSCI’s pain is often the USD Index’s gain.
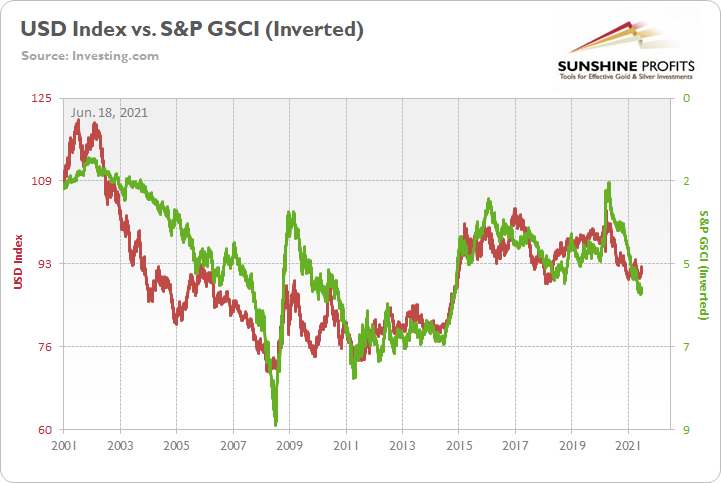
To explain, the red line above tracks the USD Index, while the green line above tracks the inverted S&P GSCI. For context, inverted means that the S&P GSCI’s scale is flipped upside down and that a rising green line represents a falling S&P GSCI, while a falling green line represents a rising S&P GSCI. More importantly, though, since 2010, it’s been a near splitting image.
Inflation Is Still There
In the meantime, though, inflationary pressures are far from contained. And while the S&P GSCI’s plight would be a boon for the USD Index, the greenback still has plenty of other bullets in its chamber. Case in point: with the FED poised to taper in September and investors underpricing the relative outperformance of the U.S. economy, VANDA Research’s latest FX Outlook signals that over-optimism abroad could lead to a material re-rating over the summer.
Please see below:
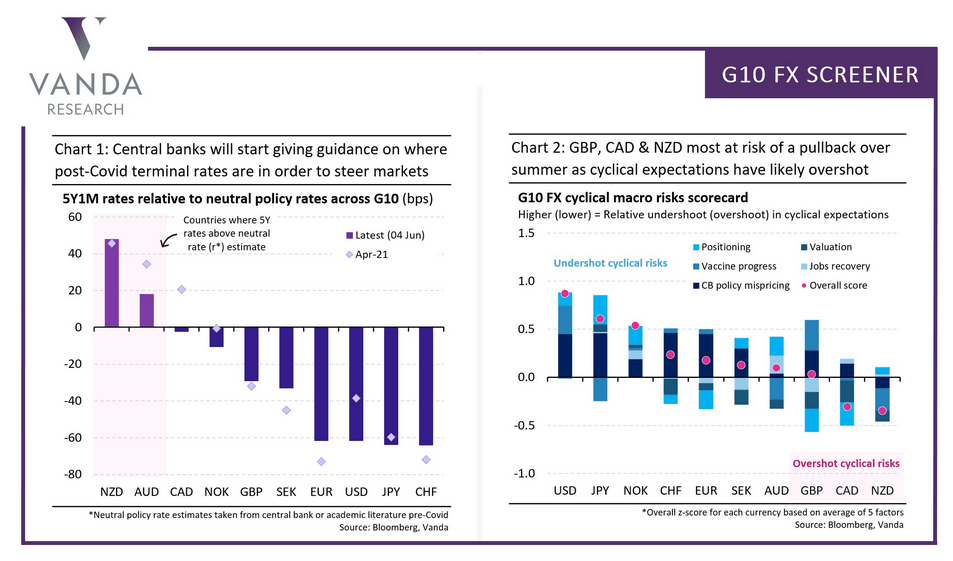
To explain, the chart on the right depicts investors’ expectations of economic strength across various regions. If you analyze the second (CAD) and the third (GBP) bars from the right, you can see that positioning is more optimistic than the economic growth that’s likely to materialize. Conversely, if you analyze the first bar (USD) from the left, you can see that positioning is more pessimistic than the economic growth that’s likely to materialize. As a result, with U.S. GDP growth poised to outperform the U.K., Canada, and the Eurozone, an upward re-rating of the USD Index could intensify the PMs selling pressure over the medium term.
On top of that, while the inflation story is far from over (and will pressure the FED to taper in September), the Philadelphia FED released its Manufacturing Business Outlook Survey on Jun. 17. And while manufacturing activity dipped in June, “the diffusion index for future general activity increased 17 points from its May reading, reaching 69.2, its highest level in nearly 30 years .”
In addition, “the employment index increased 11 points, recovering its losses from last month,” and “the future employment index rose 2 points … [as] over 59 percent of the firms expect to increase employment in their manufacturing plants over the next six months, compared with only 5% that anticipates employment declines.” For context, employment is extremely important because a strengthening U.S. labor market will likely put the final nail in QE’s coffin.
But saving the best for last:
“The prices paid diffusion index rose for the second consecutive month, 4 points to 80.7, its highest reading since June 1979 . The percentage of firms reporting increases in input prices (82 percent) was higher than the percentage reporting decreases (1 percent). The current prices received index rose for the fourth consecutive month, moving up 9 points to 49.7, its highest reading since October 1980 .”
Please see below:
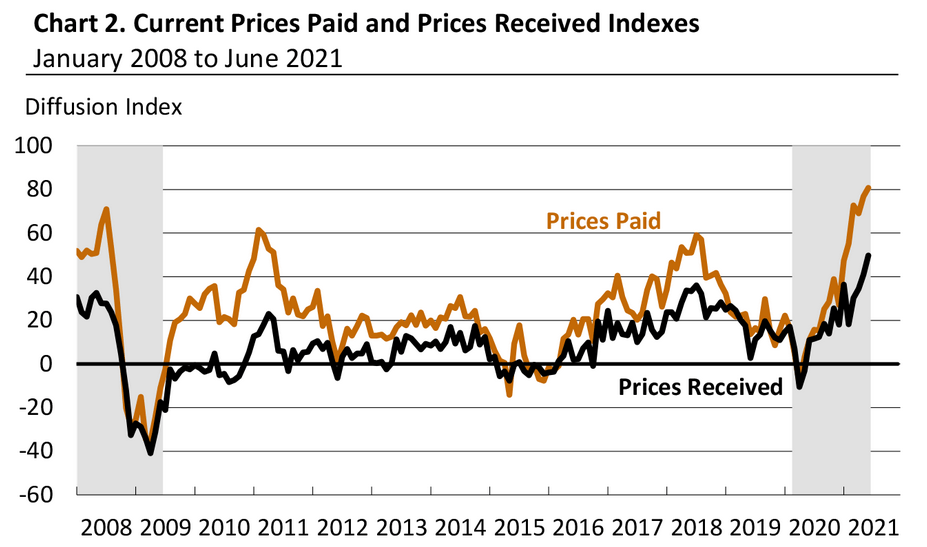
Source: Philadelphia FED
Investment Clock Is Ticking
Also, signaling that QE is living on borrowed time, Bank of America’s ‘Investment Clock’ is ticking toward a bear flattener in the second half of 2021. For context, the term implies that short-term interest rates will rise at a faster pace than long-term interest rates and result in a ‘flattening’ of the U.S. yield curve.
Please see below:
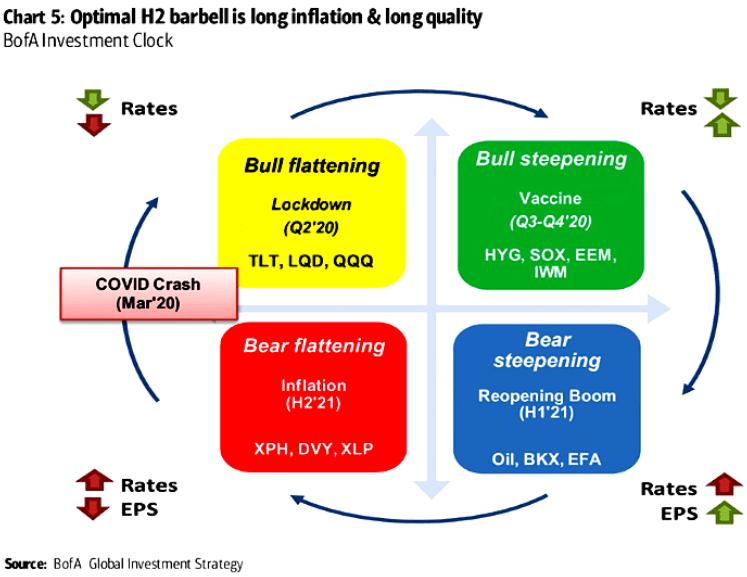
To explain, the circular reference above depicts the appropriate positioning during various stages of the economic cycle. If you focus your attention on the red box, you can see that BofA forecasts higher interest rates and lower earnings per share (EPS) for S&P 500 companies during the back half of the year.
As further evidence, not only is the FED’s faucet likely to creak in the coming months, but fiscal stimulus may be nearing the dry season as well.
Please see below:
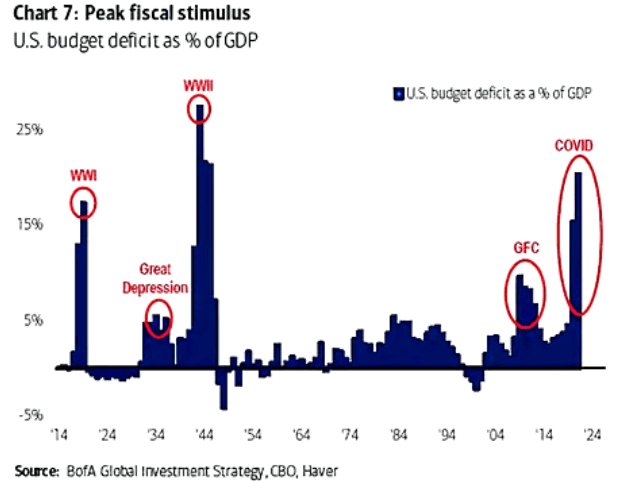
To explain, the blue bars above track the U.S. budget deficit as a percentage of the GDP. If you analyze the red circle on the right side of the chart, you can see that coronavirus-induced spending was only superseded by World War Two. Moreover, with the law of gravity implying that ‘what goes up must come down,’ the forthcoming infrastructure package could be investors’ final fiscal withdrawal.
The Housing Market
Last but not least, while the S&P 500 has remained relatively upbeat in recent days, weakness in the U.S. housing market could shift the narrative over the medium term.
Please see below:
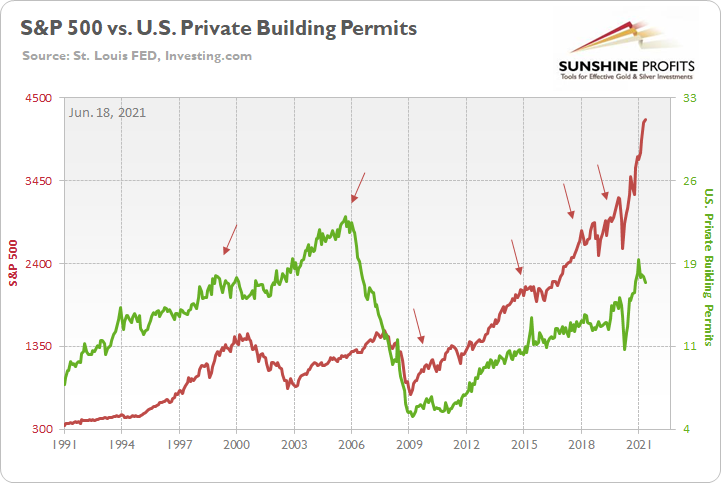
To explain, the red line above tracks the S&P 500, while the green line above tracks U.S. private building permits (released on Jun. 16). If you analyze the arrows, you can see that the former nearly always rolls over in advance of the latter . For context, the S&P 500 initially peaked before building permits in 2018 and alongside in 2015. However, in 2018, when the S&P 500 recovered and continued its ascent – while building permits did not – the U.S. equity benchmark suffered a roughly 20% drawdown. Thus, if you analyze the right side of the chart, you can see that building permits peaked in January and have declined significantly. And if history is any indication, the S&P 500 will eventually follow suit.
In conclusion, the PMs imploded on Jun. 17, as taper trepidation and the USD Index’s sharp re-rating dropped the guillotine on the metals. And with the FED’s latest ‘dot plot’ akin to bullet holes in the PMs, the walking wounded is still far from a recovery. With inflation surging and the FED likely to become even more hawkish in the coming months, the cycle has materially shifted from the goldilocks environment that the metals once enjoyed. And with the two-day price action likely the opening act of a much larger play, the PMs could be waiting months for another round of applause.
Thank you for reading our free analysis today. Please note that the above is just a small fraction of today’s all-encompassing Gold & Silver Trading Alert. The latter includes multiple premium details such as the targets for gold and mining stocks that could be reached in the next few weeks. If you’d like to read those premium details, we have good news for you. As soon as you sign up for our free gold newsletter, you’ll get a free 7-day no-obligation trial access to our premium Gold & Silver Trading Alerts. It’s really free – sign up today.
Przemyslaw Radomski, CFA
Founder, Editor-in-chief
Sunshine Profits: Effective Investment through Diligence & Care
All essays, research and information found above represent analyses and opinions of Przemyslaw Radomski, CFA and Sunshine Profits’ associates only. As such, it may prove wrong and be subject to change without notice. Opinions and analyses are based on data available to authors of respective essays at the time of writing. Although the information provided above is based on careful research and sources that are deemed to be accurate, Przemyslaw Radomski, CFA and his associates do not guarantee the accuracy or thoroughness of the data or information reported. The opinions published above are neither an offer nor a recommendation to purchase or sell any securities. Mr. Radomski is not a Registered Securities Advisor. By reading Przemyslaw Radomski’s, CFA reports you fully agree that he will not be held responsible or liable for any decisions you make regarding any information provided in these reports. Investing, trading and speculation in any financial markets may involve high risk of loss. Przemyslaw Radomski, CFA, Sunshine Profits’ employees and affiliates as well as members of their families may have a short or long position in any securities, including those mentioned in any of the reports or essays, and may make additional purchases and/or sales of those securities without notice.


